| Param | Original file | Final file |
|---|---|---|
| Filename | modeM0/AS1P01_120T01_9000000006_00152cztM0_level2.evt | modeM0/AS1P01_120T01_9000000006_00152cztM0_level2_quad_clean.evt |
| Size (bytes) | 1,023,284,160 | 56,393,280 |
| Size | 975.9 MB | 53.8 MB |
| Events in quadrant A | 7,446,384 | 325,613 |
| Events in quadrant B | 7,630,239 | 335,695 |
| Events in quadrant C | 6,693,631 | 326,850 |
| Events in quadrant D | 8,839,801 | 316,945 |
| Mode SS | |||
|---|---|---|---|
| Quadrant | BADHDUFLAG | Total packets | Discarded packets |
| A | 0 | 118 | 0 |
| B | 0 | 118 | 0 |
| C | 0 | 118 | 0 |
| D | 0 | 118 | 0 |
| Mode M9 | |||
|---|---|---|---|
| Quadrant | BADHDUFLAG | Total packets | Discarded packets |
| A | 0 | 16 | 0 |
| B | 0 | 16 | 0 |
| C | 0 | 16 | 0 |
| D | 0 | 16 | 0 |
| Mode M0 | |||
|---|---|---|---|
| Quadrant | BADHDUFLAG | Total packets | Discarded packets |
| A | 0 | 26213 | 2 |
| B | 0 | 26771 | 1 |
| C | 0 | 23954 | 1 |
| D | 0 | 30331 | 1 |
| Quadrant | Total seconds | Saturated seconds | Saturation percentage |
|---|---|---|---|
| A | 5748 | 5 | 0.086987% |
| B | 5748 | 23 | 0.400139% |
| C | 5748 | 56 | 0.974252% |
| D | 5748 | 189 | 3.288100% |
Noise dominated data is calculated using 1-second bins in cleaned event files. If a bin has >2000 counts, and if more than 50% of those come from <1% of pixels, then it is considered to be noise-dominated and hence unusable.
| Quadrant | # 1 sec bins | Bins with >0 counts | Bins with >2000 counts | High rate bins dominated by noise | Noise dominated (total time) | Noise dominated (detector-on time) | Marked lightcurve |
|---|---|---|---|---|---|---|---|
| A | 7341 | 5750 | 218 | 218 | 2.97% | 3.79% | 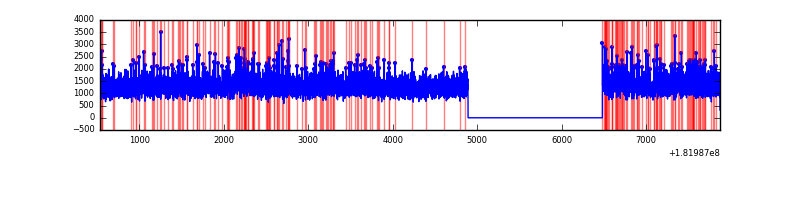 |
| B | 7341 | 5750 | 260 | 260 | 3.54% | 4.52% | 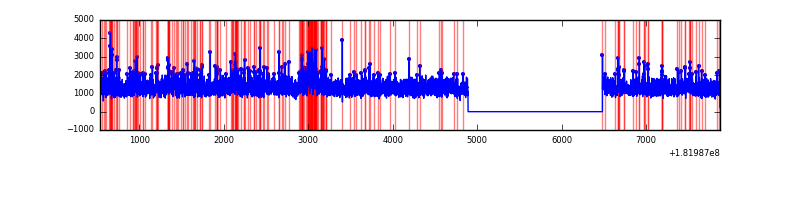 |
| C | 7341 | 5750 | 139 | 139 | 1.89% | 2.42% | 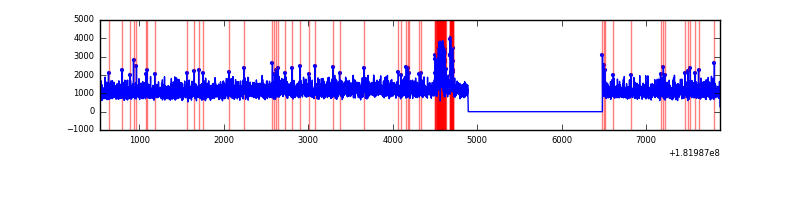 |
| D | 7341 | 5750 | 819 | 819 | 11.16% | 14.24% | 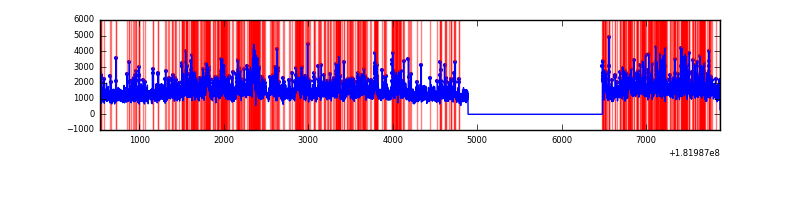 |
Top three noisy pixels from each quadrant. If the there are fewer than three noisy pixels in the level2.evt file, extra rows are filled as -1
| Pixel properties | Quadrant properties | ||||||
|---|---|---|---|---|---|---|---|
| Quadrant | DetID | PixID | Counts | Sigma | Mean | Median | Sigma |
| A | 14 | 10 | 38936 | 120.83 | 1869 | 1829 | 307.1 |
| A | 13 | 9 | 38124 | 118.18 | 1869 | 1829 | 307.1 |
| A | 0 | 86 | 19927 | 58.93 | 1869 | 1829 | 307.1 |
| B | 10 | 199 | 353071 | 863.76 | 1803 | 1810 | 406.7 |
| B | 8 | 236 | 106229 | 256.77 | 1803 | 1810 | 406.7 |
| B | 0 | 214 | 59628 | 142.18 | 1803 | 1810 | 406.7 |
| C | 9 | 54 | 205856 | 439.79 | 1639 | 1699 | 464.2 |
| C | 0 | 188 | 15758 | 30.28 | 1639 | 1699 | 464.2 |
| C | 10 | 17 | 8528 | 14.71 | 1639 | 1699 | 464.2 |
| D | 13 | 222 | 729438 | 1614.94 | 1728 | 1742 | 450.6 |
| D | 13 | 169 | 261378 | 576.2 | 1728 | 1742 | 450.6 |
| D | 13 | 223 | 169760 | 372.87 | 1728 | 1742 | 450.6 |
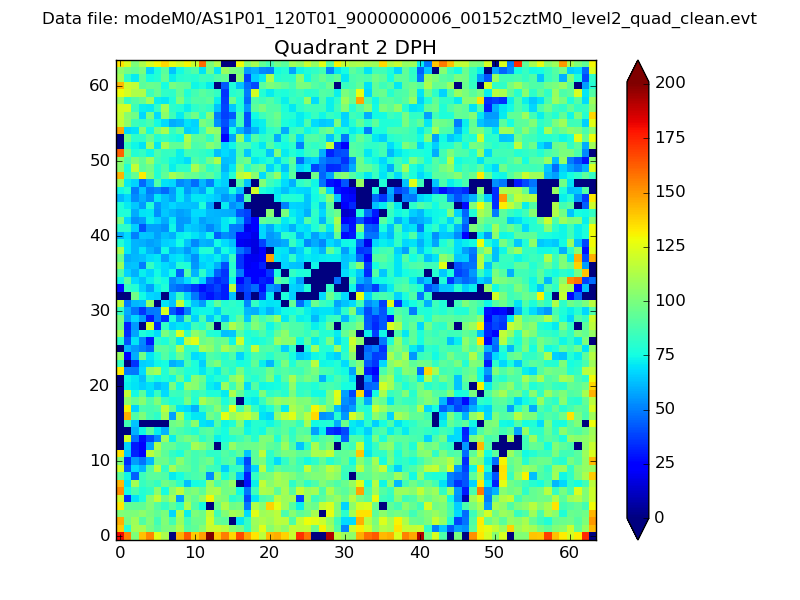
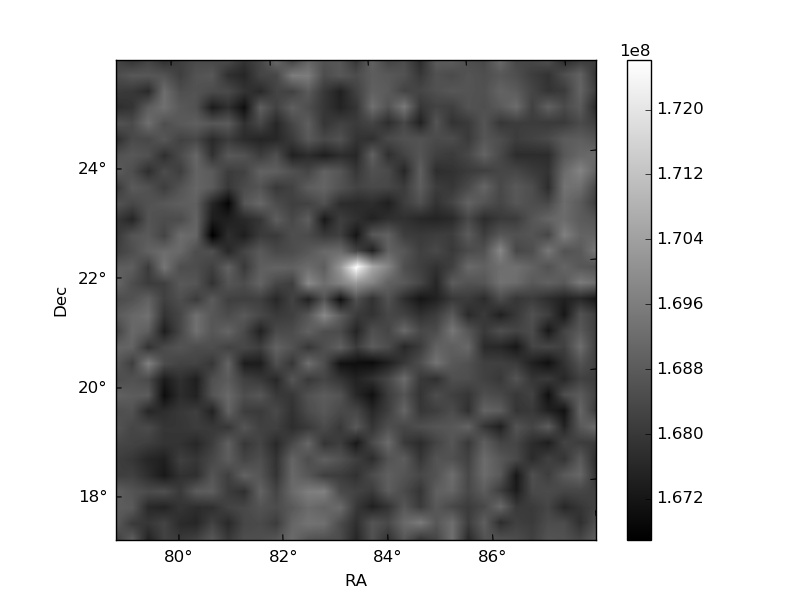
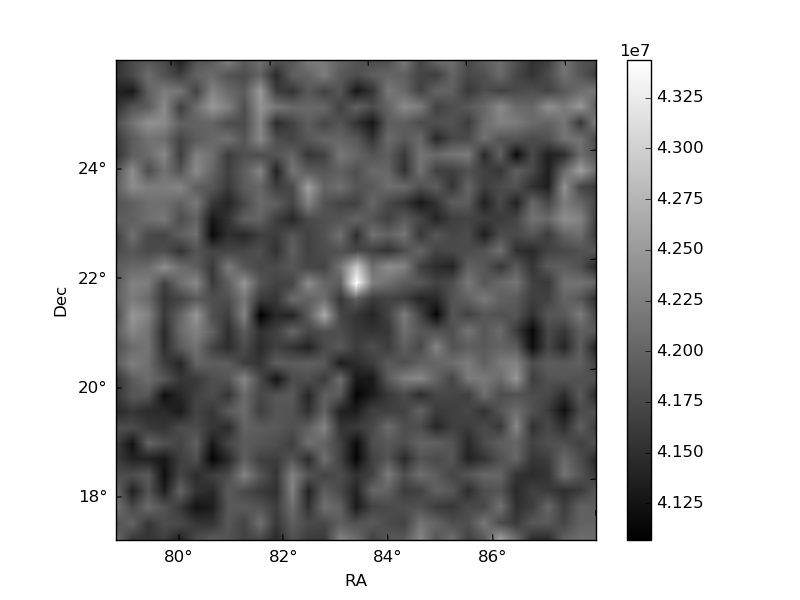
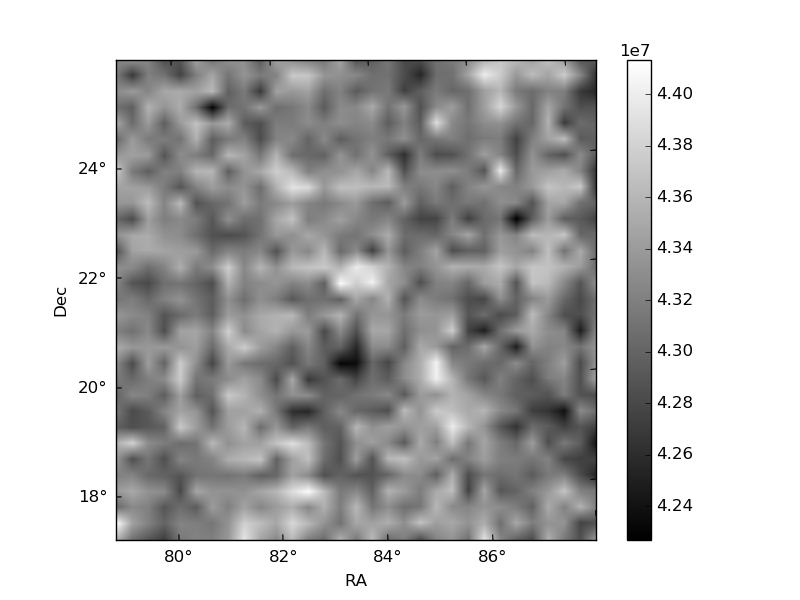
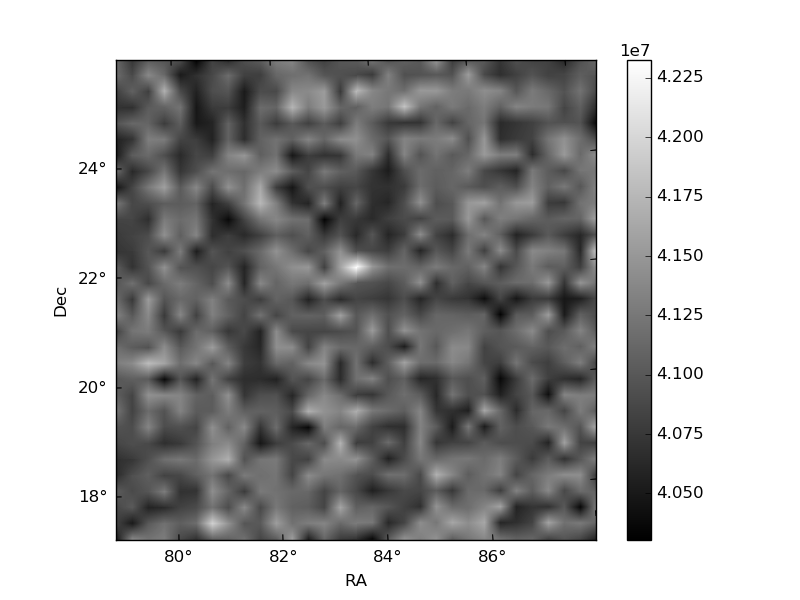
Histogram calculated using DETX and DETY for each event in the final _common_clean file
| Quadrant A | 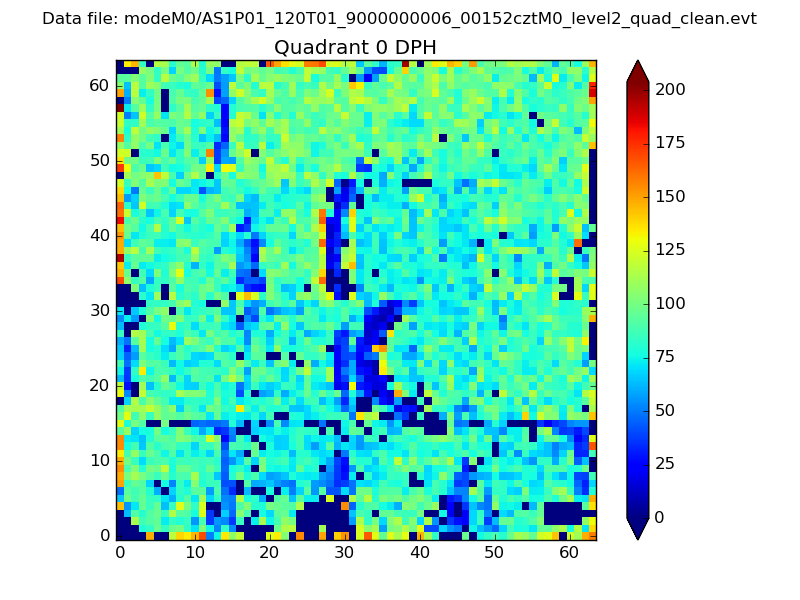 |
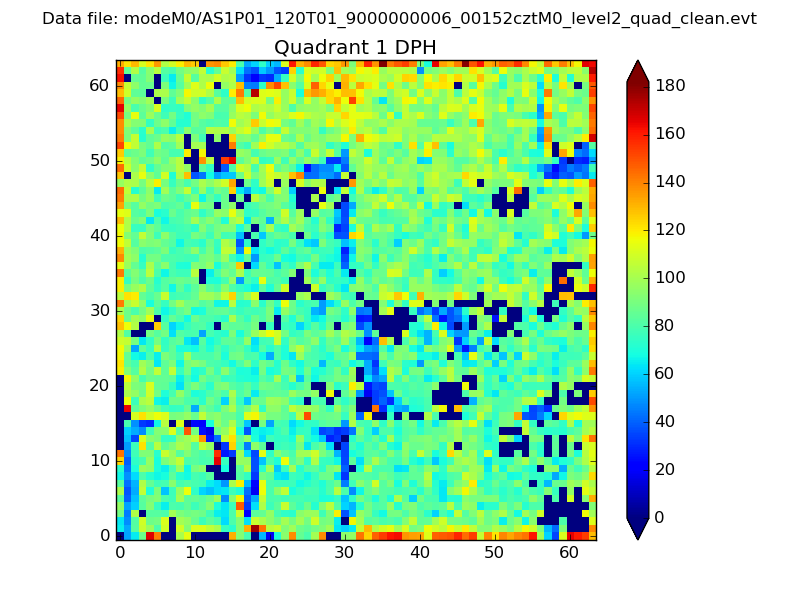 |
Quadrant B |
|---|---|---|---|
| Quadrant D | 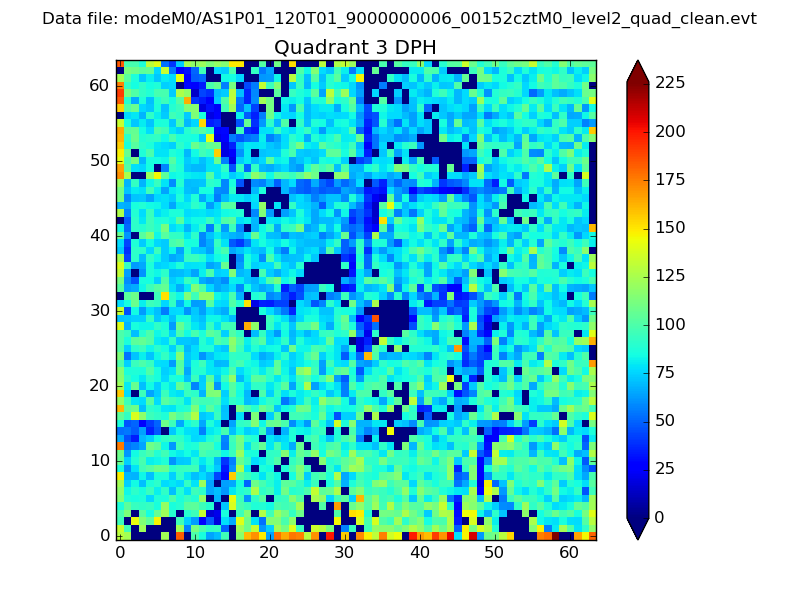 |
 |
Quadrant C |
| Plot type | Count rate plots | Images |
|---|---|---|
| Comparison with Poisson distribution Blue bars denote a histogram of data divided into 1 sec bins. Red curve is a Poisson curve with rate = median count rate of data. |
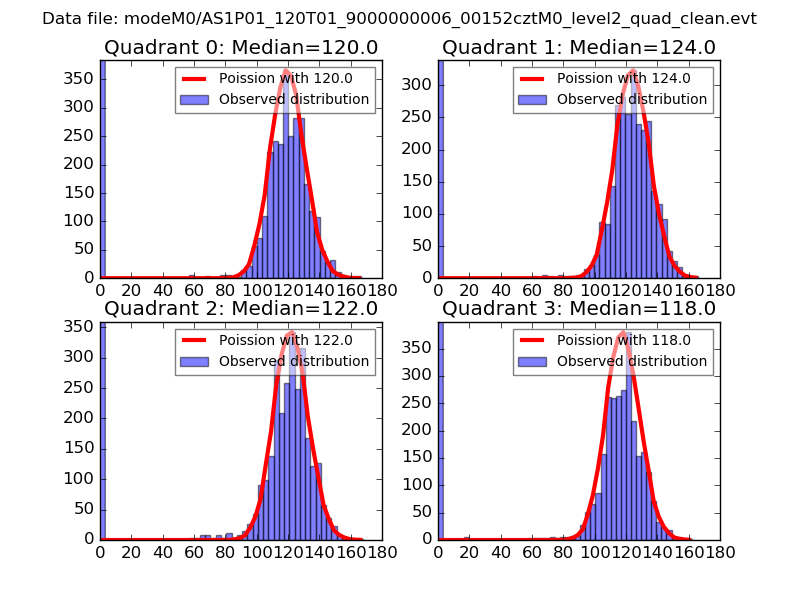 |
 |
| Quadrant-wise count rates Data is divided into 100 sec bins |
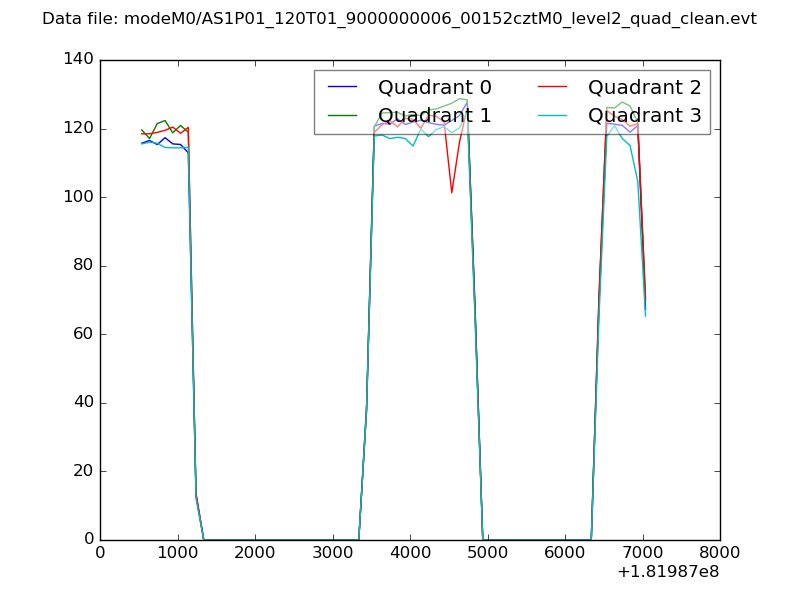 |
|
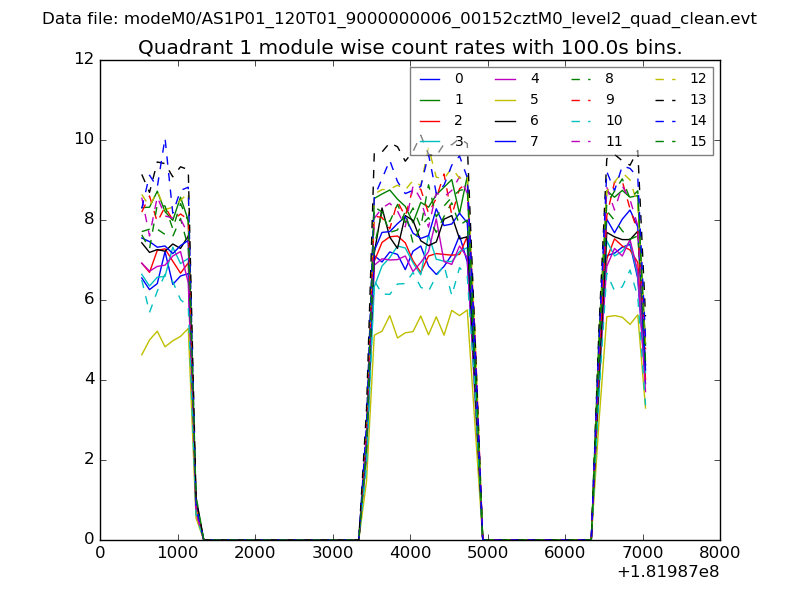
| Module-wise count rates for Quadrant A Data is divided into 100 sec bins |
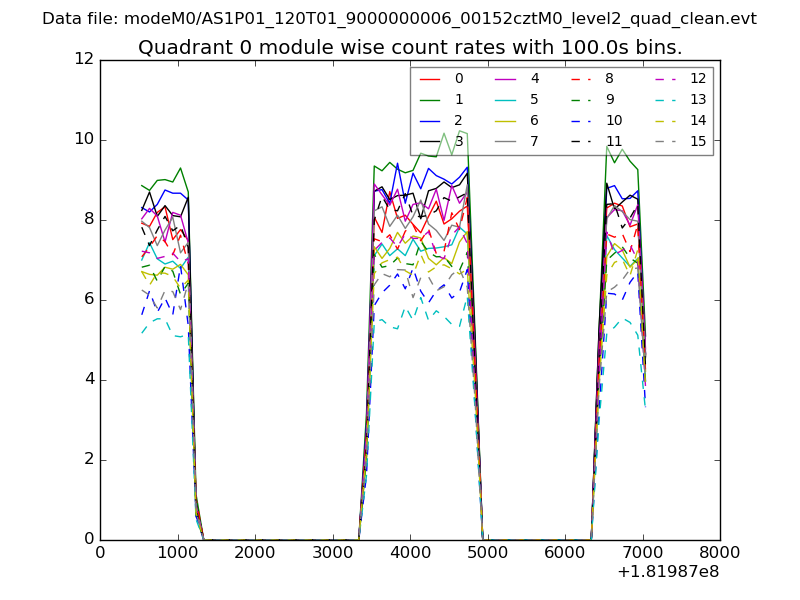 |
 |
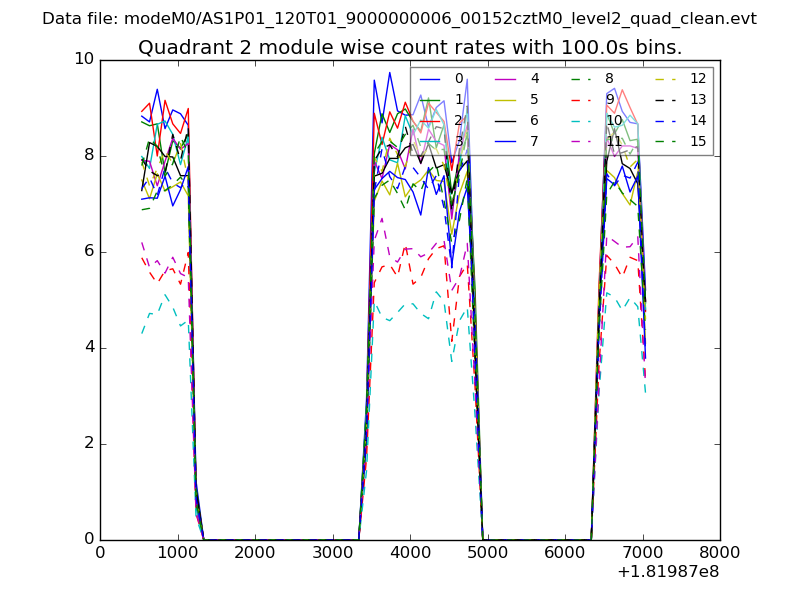
| Module-wise count rates for Quadrant B Data is divided into 100 sec bins |
 |
 |
| Module-wise count rates for Quadrant C Data is divided into 100 sec bins |
 |
 |
| Module-wise count rates for Quadrant D Data is divided into 100 sec bins |
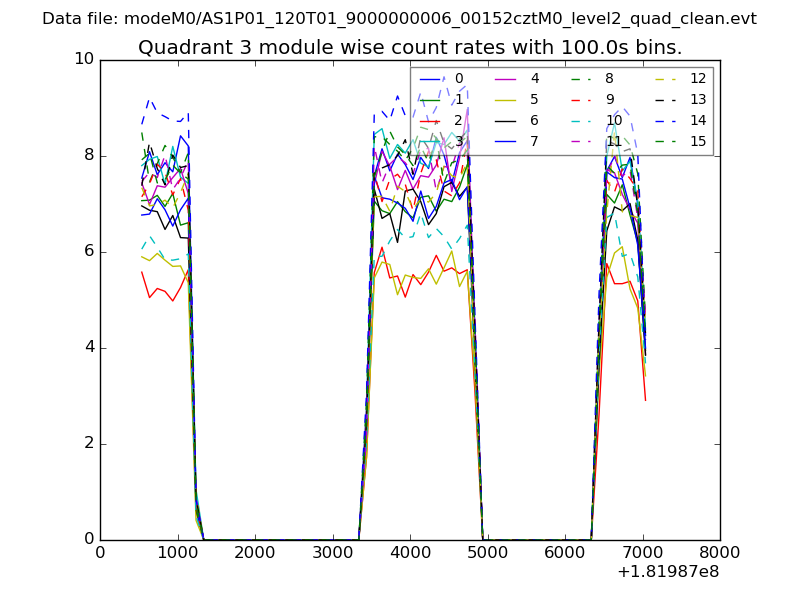 |
 |
| Parameter | Plot |
|---|---|
| CZT HV Monitor | 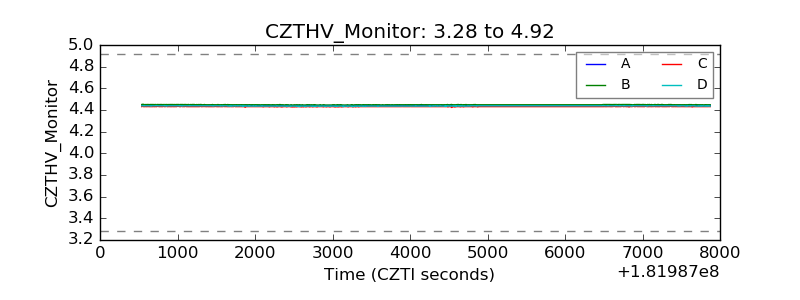 |
| D_VDD | 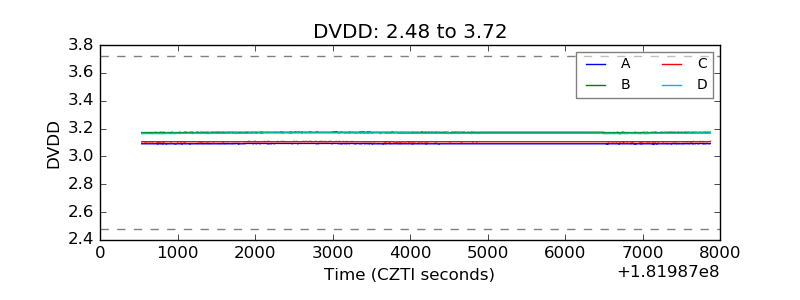 |
| Temperature 1 |  |
| Veto HV Monitor | 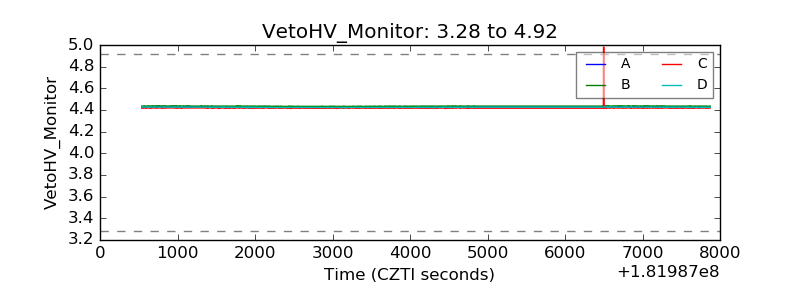 |
| Veto LLD |  |
| Alpha Counter | 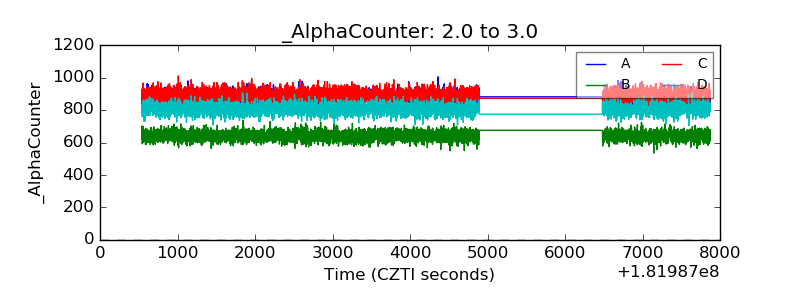 |
| _CPM_Rate | 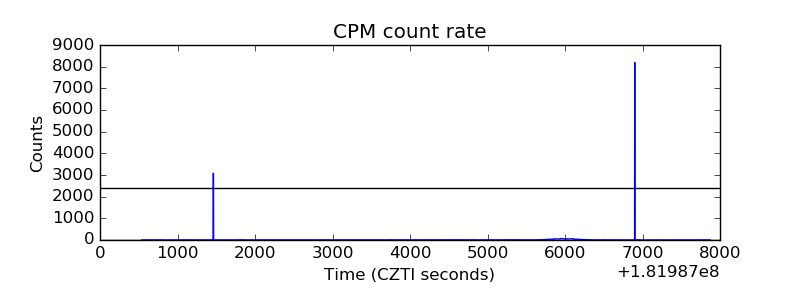 |
| CZT Counter | 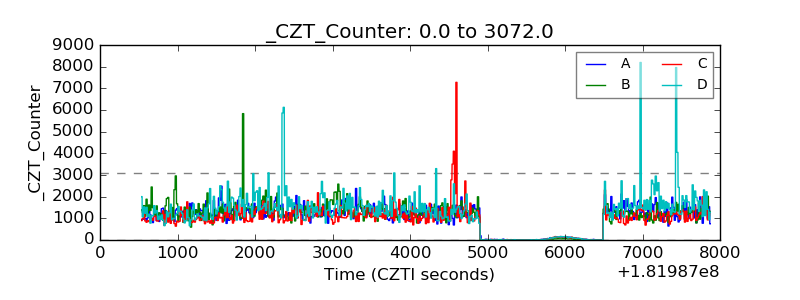 |
| +2.5 Volts monitor |  |
| +5 Volts monitor |  |
| _ROLL_ROT | 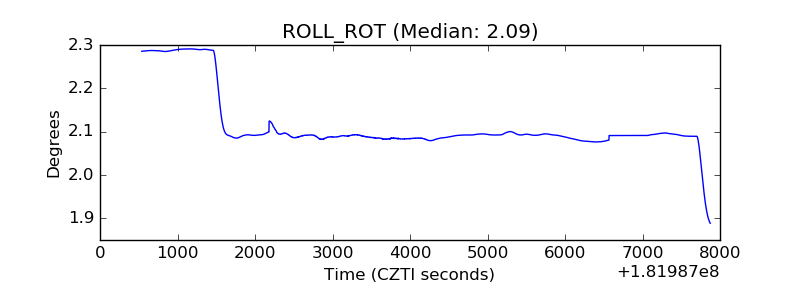 |
| _Roll_DEC | 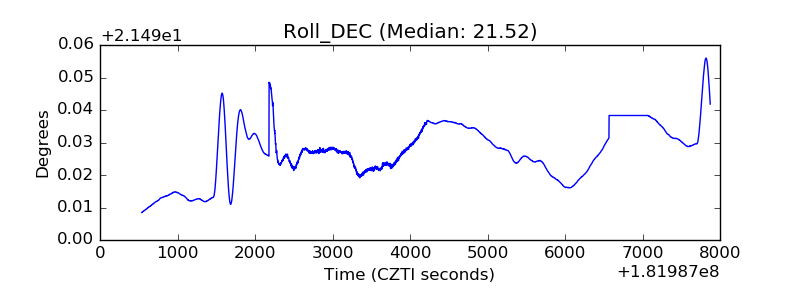 |
| _Roll_RA | 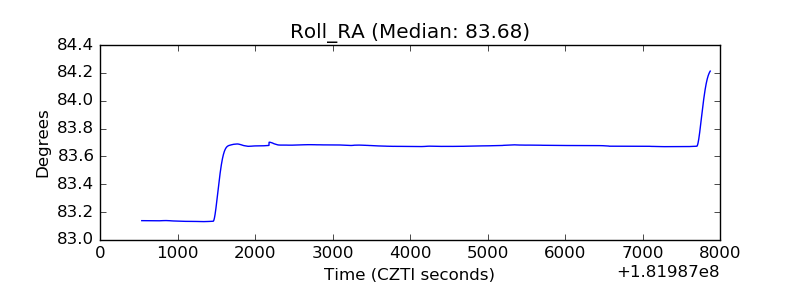 |
| Veto Counter | 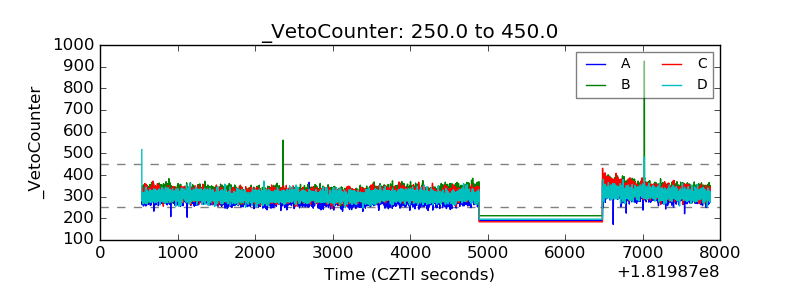 |