| Param | Original file | Final file |
|---|---|---|
| Filename | modeM0/AS1P01_120T01_9000000006_00154cztM0_level2.evt | modeM0/AS1P01_120T01_9000000006_00154cztM0_level2_quad_clean.evt |
| Size (bytes) | 953,611,200 | 46,134,720 |
| Size | 909.4 MB | 44.0 MB |
| Events in quadrant A | 8,393,407 | 240,990 |
| Events in quadrant B | 7,421,412 | 270,502 |
| Events in quadrant C | 6,298,814 | 266,911 |
| Events in quadrant D | 6,425,012 | 256,135 |
| Mode SS | |||
|---|---|---|---|
| Quadrant | BADHDUFLAG | Total packets | Discarded packets |
| A | 0 | 110 | 0 |
| B | 0 | 110 | 0 |
| C | 0 | 110 | 0 |
| D | 0 | 110 | 0 |
| Mode M9 | |||
|---|---|---|---|
| Quadrant | BADHDUFLAG | Total packets | Discarded packets |
| A | 0 | 16 | 0 |
| B | 0 | 16 | 0 |
| C | 0 | 16 | 0 |
| D | 0 | 16 | 0 |
| Mode M0 | |||
|---|---|---|---|
| Quadrant | BADHDUFLAG | Total packets | Discarded packets |
| A | 0 | 28801 | 2 |
| B | 0 | 25808 | 1 |
| C | 0 | 22488 | 1 |
| D | 0 | 23047 | 2 |
| Quadrant | Total seconds | Saturated seconds | Saturation percentage |
|---|---|---|---|
| A | 5306 | 513 | 9.668300% |
| B | 5243 | 126 | 2.403204% |
| C | 5323 | 3 | 0.056359% |
| D | 4754 | 185 | 3.891460% |
Noise dominated data is calculated using 1-second bins in cleaned event files. If a bin has >2000 counts, and if more than 50% of those come from <1% of pixels, then it is considered to be noise-dominated and hence unusable.
| Quadrant | # 1 sec bins | Bins with >0 counts | Bins with >2000 counts | High rate bins dominated by noise | Noise dominated (total time) | Noise dominated (detector-on time) | Marked lightcurve |
|---|---|---|---|---|---|---|---|
| A | 6914 | 5309 | 1030 | 1030 | 14.90% | 19.40% | 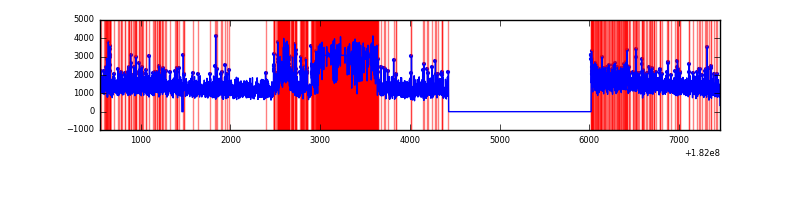 |
| B | 6914 | 5247 | 470 | 470 | 6.80% | 8.96% | 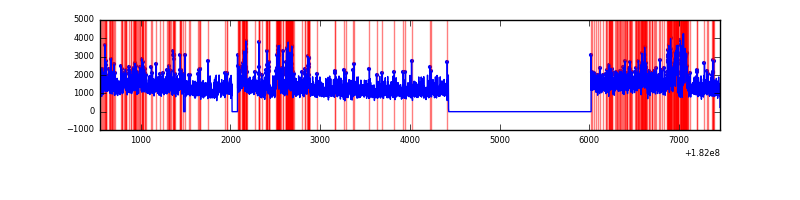 |
| C | 6914 | 5325 | 81 | 81 | 1.17% | 1.52% | 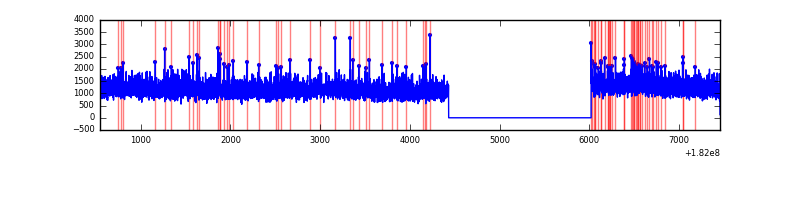 |
| D | 6914 | 4758 | 458 | 458 | 6.62% | 9.63% | 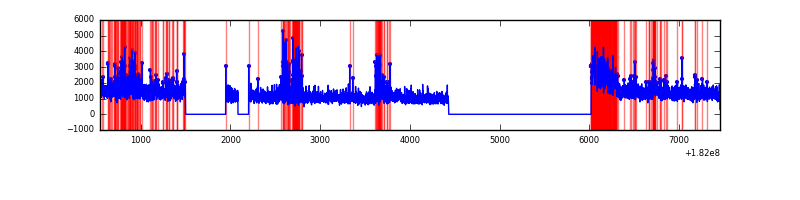 |
Top three noisy pixels from each quadrant. If the there are fewer than three noisy pixels in the level2.evt file, extra rows are filled as -1
| Pixel properties | Quadrant properties | ||||||
|---|---|---|---|---|---|---|---|
| Quadrant | DetID | PixID | Counts | Sigma | Mean | Median | Sigma |
| A | 0 | 86 | 1805968 | 5355.46 | 1656 | 1639 | 336.9 |
| A | 14 | 201 | 37177 | 105.48 | 1656 | 1639 | 336.9 |
| A | 8 | 50 | 35793 | 101.37 | 1656 | 1639 | 336.9 |
| B | 10 | 199 | 726702 | 1839.99 | 1675 | 1681 | 394.0 |
| B | 8 | 236 | 61068 | 150.71 | 1675 | 1681 | 394.0 |
| B | 5 | 216 | 42032 | 102.4 | 1675 | 1681 | 394.0 |
| C | 9 | 54 | 38107 | 82.38 | 1570 | 1629 | 442.8 |
| C | 0 | 218 | 29393 | 62.7 | 1570 | 1629 | 442.8 |
| C | 0 | 207 | 12905 | 25.47 | 1570 | 1629 | 442.8 |
| D | 14 | 53 | 475758 | 1194.45 | 1379 | 1419 | 397.1 |
| D | 13 | 223 | 241071 | 603.48 | 1379 | 1419 | 397.1 |
| D | 13 | 222 | 66821 | 164.69 | 1379 | 1419 | 397.1 |
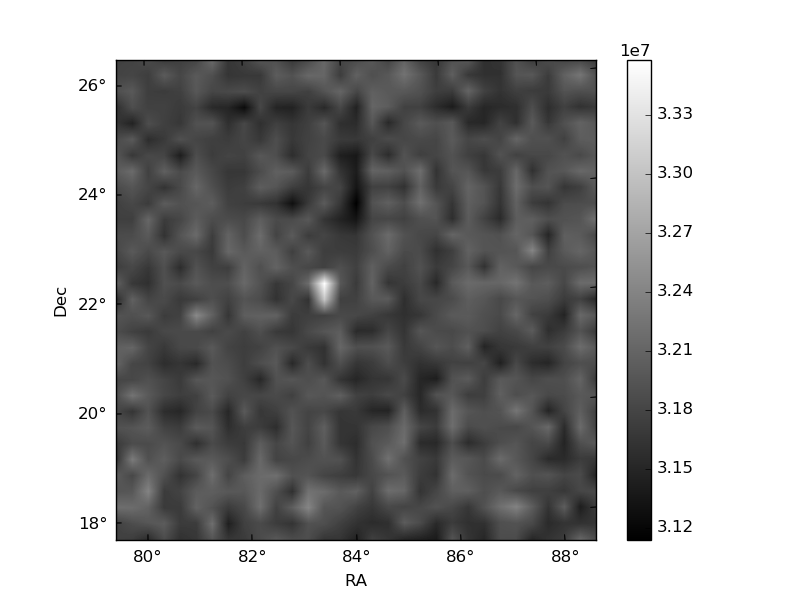
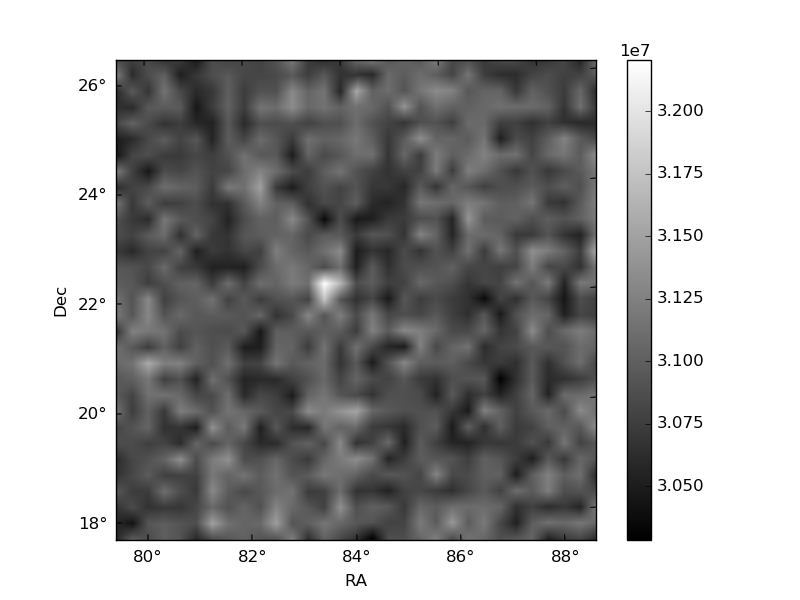
Histogram calculated using DETX and DETY for each event in the final _common_clean file
| Quadrant A | 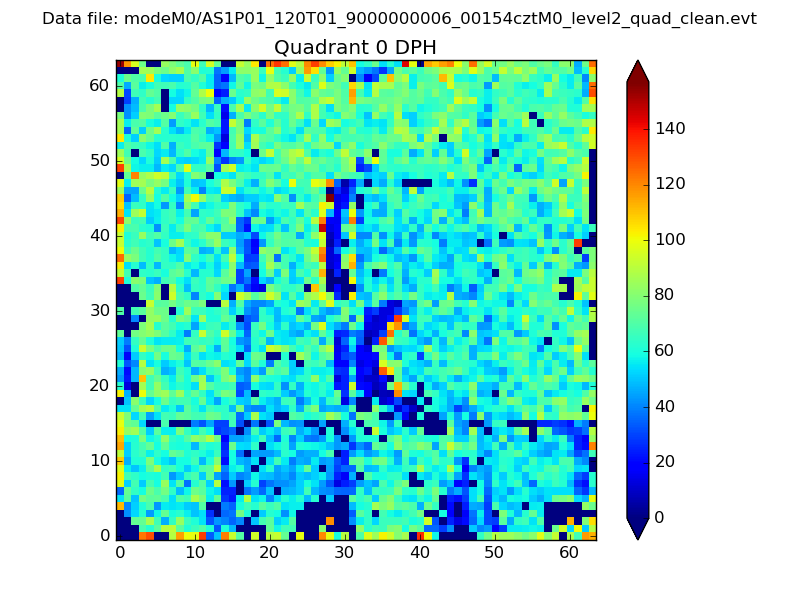 |
 |
Quadrant B |
|---|---|---|---|
| Quadrant D |  |
 |
Quadrant C |
| Plot type | Count rate plots | Images |
|---|---|---|
| Comparison with Poisson distribution Blue bars denote a histogram of data divided into 1 sec bins. Red curve is a Poisson curve with rate = median count rate of data. |
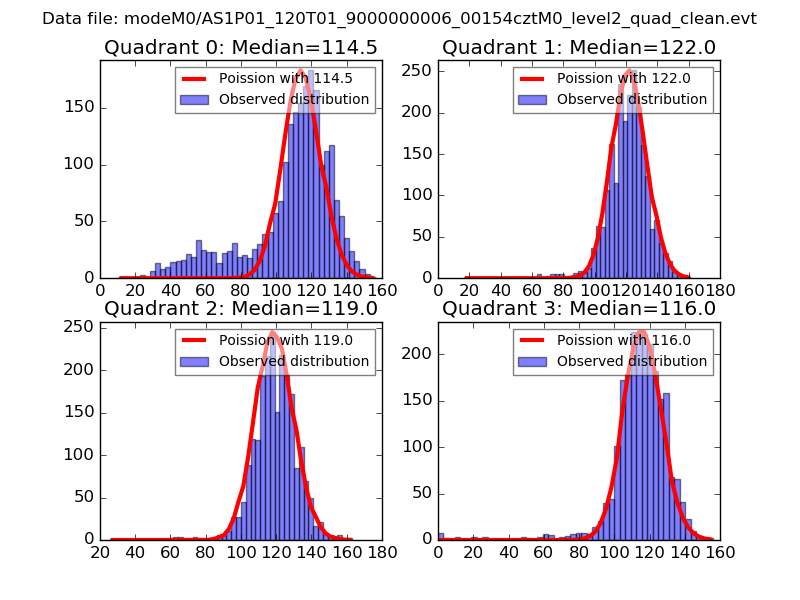 |
 |
| Quadrant-wise count rates Data is divided into 100 sec bins |
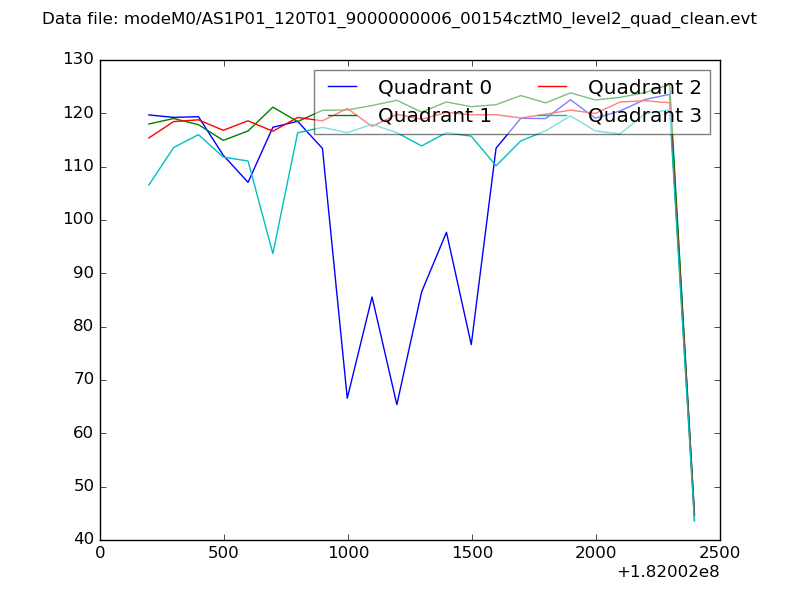 |
|
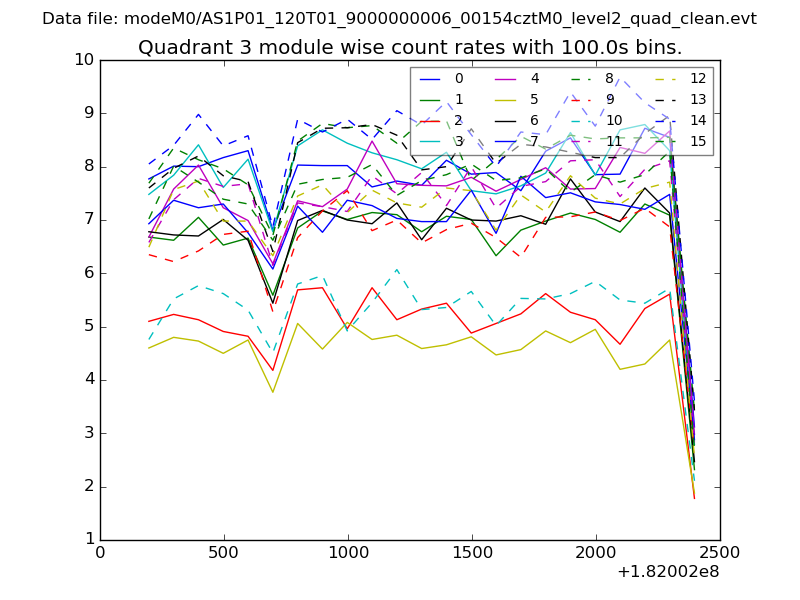
| Module-wise count rates for Quadrant A Data is divided into 100 sec bins |
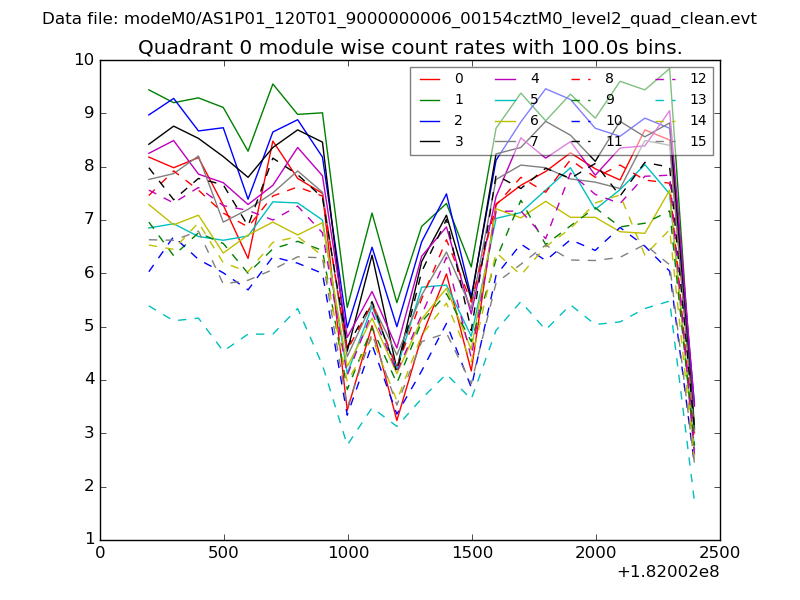 |
 |
| Module-wise count rates for Quadrant B Data is divided into 100 sec bins |
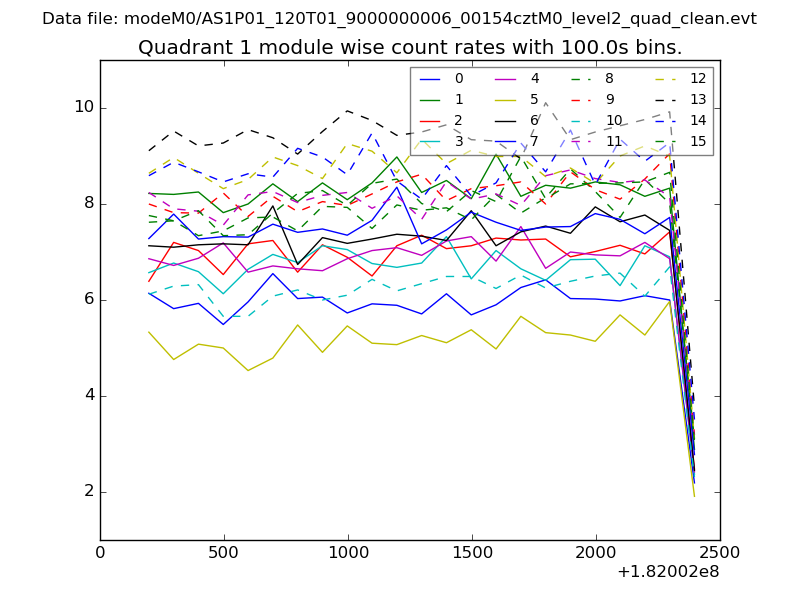 |
 |
| Module-wise count rates for Quadrant C Data is divided into 100 sec bins |
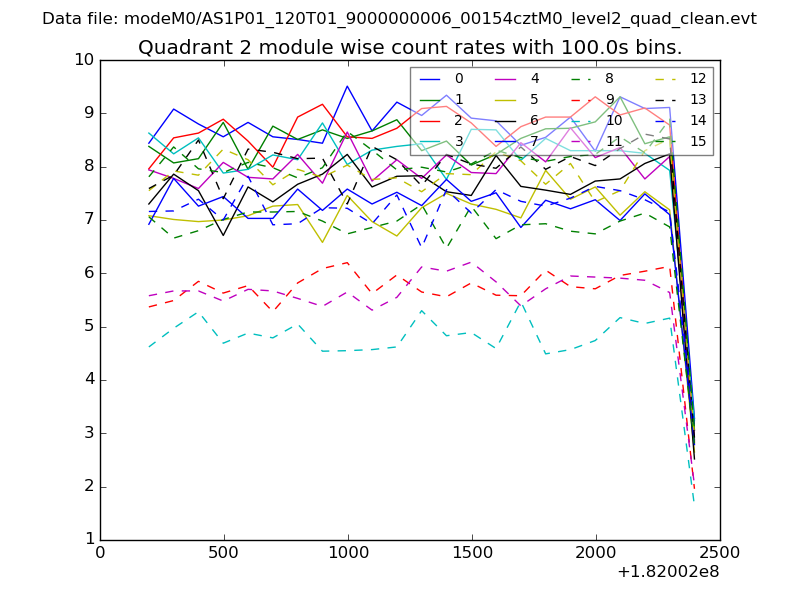 |
 |
| Module-wise count rates for Quadrant D Data is divided into 100 sec bins |
 |
 |
| Parameter | Plot |
|---|---|
| CZT HV Monitor |  |
| D_VDD | 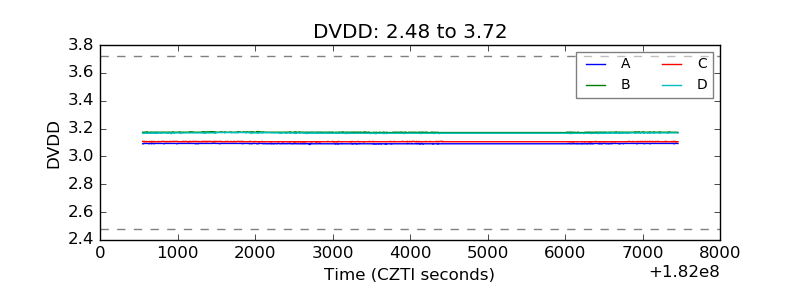 |
| Temperature 1 | 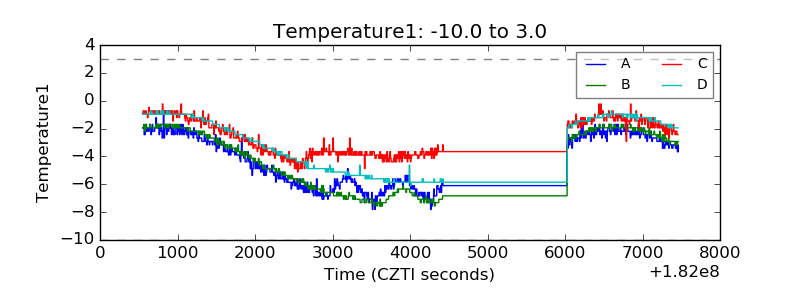 |
| Veto HV Monitor | 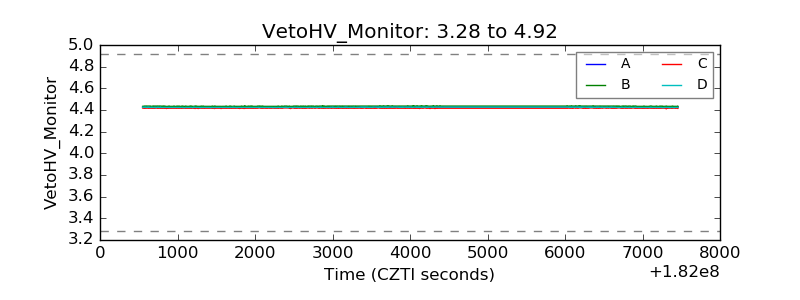 |
| Veto LLD | 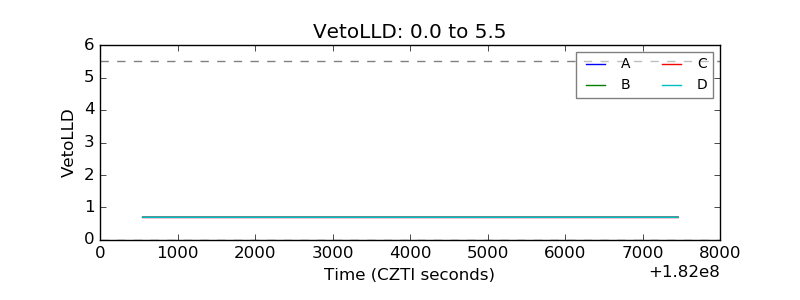 |
| Alpha Counter | 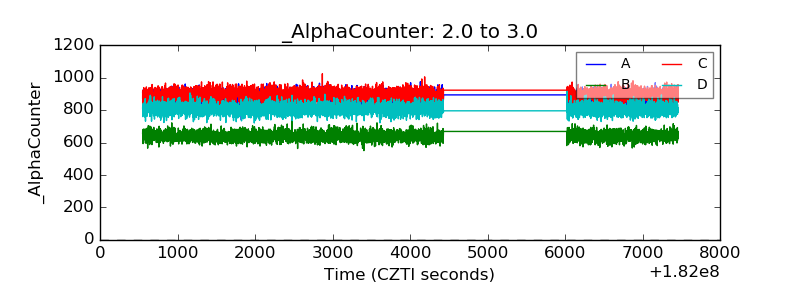 |
| _CPM_Rate | 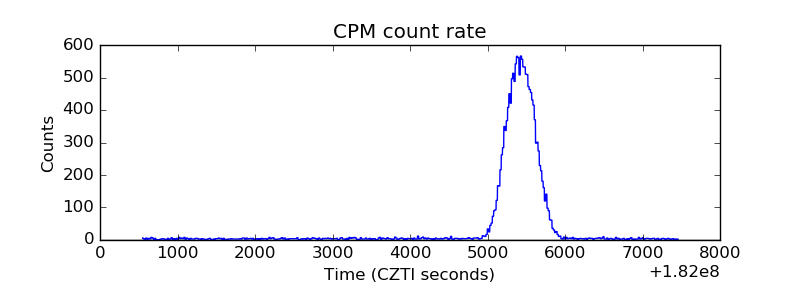 |
| CZT Counter | 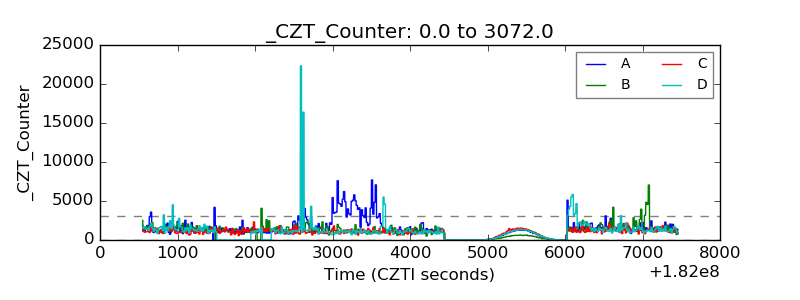 |
| +2.5 Volts monitor |  |
| +5 Volts monitor |  |
| _ROLL_ROT | 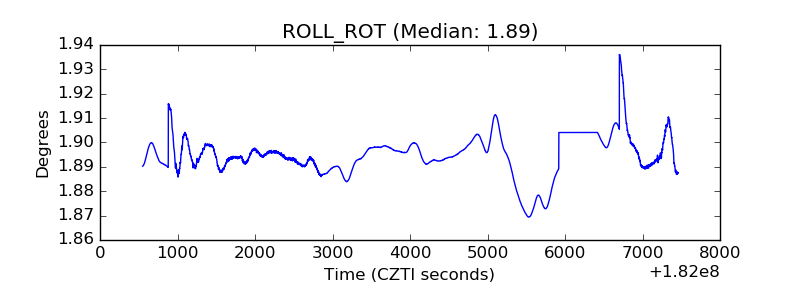 |
| _Roll_DEC | 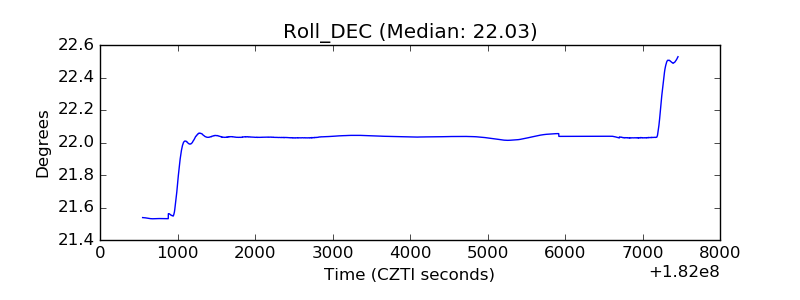 |
| _Roll_RA | 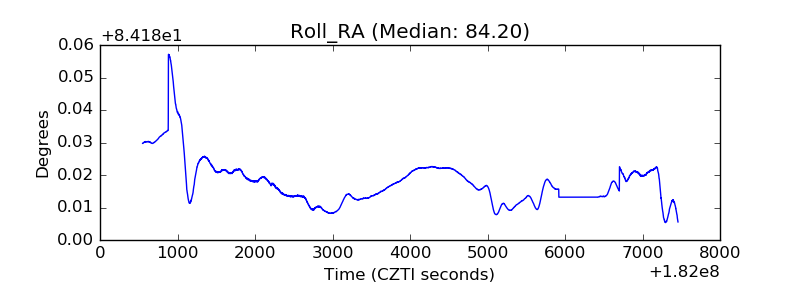 |
| Veto Counter | 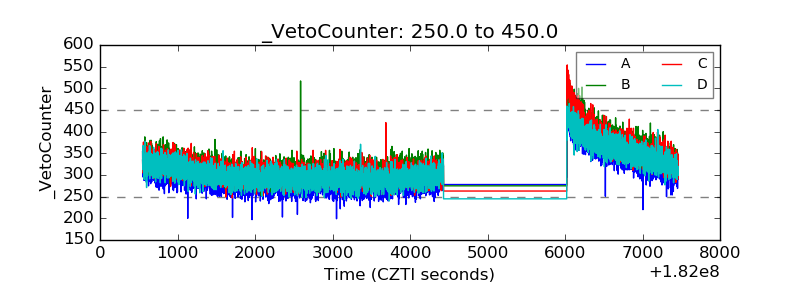 |