| Param | Original file | Final file |
|---|---|---|
| Filename | modeM0/AS1P01_120T01_9000000006_00155cztM0_level2.evt | modeM0/AS1P01_120T01_9000000006_00155cztM0_level2_quad_clean.evt |
| Size (bytes) | 921,208,320 | 54,927,360 |
| Size | 878.5 MB | 52.4 MB |
| Events in quadrant A | 7,090,588 | 319,471 |
| Events in quadrant B | 7,365,412 | 322,914 |
| Events in quadrant C | 6,540,357 | 319,341 |
| Events in quadrant D | 6,534,356 | 312,678 |
| Mode SS | |||
|---|---|---|---|
| Quadrant | BADHDUFLAG | Total packets | Discarded packets |
| A | 0 | 114 | 0 |
| B | 0 | 114 | 0 |
| C | 0 | 114 | 0 |
| D | 0 | 114 | 0 |
| Mode M9 | |||
|---|---|---|---|
| Quadrant | BADHDUFLAG | Total packets | Discarded packets |
| A | 0 | 16 | 0 |
| B | 0 | 16 | 0 |
| C | 0 | 16 | 0 |
| D | 0 | 16 | 0 |
| Mode M0 | |||
|---|---|---|---|
| Quadrant | BADHDUFLAG | Total packets | Discarded packets |
| A | 0 | 24989 | 2 |
| B | 0 | 25798 | 1 |
| C | 0 | 23366 | 1 |
| D | 0 | 23364 | 1 |
| Quadrant | Total seconds | Saturated seconds | Saturation percentage |
|---|---|---|---|
| A | 5547 | 20 | 0.360555% |
| B | 5547 | 92 | 1.658554% |
| C | 5547 | 1 | 0.018028% |
| D | 5547 | 18 | 0.324500% |
Noise dominated data is calculated using 1-second bins in cleaned event files. If a bin has >2000 counts, and if more than 50% of those come from <1% of pixels, then it is considered to be noise-dominated and hence unusable.
| Quadrant | # 1 sec bins | Bins with >0 counts | Bins with >2000 counts | High rate bins dominated by noise | Noise dominated (total time) | Noise dominated (detector-on time) | Marked lightcurve |
|---|---|---|---|---|---|---|---|
| A | 7139 | 5549 | 279 | 279 | 3.91% | 5.03% | 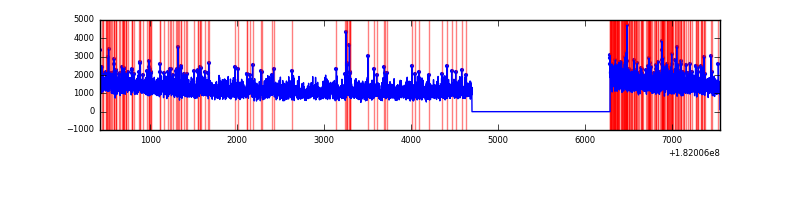 |
| B | 7139 | 5549 | 355 | 355 | 4.97% | 6.40% | 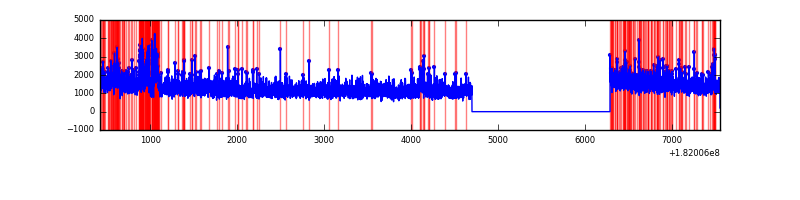 |
| C | 7139 | 5549 | 74 | 74 | 1.04% | 1.33% | 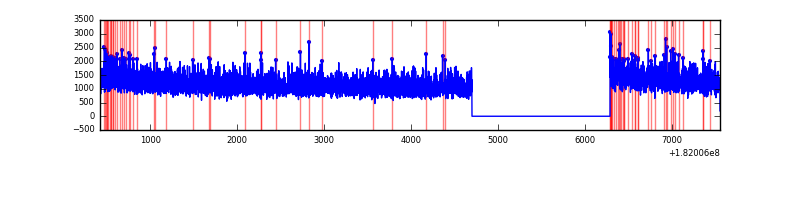 |
| D | 7139 | 5549 | 130 | 130 | 1.82% | 2.34% | 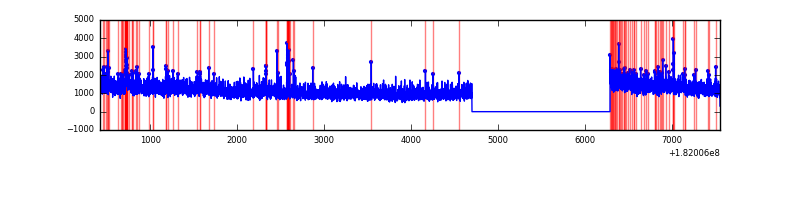 |
Top three noisy pixels from each quadrant. If the there are fewer than three noisy pixels in the level2.evt file, extra rows are filled as -1
| Pixel properties | Quadrant properties | ||||||
|---|---|---|---|---|---|---|---|
| Quadrant | DetID | PixID | Counts | Sigma | Mean | Median | Sigma |
| A | 14 | 10 | 80311 | 201.69 | 1773 | 1757 | 389.5 |
| A | 14 | 201 | 61810 | 154.19 | 1773 | 1757 | 389.5 |
| A | 0 | 96 | 25475 | 60.9 | 1773 | 1757 | 389.5 |
| B | 10 | 199 | 448862 | 1083.89 | 1763 | 1776 | 412.5 |
| B | 5 | 216 | 65879 | 155.41 | 1763 | 1776 | 412.5 |
| B | 14 | 50 | 36824 | 84.97 | 1763 | 1776 | 412.5 |
| C | 0 | 218 | 31950 | 66.27 | 1630 | 1693 | 456.6 |
| C | 10 | 33 | 25302 | 51.71 | 1630 | 1693 | 456.6 |
| C | 10 | 21 | 20659 | 41.54 | 1630 | 1693 | 456.6 |
| D | 13 | 255 | 43635 | 85.85 | 1616 | 1674 | 488.7 |
| D | 10 | 101 | 40624 | 79.69 | 1616 | 1674 | 488.7 |
| D | 2 | 63 | 38920 | 76.21 | 1616 | 1674 | 488.7 |
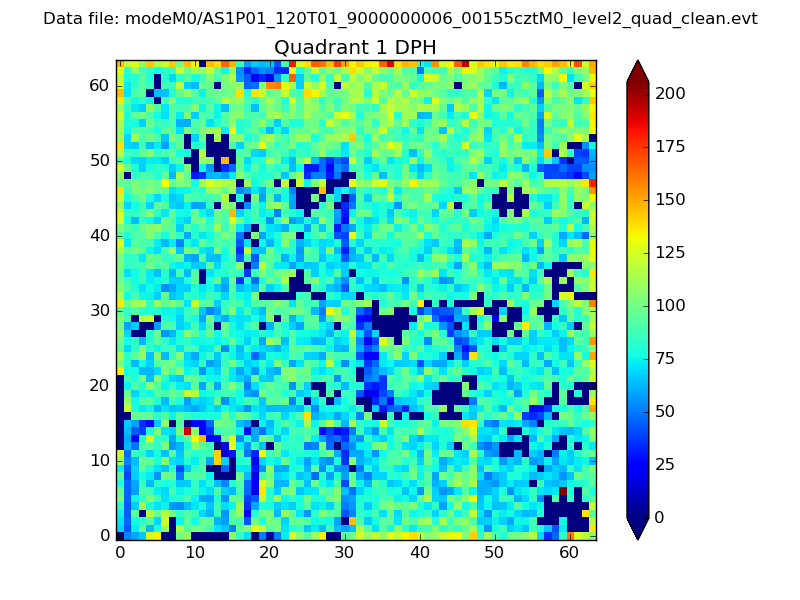
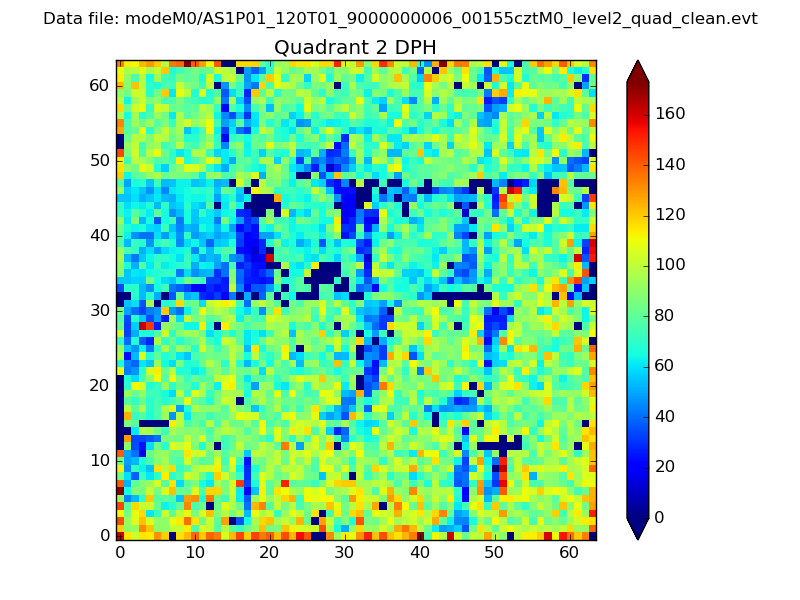
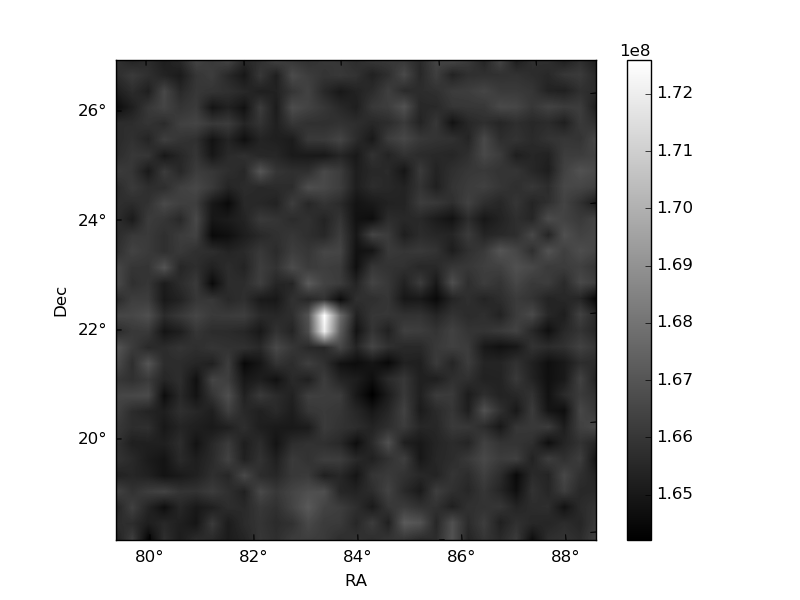
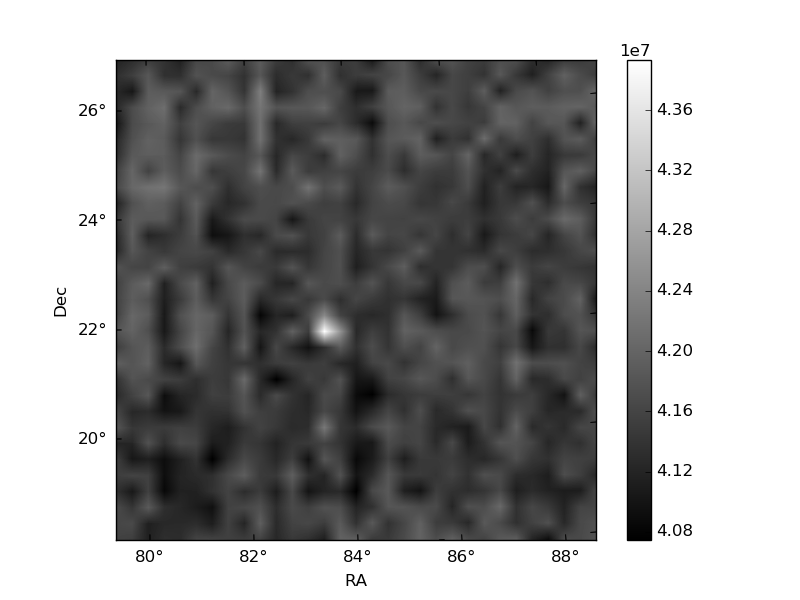
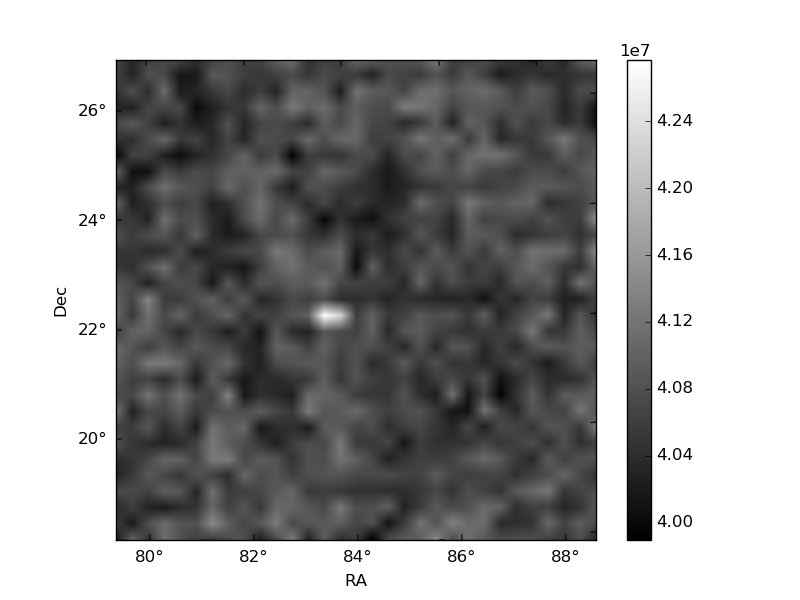
Histogram calculated using DETX and DETY for each event in the final _common_clean file
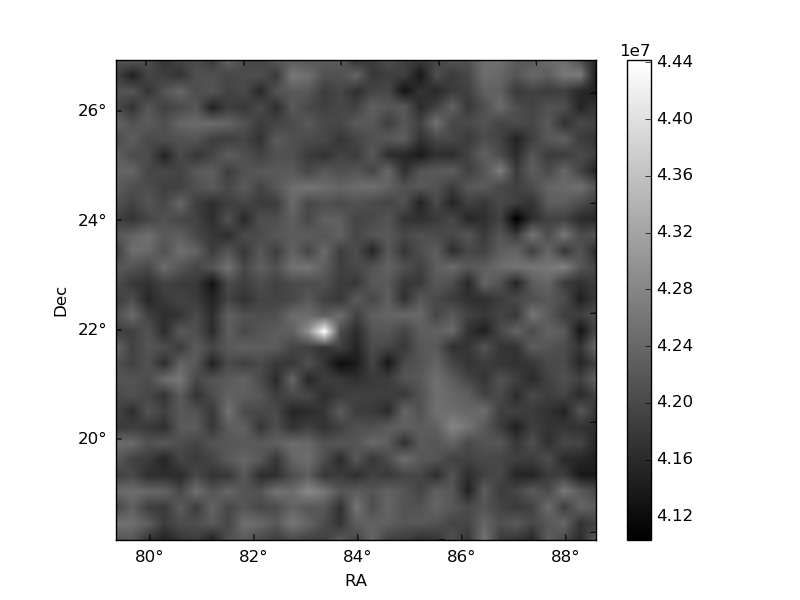
| Quadrant A |  |
 |
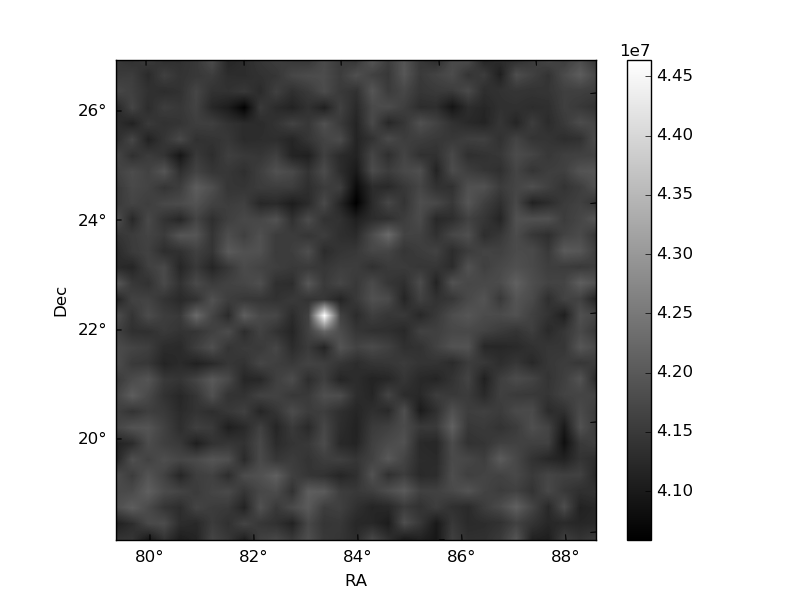
Quadrant B |
|---|---|---|---|
| Quadrant D | 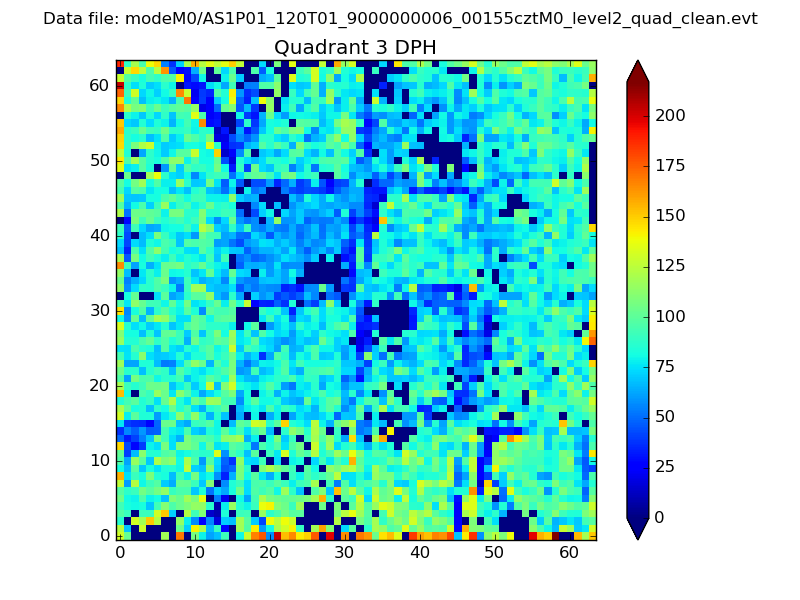 |
 |
Quadrant C |
| Plot type | Count rate plots | Images |
|---|---|---|
| Comparison with Poisson distribution Blue bars denote a histogram of data divided into 1 sec bins. Red curve is a Poisson curve with rate = median count rate of data. |
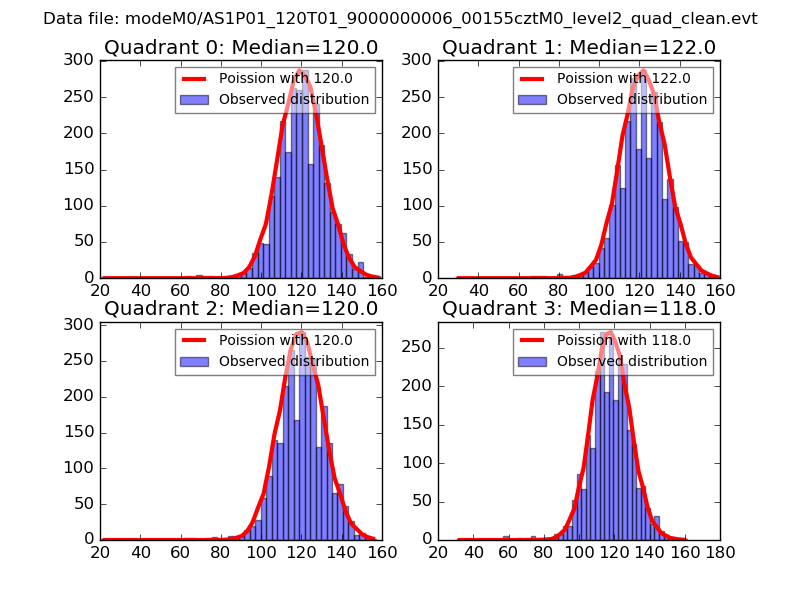 |
 |
| Quadrant-wise count rates Data is divided into 100 sec bins |
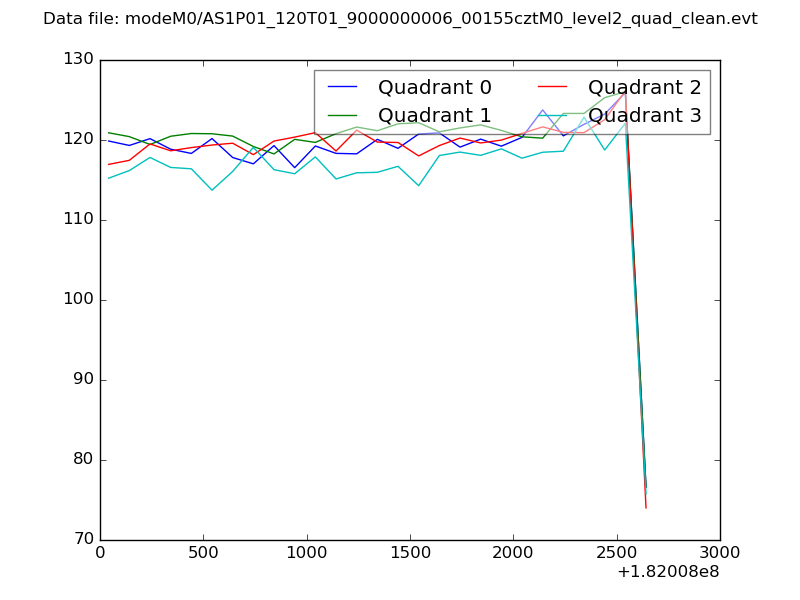 |
|
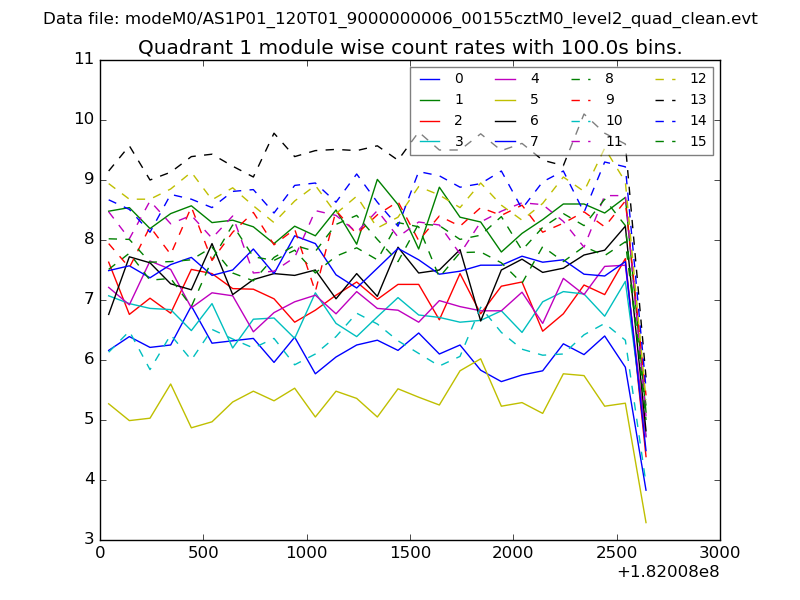
| Module-wise count rates for Quadrant A Data is divided into 100 sec bins |
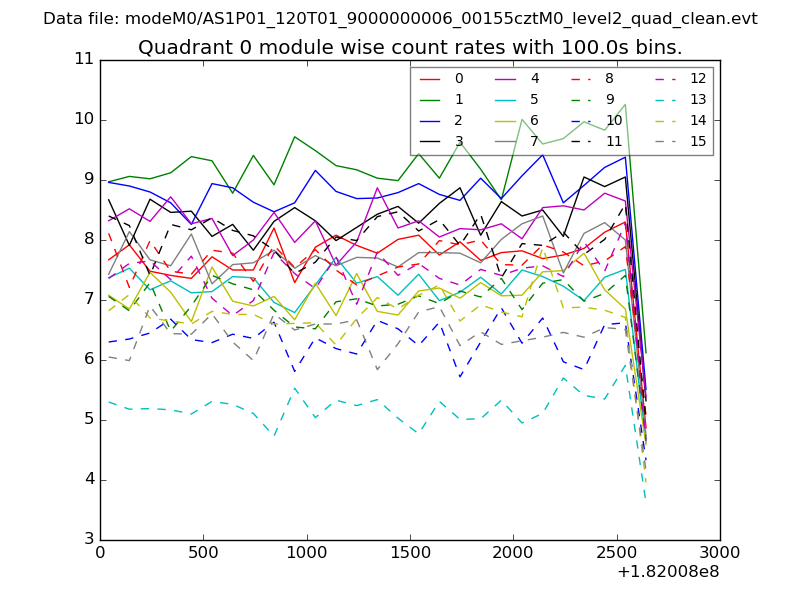 |
 |
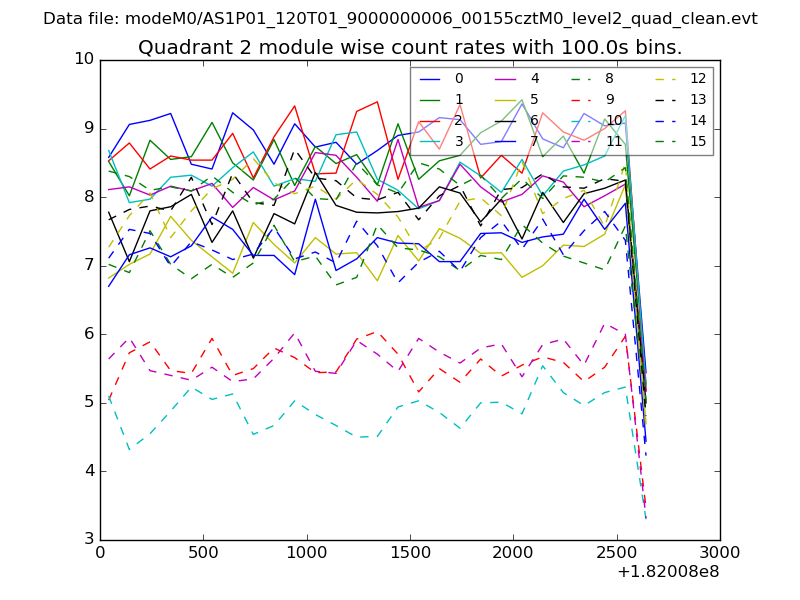
| Module-wise count rates for Quadrant B Data is divided into 100 sec bins |
 |
 |
| Module-wise count rates for Quadrant C Data is divided into 100 sec bins |
 |
 |
| Module-wise count rates for Quadrant D Data is divided into 100 sec bins |
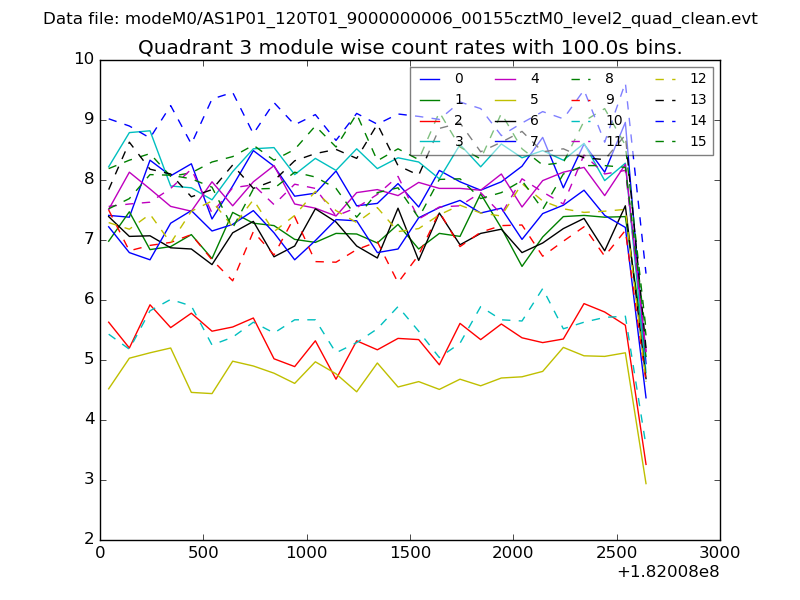 |
 |
| Parameter | Plot |
|---|---|
| CZT HV Monitor | 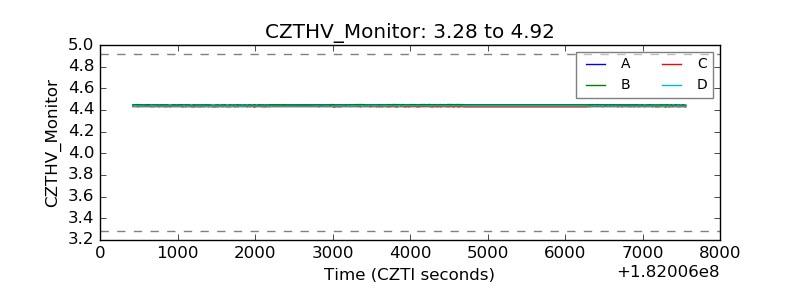 |
| D_VDD | 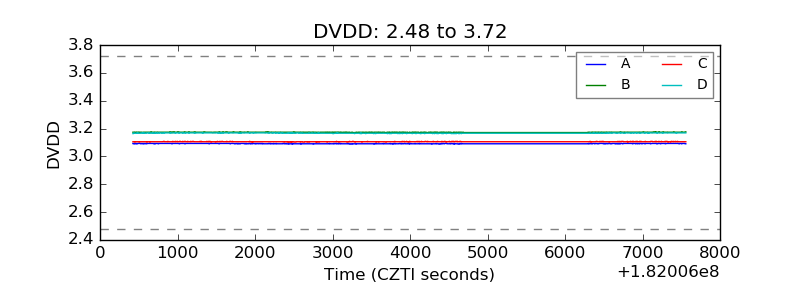 |
| Temperature 1 | 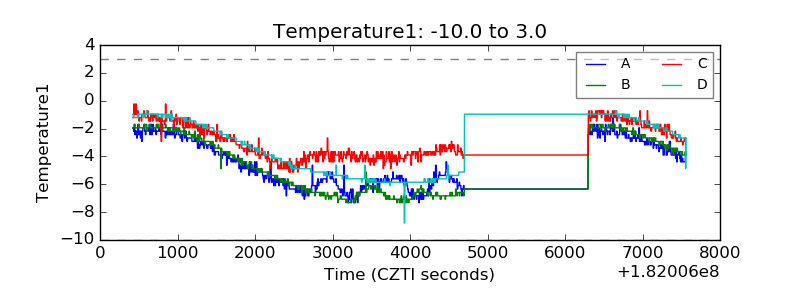 |
| Veto HV Monitor | 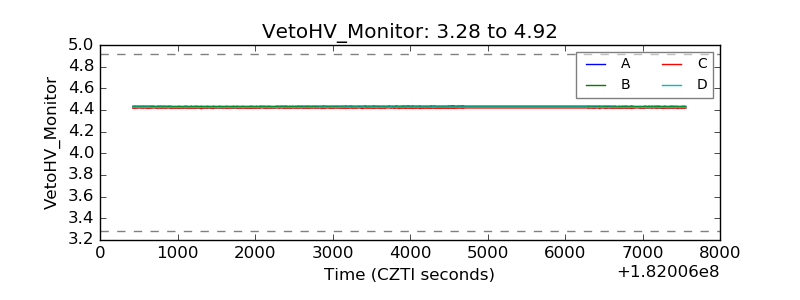 |
| Veto LLD | 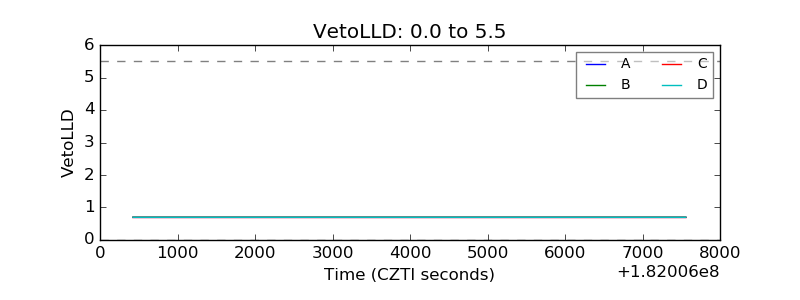 |
| Alpha Counter | 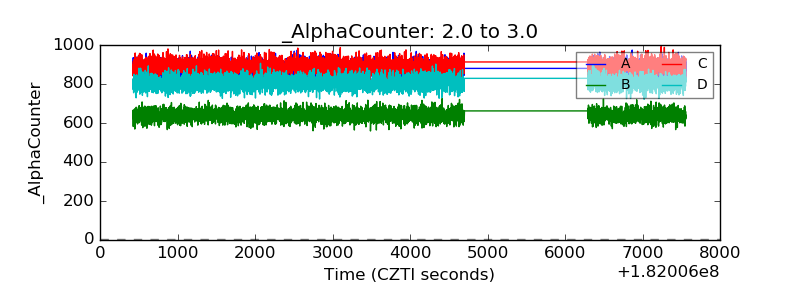 |
| _CPM_Rate | 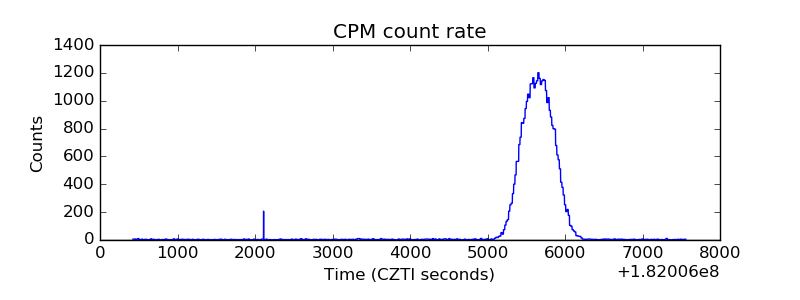 |
| CZT Counter |  |
| +2.5 Volts monitor |  |
| +5 Volts monitor |  |
| _ROLL_ROT | 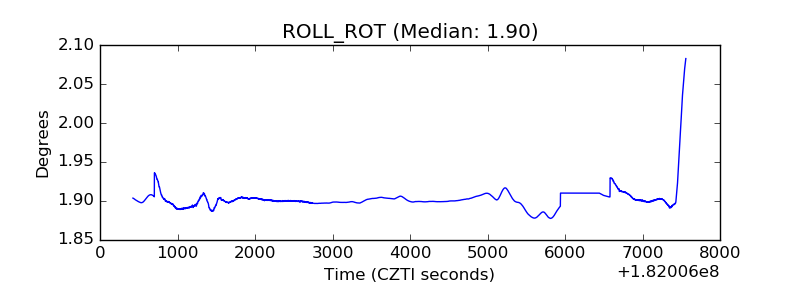 |
| _Roll_DEC | 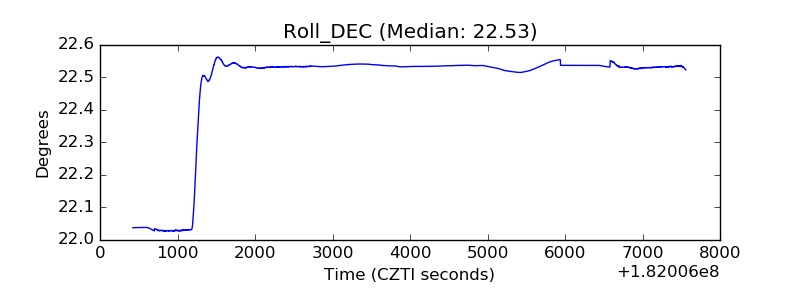 |
| _Roll_RA |  |
| Veto Counter | 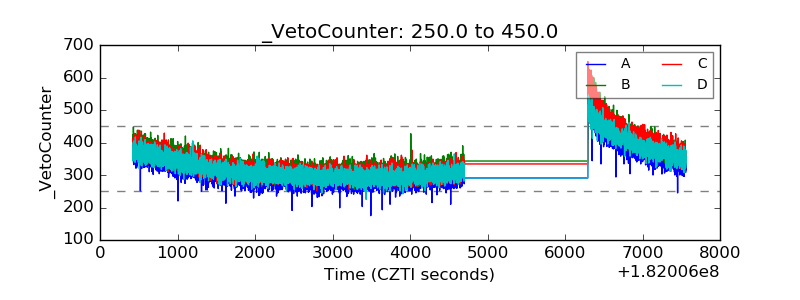 |