| Param | Original file | Final file |
|---|---|---|
| Filename | modeM0/AS1P01_120T01_9000000006_00157cztM0_level2.evt | modeM0/AS1P01_120T01_9000000006_00157cztM0_level2_quad_clean.evt |
| Size (bytes) | 991,031,040 | 63,846,720 |
| Size | 945.1 MB | 60.9 MB |
| Events in quadrant A | 7,457,713 | 386,678 |
| Events in quadrant B | 7,456,012 | 392,805 |
| Events in quadrant C | 6,735,525 | 391,061 |
| Events in quadrant D | 7,985,554 | 362,586 |
| Mode SS | |||
|---|---|---|---|
| Quadrant | BADHDUFLAG | Total packets | Discarded packets |
| A | 0 | 116 | 0 |
| B | 0 | 116 | 0 |
| C | 0 | 116 | 0 |
| D | 0 | 116 | 0 |
| Mode M9 | |||
|---|---|---|---|
| Quadrant | BADHDUFLAG | Total packets | Discarded packets |
| A | 0 | 16 | 0 |
| B | 0 | 16 | 0 |
| C | 0 | 16 | 0 |
| D | 0 | 16 | 0 |
| Mode M0 | |||
|---|---|---|---|
| Quadrant | BADHDUFLAG | Total packets | Discarded packets |
| A | 0 | 26187 | 2 |
| B | 0 | 26185 | 1 |
| C | 0 | 24029 | 1 |
| D | 0 | 27822 | 1 |
| Quadrant | Total seconds | Saturated seconds | Saturation percentage |
|---|---|---|---|
| A | 5721 | 32 | 0.559343% |
| B | 5721 | 31 | 0.541863% |
| C | 5721 | 4 | 0.069918% |
| D | 5721 | 270 | 4.719455% |
Noise dominated data is calculated using 1-second bins in cleaned event files. If a bin has >2000 counts, and if more than 50% of those come from <1% of pixels, then it is considered to be noise-dominated and hence unusable.
| Quadrant | # 1 sec bins | Bins with >0 counts | Bins with >2000 counts | High rate bins dominated by noise | Noise dominated (total time) | Noise dominated (detector-on time) | Marked lightcurve |
|---|---|---|---|---|---|---|---|
| A | 7314 | 5723 | 380 | 380 | 5.20% | 6.64% | 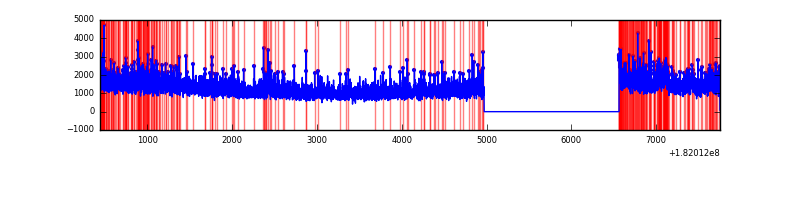 |
| B | 7314 | 5723 | 257 | 257 | 3.51% | 4.49% | 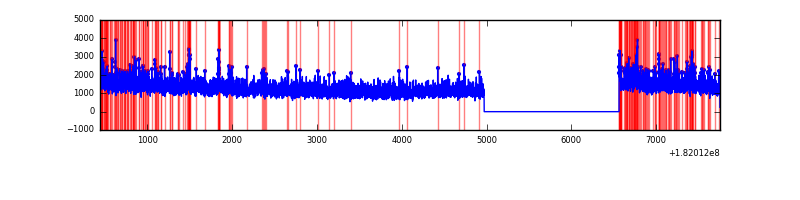 |
| C | 7314 | 5723 | 98 | 98 | 1.34% | 1.71% | 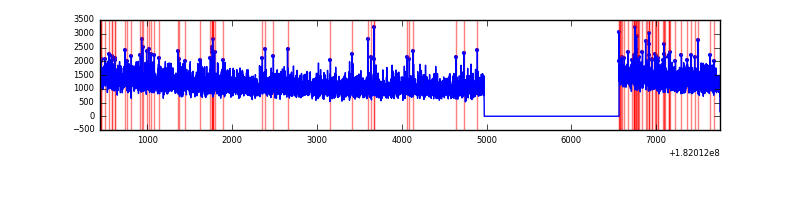 |
| D | 7314 | 5723 | 659 | 659 | 9.01% | 11.51% | 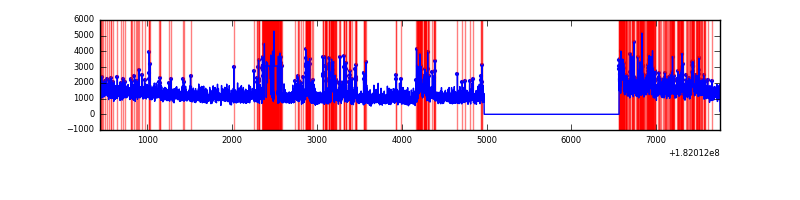 |
Top three noisy pixels from each quadrant. If the there are fewer than three noisy pixels in the level2.evt file, extra rows are filled as -1
| Pixel properties | Quadrant properties | ||||||
|---|---|---|---|---|---|---|---|
| Quadrant | DetID | PixID | Counts | Sigma | Mean | Median | Sigma |
| A | 14 | 201 | 82951 | 201.9 | 1833 | 1819 | 401.8 |
| A | 0 | 96 | 76382 | 185.55 | 1833 | 1819 | 401.8 |
| A | 0 | 166 | 55122 | 132.64 | 1833 | 1819 | 401.8 |
| B | 10 | 199 | 194263 | 449.91 | 1837 | 1849 | 427.7 |
| B | 14 | 50 | 73838 | 168.33 | 1837 | 1849 | 427.7 |
| B | 5 | 216 | 42714 | 95.55 | 1837 | 1849 | 427.7 |
| C | 0 | 188 | 34726 | 69.72 | 1689 | 1750 | 473.0 |
| C | 10 | 17 | 17433 | 33.16 | 1689 | 1750 | 473.0 |
| C | 7 | 205 | 16791 | 31.8 | 1689 | 1750 | 473.0 |
| D | 10 | 202 | 828324 | 1671.16 | 1639 | 1696 | 494.6 |
| D | 14 | 53 | 529473 | 1066.98 | 1639 | 1696 | 494.6 |
| D | 13 | 21 | 69138 | 136.34 | 1639 | 1696 | 494.6 |
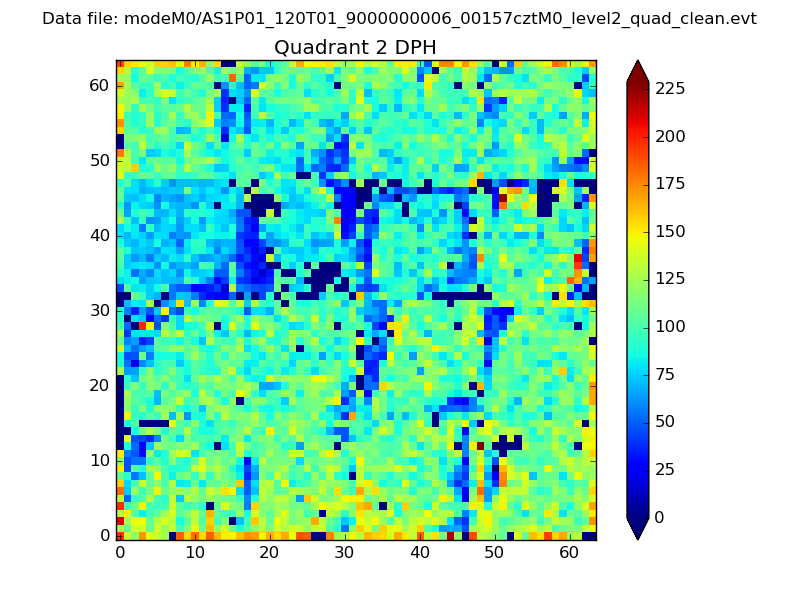
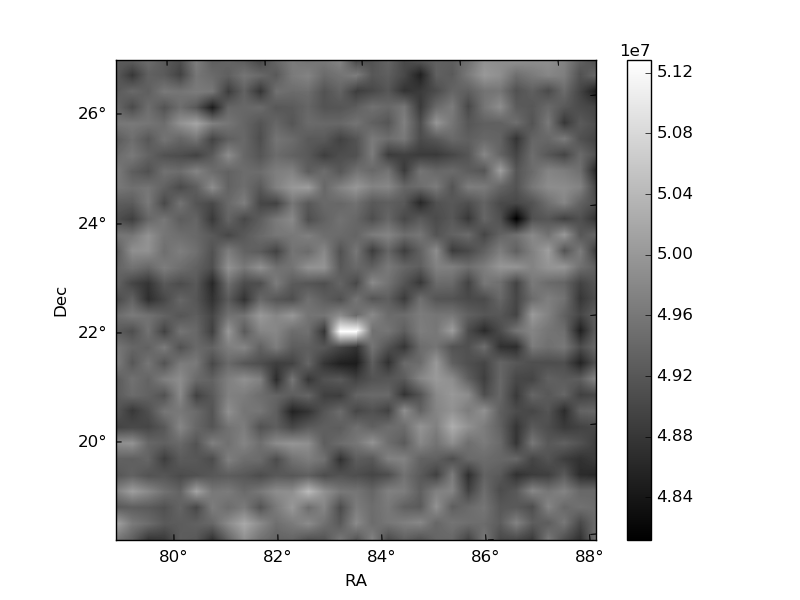
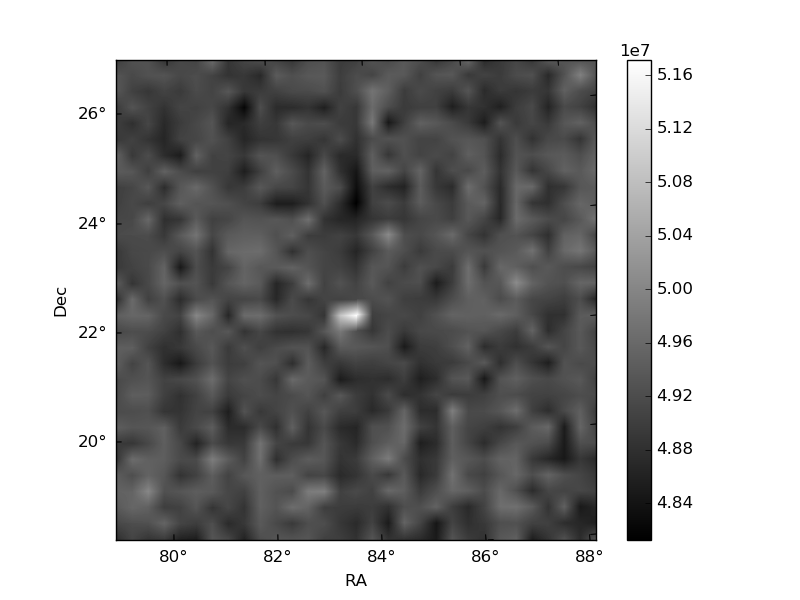
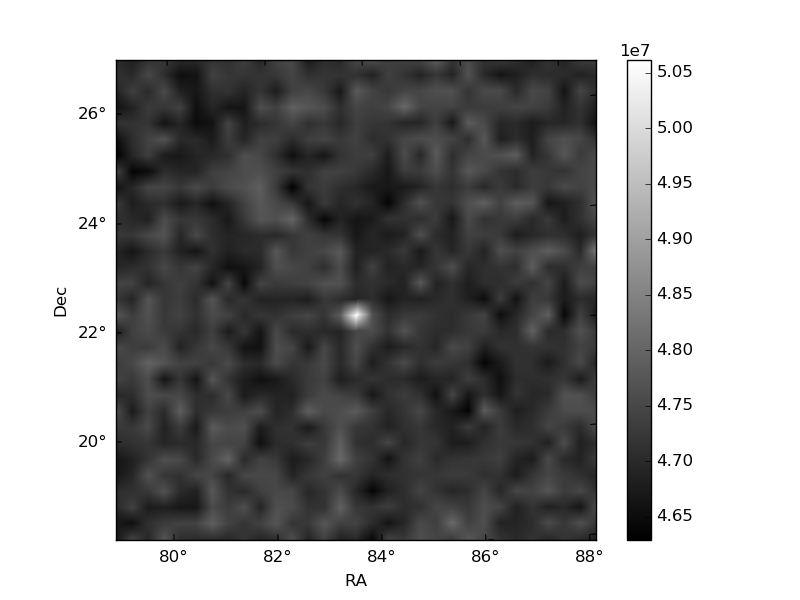
Histogram calculated using DETX and DETY for each event in the final _common_clean file
| Quadrant A | 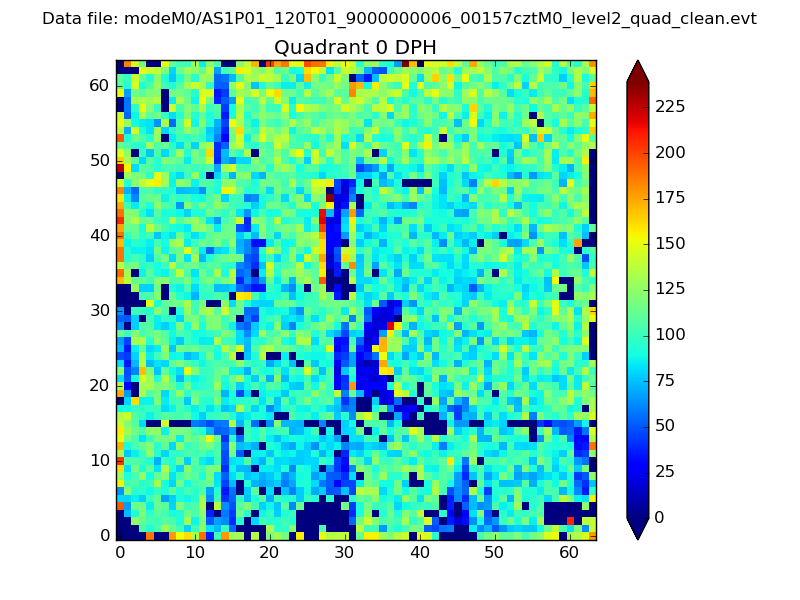 |
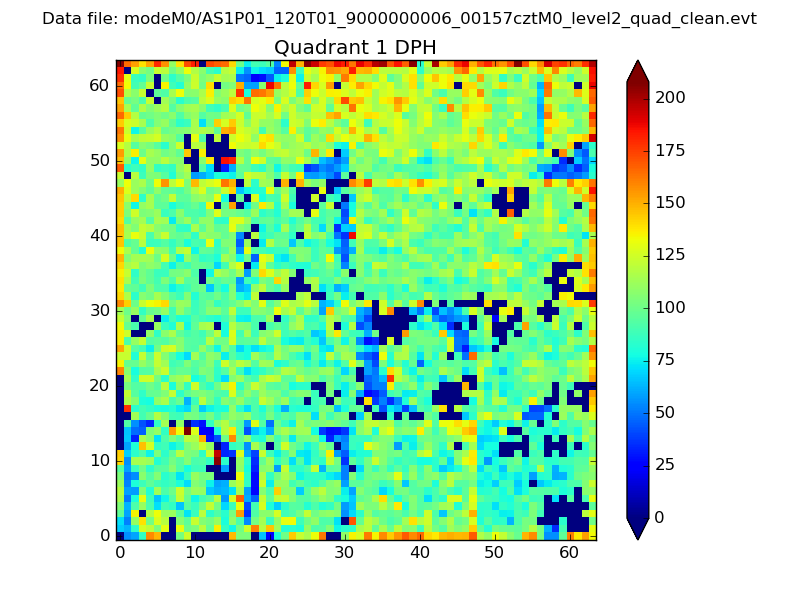 |
Quadrant B |
|---|---|---|---|
| Quadrant D | 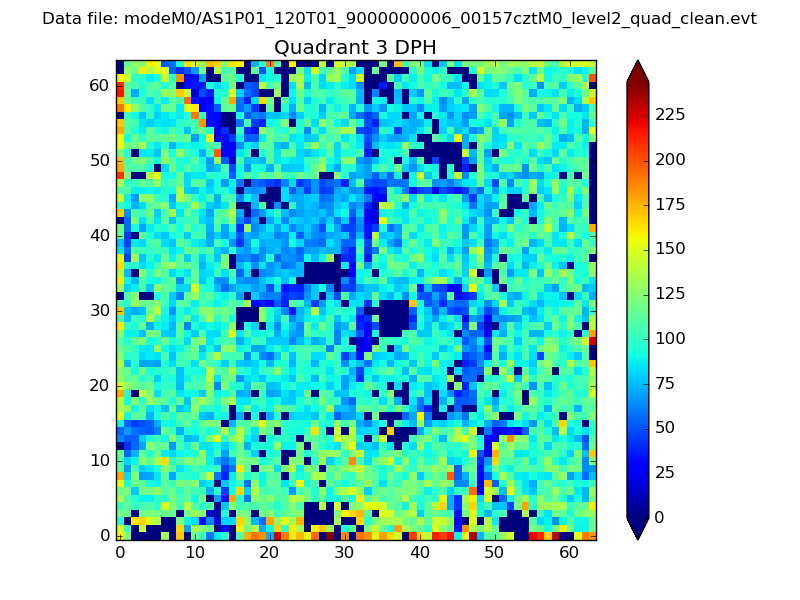 |
 |
Quadrant C |
| Plot type | Count rate plots | Images |
|---|---|---|
| Comparison with Poisson distribution Blue bars denote a histogram of data divided into 1 sec bins. Red curve is a Poisson curve with rate = median count rate of data. |
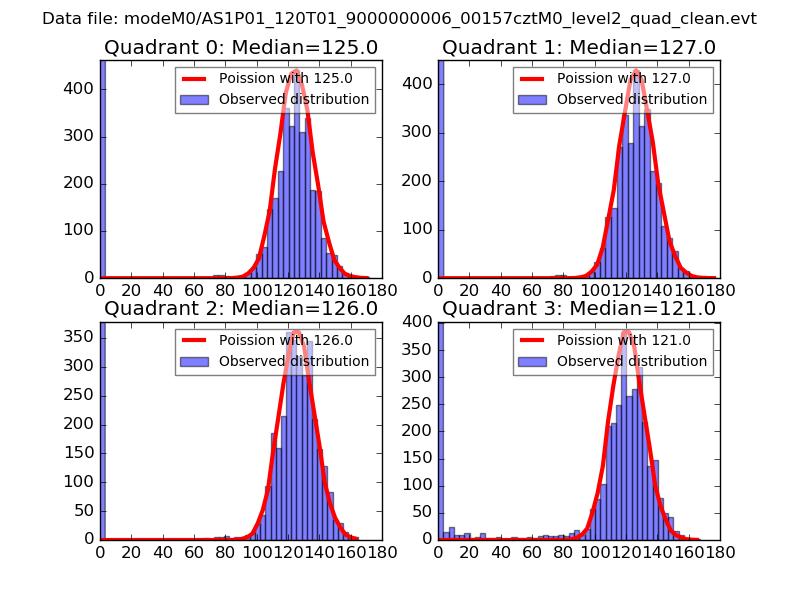 |
 |
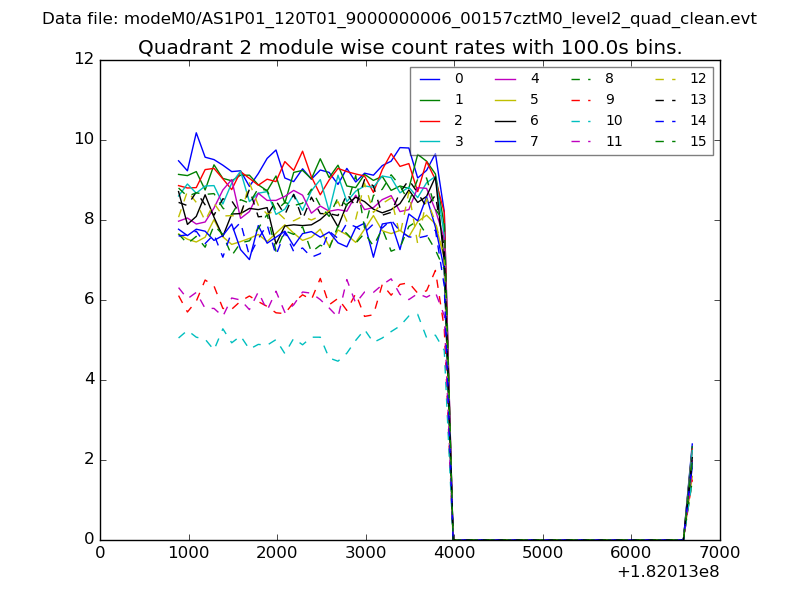
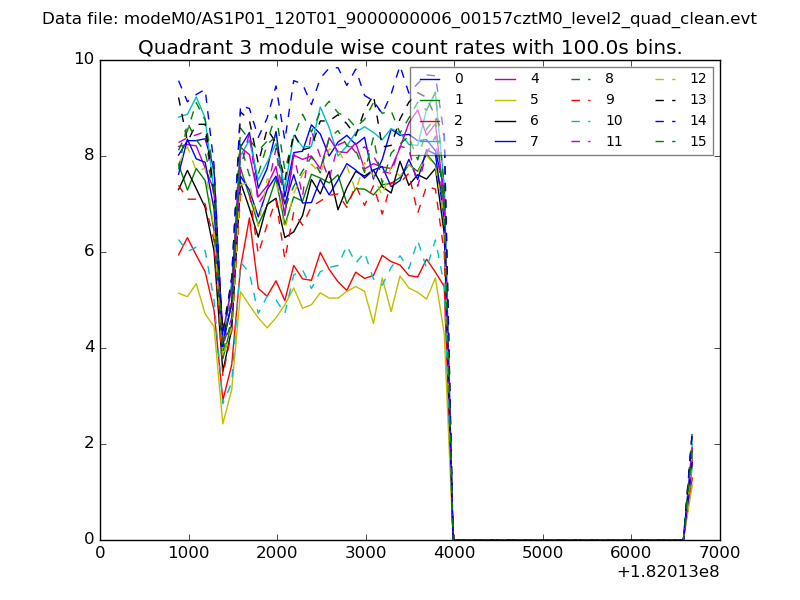
| Quadrant-wise count rates Data is divided into 100 sec bins |
 |
|
| Module-wise count rates for Quadrant A Data is divided into 100 sec bins |
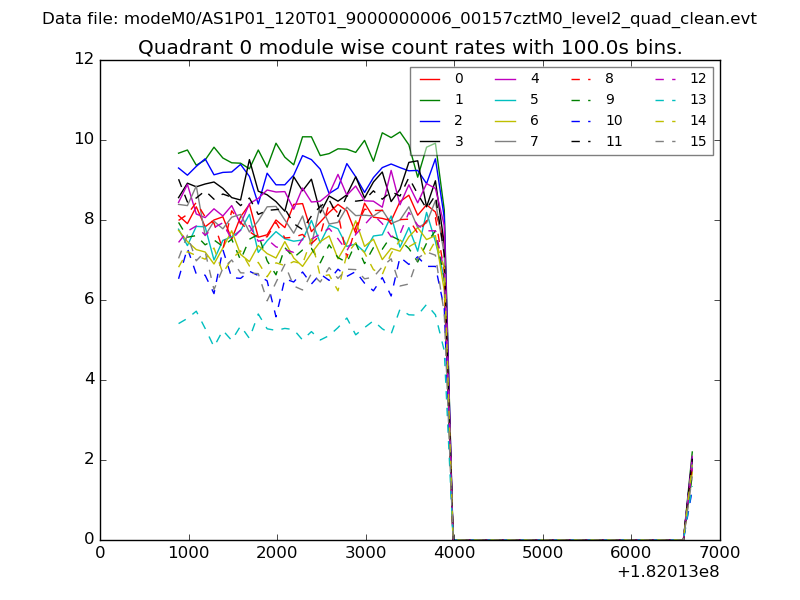 |
 |
| Module-wise count rates for Quadrant B Data is divided into 100 sec bins |
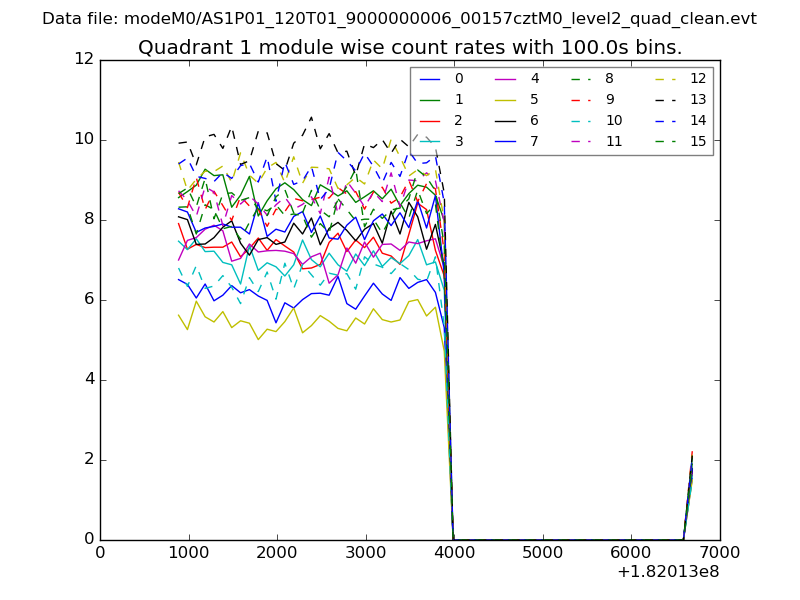 |
 |
| Module-wise count rates for Quadrant C Data is divided into 100 sec bins |
 |
 |
| Module-wise count rates for Quadrant D Data is divided into 100 sec bins |
 |
 |
| Parameter | Plot |
|---|---|
| CZT HV Monitor | 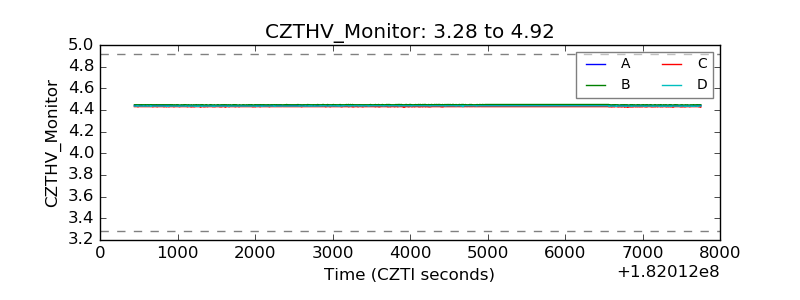 |
| D_VDD | 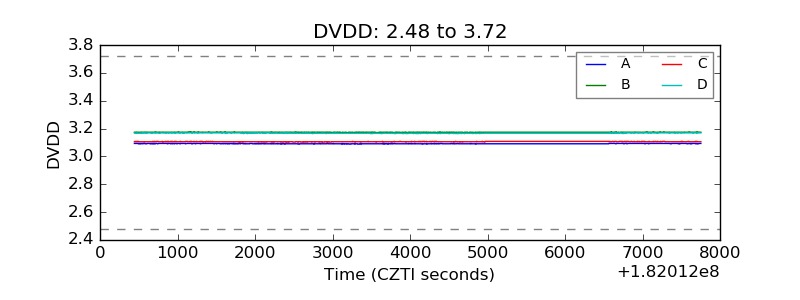 |
| Temperature 1 | 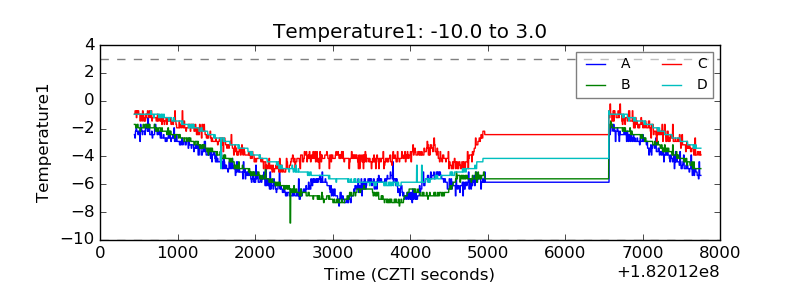 |
| Veto HV Monitor | 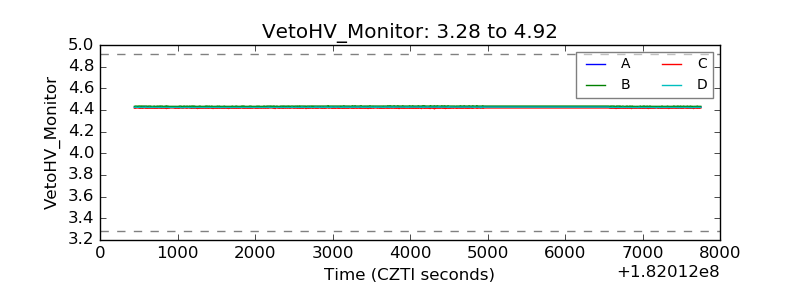 |
| Veto LLD | 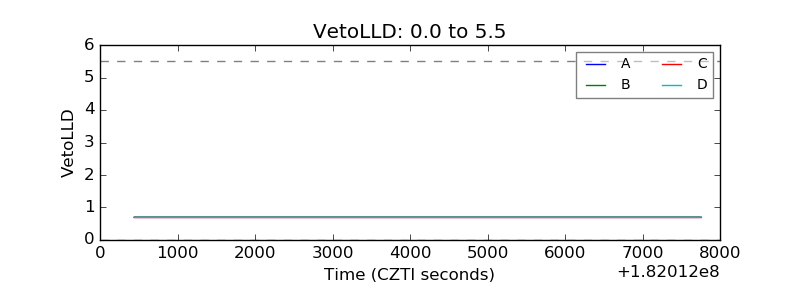 |
| Alpha Counter | 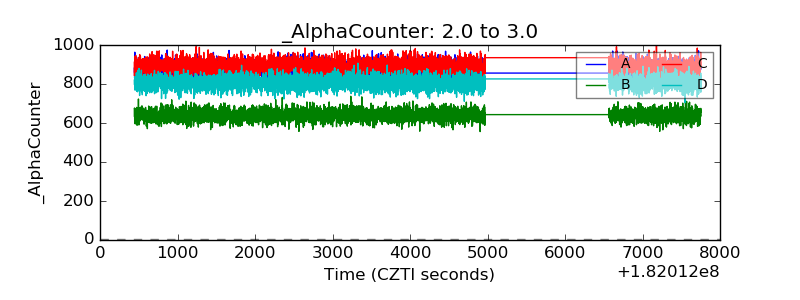 |
| _CPM_Rate | 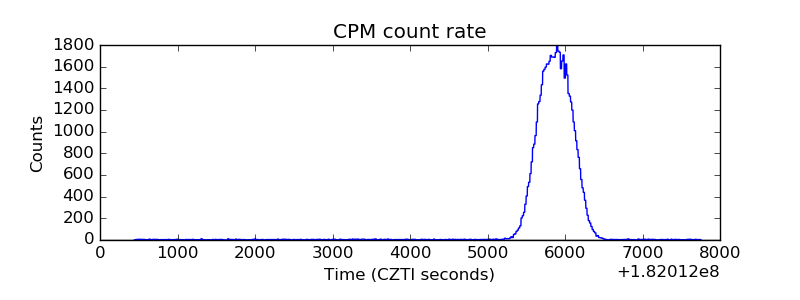 |
| CZT Counter |  |
| +2.5 Volts monitor |  |
| +5 Volts monitor |  |
| _ROLL_ROT | 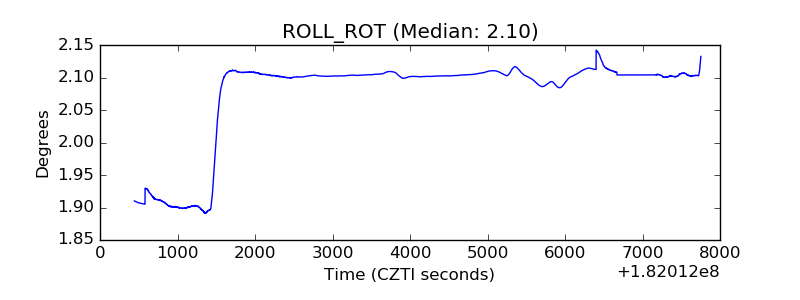 |
| _Roll_DEC | 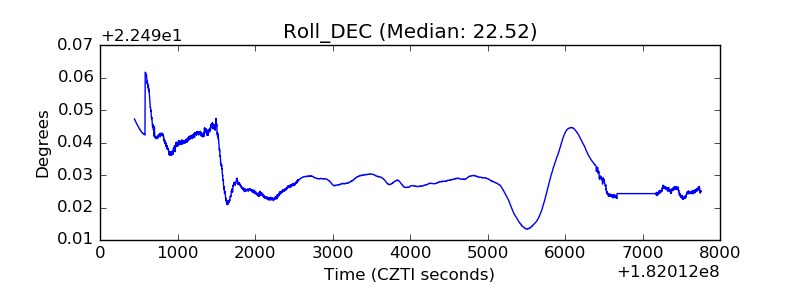 |
| _Roll_RA |  |
| Veto Counter | 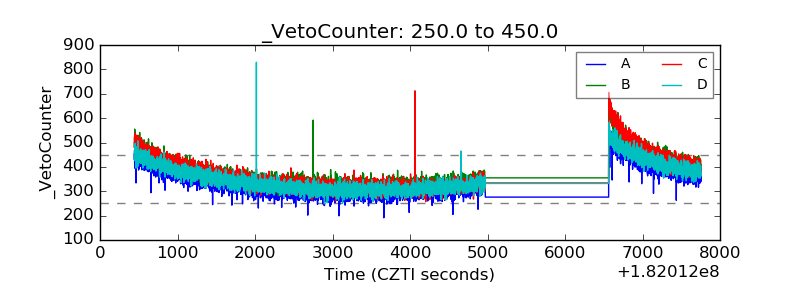 |