| Param | Original file | Final file |
|---|---|---|
| Filename | modeM0/AS1P01_120T01_9000000006_00158cztM0_level2.evt | modeM0/AS1P01_120T01_9000000006_00158cztM0_level2_quad_clean.evt |
| Size (bytes) | 860,152,320 | 79,600,320 |
| Size | 820.3 MB | 75.9 MB |
| Events in quadrant A | 6,417,321 | 505,960 |
| Events in quadrant B | 6,575,063 | 523,100 |
| Events in quadrant C | 6,052,466 | 517,264 |
| Events in quadrant D | 6,656,370 | 496,422 |
| Mode SS | |||
|---|---|---|---|
| Quadrant | BADHDUFLAG | Total packets | Discarded packets |
| A | 0 | 106 | 0 |
| B | 0 | 106 | 0 |
| C | 0 | 106 | 0 |
| D | 0 | 106 | 0 |
| Mode M9 | |||
|---|---|---|---|
| Quadrant | BADHDUFLAG | Total packets | Discarded packets |
| A | 0 | 16 | 0 |
| B | 0 | 16 | 0 |
| C | 0 | 16 | 0 |
| D | 0 | 17 | 1 |
| Mode M0 | |||
|---|---|---|---|
| Quadrant | BADHDUFLAG | Total packets | Discarded packets |
| A | 0 | 22837 | 74 |
| B | 0 | 23314 | 88 |
| C | 0 | 21807 | 80 |
| D | 0 | 23655 | 130 |
| Quadrant | Total seconds | Saturated seconds | Saturation percentage |
|---|---|---|---|
| A | 5256 | 11 | 0.209285% |
| B | 5256 | 17 | 0.323440% |
| C | 5255 | 3 | 0.057088% |
| D | 5252 | 74 | 1.408987% |
Noise dominated data is calculated using 1-second bins in cleaned event files. If a bin has >2000 counts, and if more than 50% of those come from <1% of pixels, then it is considered to be noise-dominated and hence unusable.
| Quadrant | # 1 sec bins | Bins with >0 counts | Bins with >2000 counts | High rate bins dominated by noise | Noise dominated (total time) | Noise dominated (detector-on time) | Marked lightcurve |
|---|---|---|---|---|---|---|---|
| A | 6850 | 5260 | 170 | 170 | 2.48% | 3.23% | 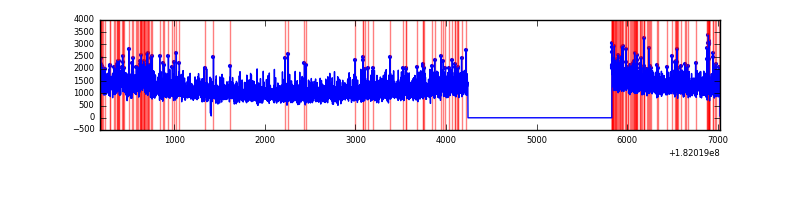 |
| B | 6850 | 5260 | 186 | 186 | 2.72% | 3.54% | 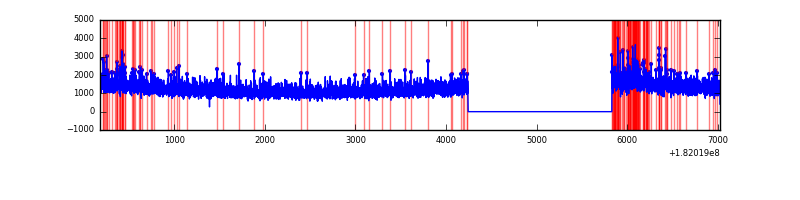 |
| C | 6851 | 5261 | 63 | 63 | 0.92% | 1.20% | 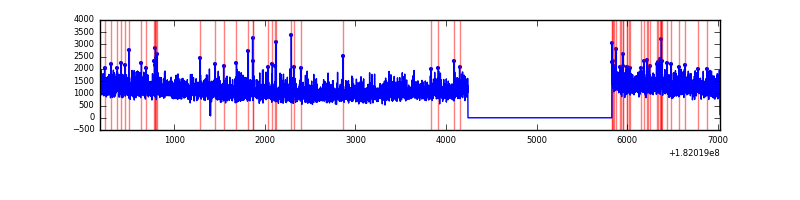 |
| D | 6849 | 5258 | 368 | 368 | 5.37% | 7.00% | 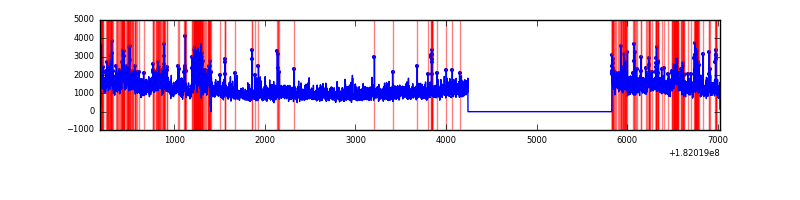 |
Top three noisy pixels from each quadrant. If the there are fewer than three noisy pixels in the level2.evt file, extra rows are filled as -1
| Pixel properties | Quadrant properties | ||||||
|---|---|---|---|---|---|---|---|
| Quadrant | DetID | PixID | Counts | Sigma | Mean | Median | Sigma |
| A | 13 | 164 | 36682 | 98.78 | 1629 | 1617 | 355.0 |
| A | 15 | 184 | 22674 | 59.32 | 1629 | 1617 | 355.0 |
| A | 14 | 201 | 13986 | 34.84 | 1629 | 1617 | 355.0 |
| B | 10 | 199 | 106588 | 275.4 | 1650 | 1666 | 381.0 |
| B | 5 | 216 | 45505 | 115.07 | 1650 | 1666 | 381.0 |
| B | 5 | 47 | 30178 | 74.84 | 1650 | 1666 | 381.0 |
| C | 0 | 188 | 30156 | 67.85 | 1513 | 1574 | 421.3 |
| C | 0 | 202 | 22392 | 49.42 | 1513 | 1574 | 421.3 |
| C | 0 | 218 | 21525 | 47.36 | 1513 | 1574 | 421.3 |
| D | 10 | 202 | 283468 | 637.1 | 1475 | 1522 | 442.5 |
| D | 4 | 114 | 166523 | 372.85 | 1475 | 1522 | 442.5 |
| D | 7 | 67 | 137385 | 307.01 | 1475 | 1522 | 442.5 |
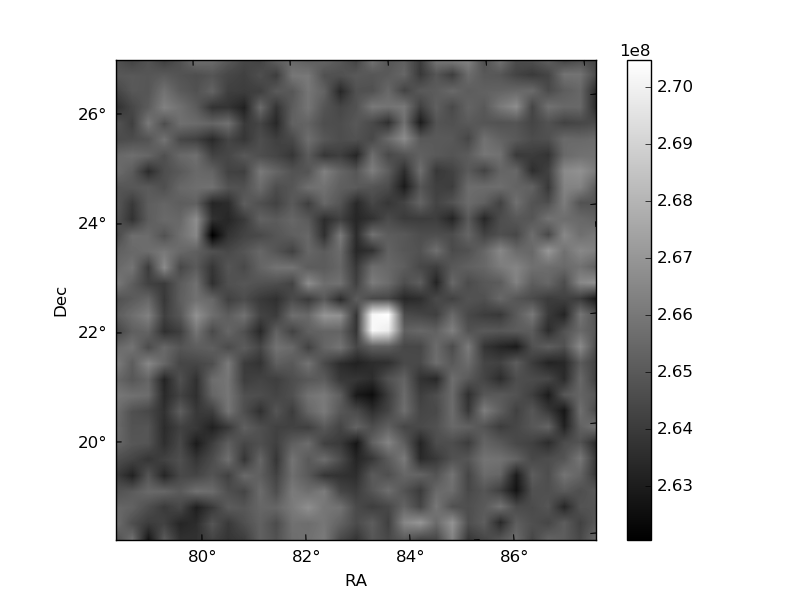
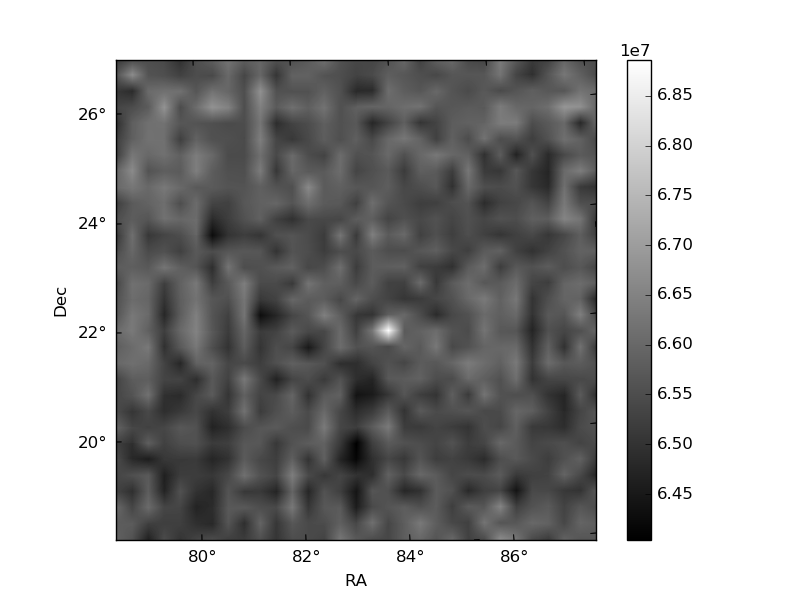
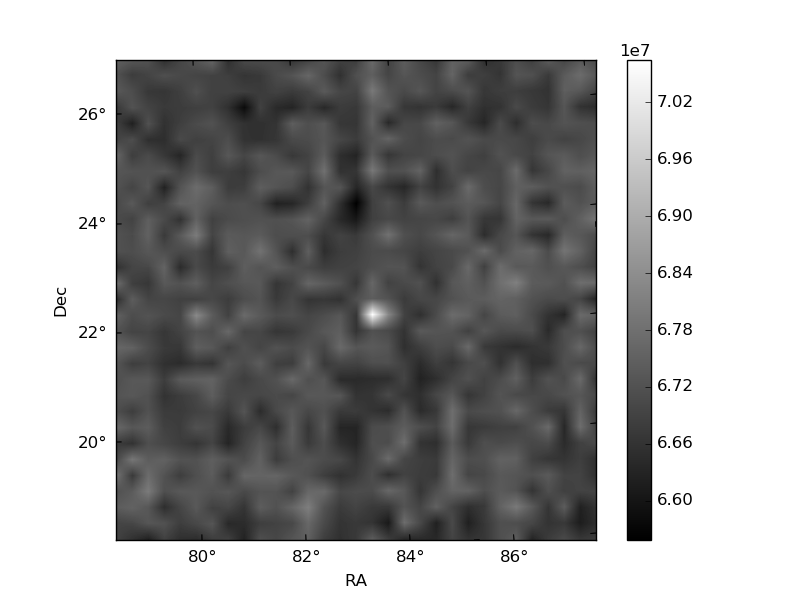
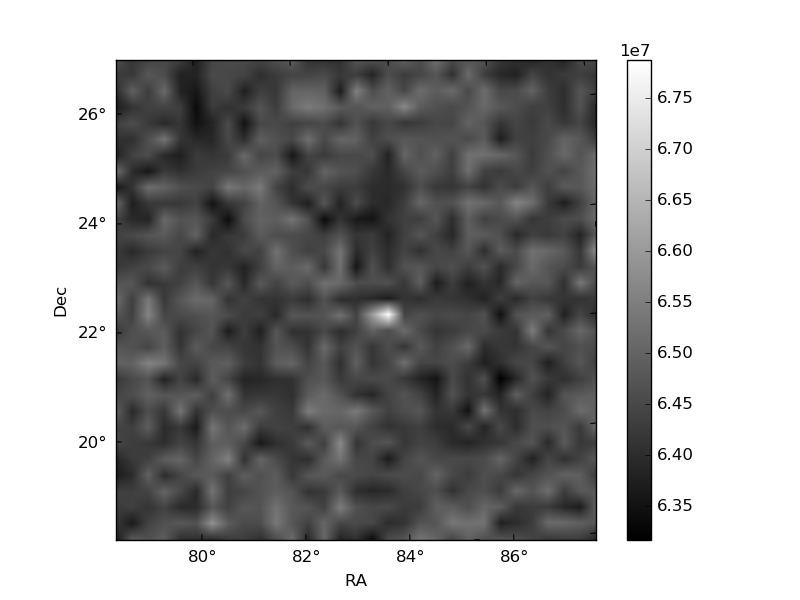
Histogram calculated using DETX and DETY for each event in the final _common_clean file
| Quadrant A |  |
 |
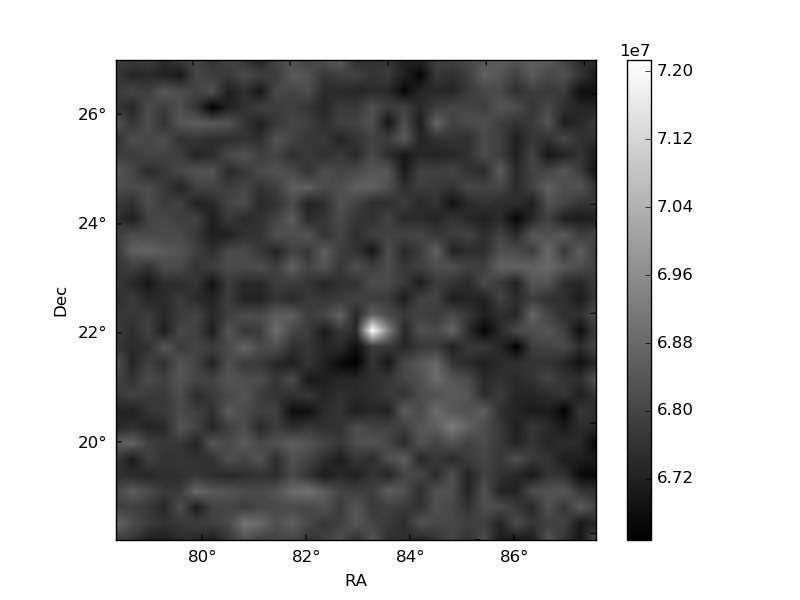
Quadrant B |
|---|---|---|---|
| Quadrant D |  |
 |
Quadrant C |
| Plot type | Count rate plots | Images |
|---|---|---|
| Comparison with Poisson distribution Blue bars denote a histogram of data divided into 1 sec bins. Red curve is a Poisson curve with rate = median count rate of data. |
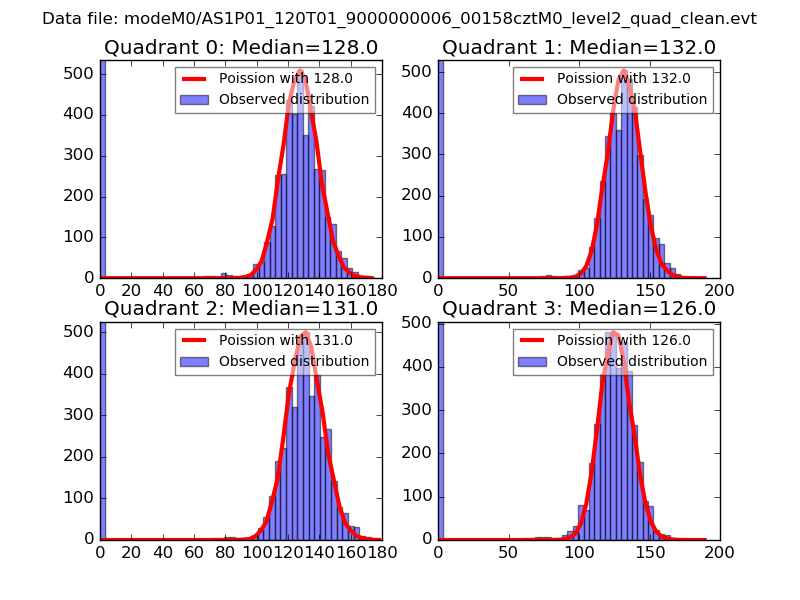 |
 |
| Quadrant-wise count rates Data is divided into 100 sec bins |
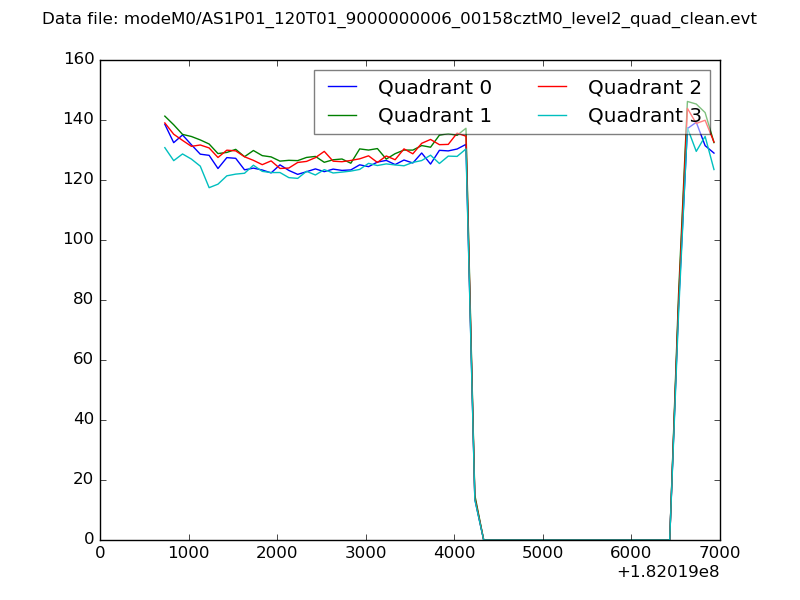 |
|
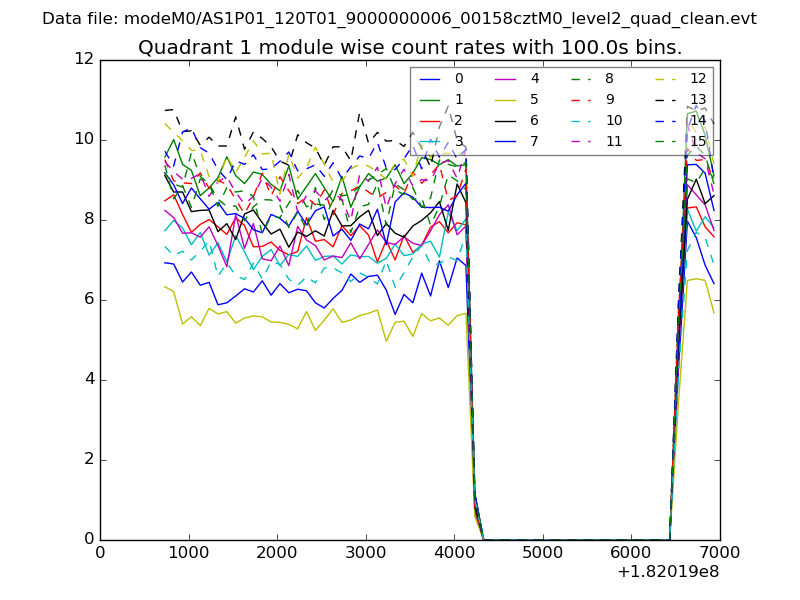
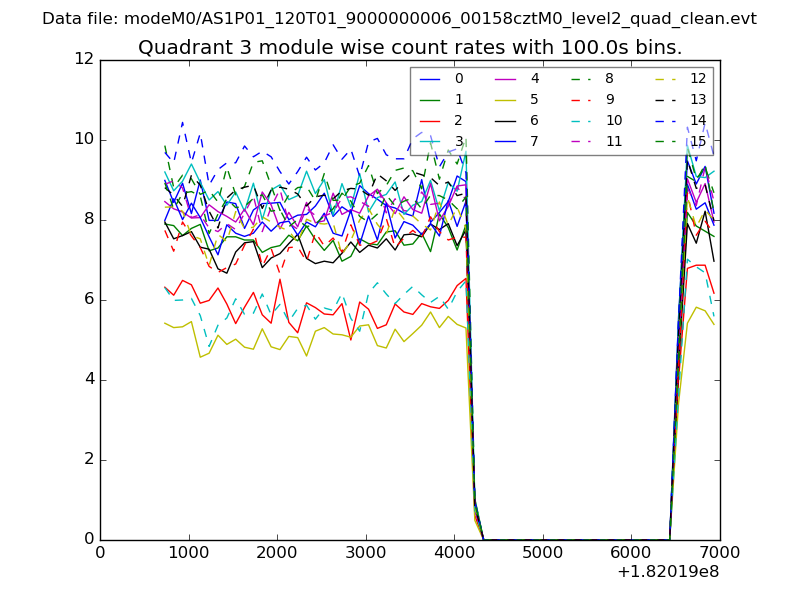
| Module-wise count rates for Quadrant A Data is divided into 100 sec bins |
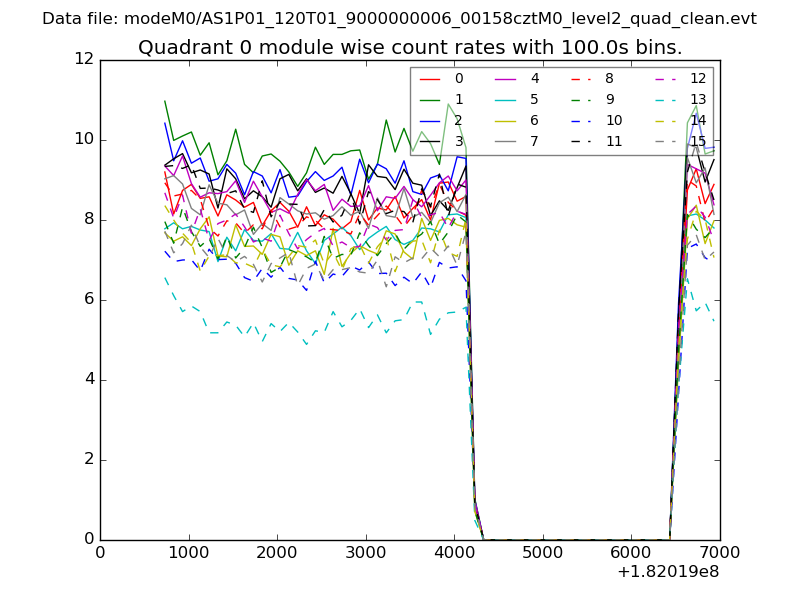 |
 |
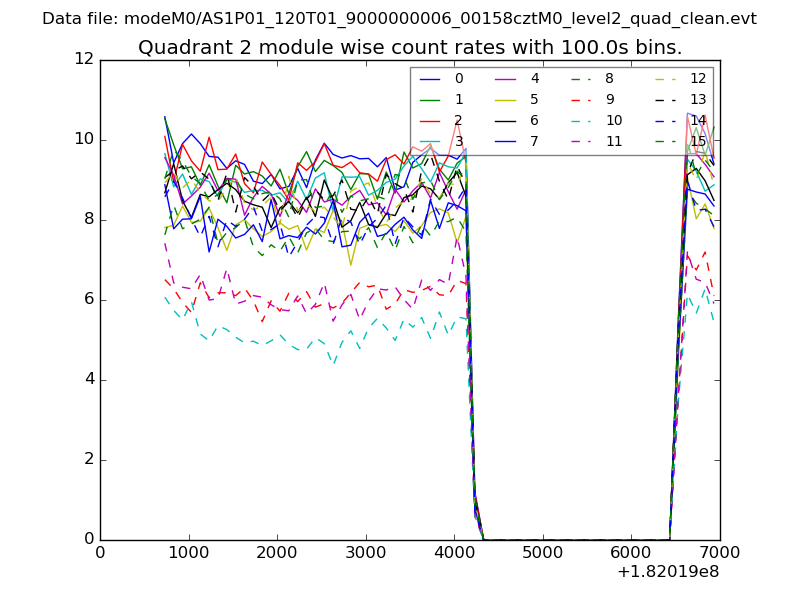
| Module-wise count rates for Quadrant B Data is divided into 100 sec bins |
 |
 |
| Module-wise count rates for Quadrant C Data is divided into 100 sec bins |
 |
 |
| Module-wise count rates for Quadrant D Data is divided into 100 sec bins |
 |
 |
| Parameter | Plot |
|---|---|
| CZT HV Monitor |  |
| D_VDD | 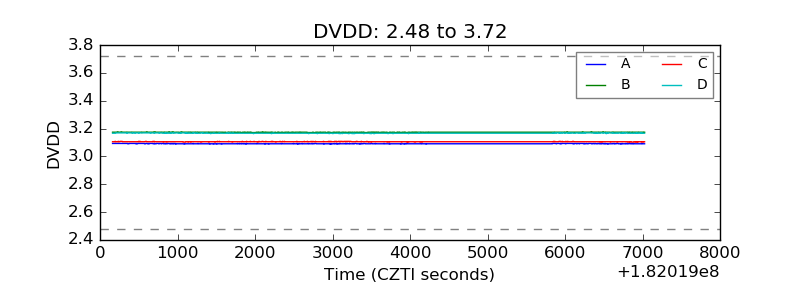 |
| Temperature 1 | 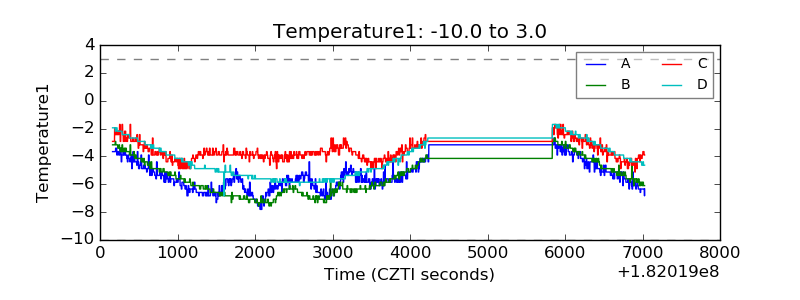 |
| Veto HV Monitor | 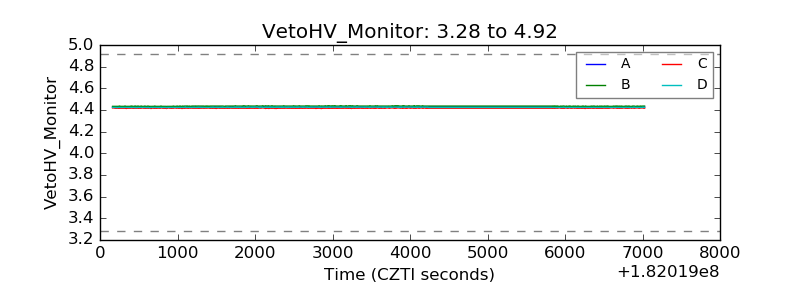 |
| Veto LLD |  |
| Alpha Counter | 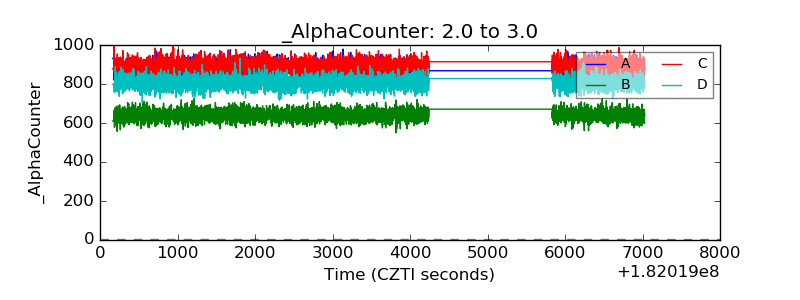 |
| _CPM_Rate | 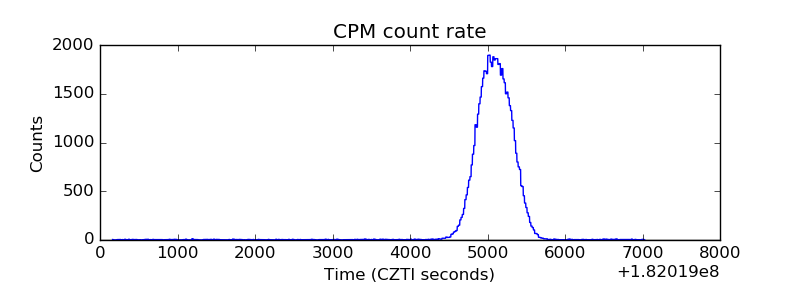 |
| CZT Counter | 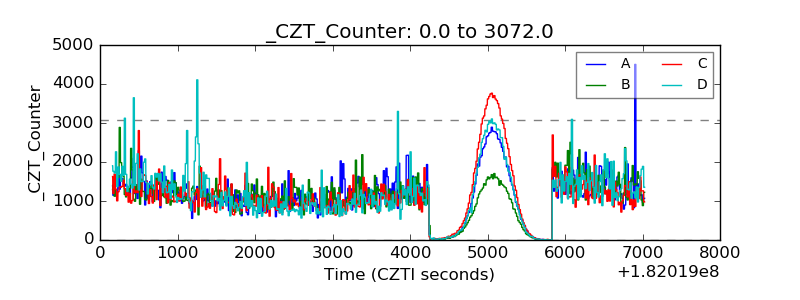 |
| +2.5 Volts monitor |  |
| +5 Volts monitor |  |
| _ROLL_ROT | 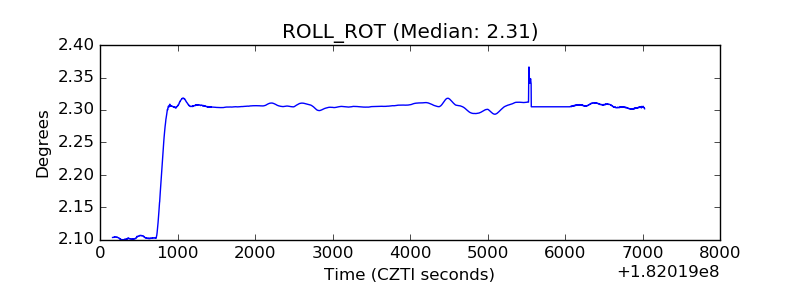 |
| _Roll_DEC | 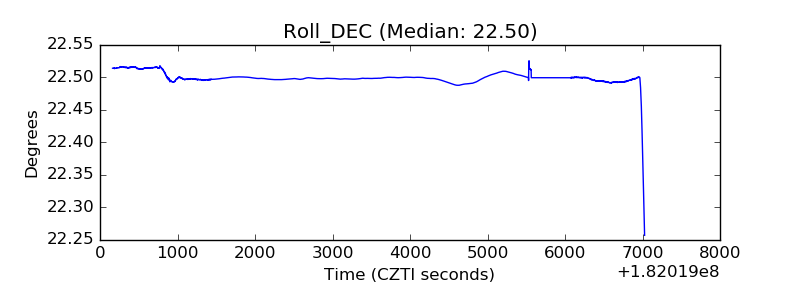 |
| _Roll_RA | 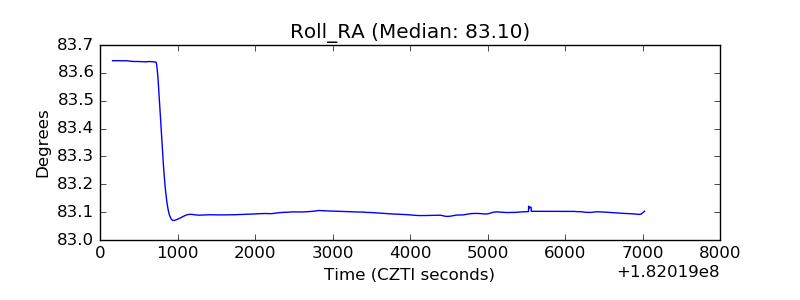 |
| Veto Counter | 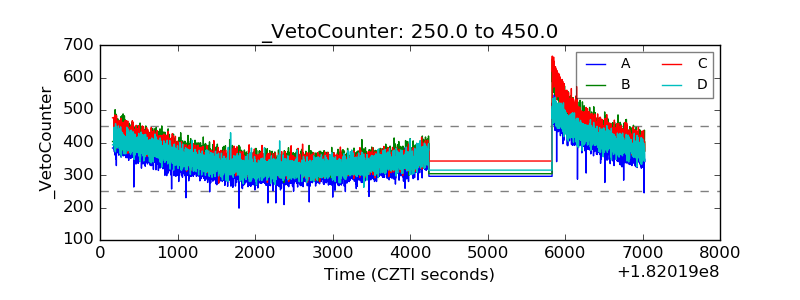 |