| Param | Original file | Final file |
|---|---|---|
| Filename | modeM0/AS1P01_120T01_9000000006_00160cztM0_level2.evt | modeM0/AS1P01_120T01_9000000006_00160cztM0_level2_quad_clean.evt |
| Size (bytes) | 511,790,400 | 13,032,000 |
| Size | 488.1 MB | 12.4 MB |
| Events in quadrant A | 3,958,233 | 39,759 |
| Events in quadrant B | 3,819,283 | 41,485 |
| Events in quadrant C | 3,580,991 | 39,867 |
| Events in quadrant D | 3,919,794 | 37,956 |
| Mode SS | |||
|---|---|---|---|
| Quadrant | BADHDUFLAG | Total packets | Discarded packets |
| A | 0 | 70 | 2 |
| B | 0 | 70 | 2 |
| C | 0 | 70 | 0 |
| D | 0 | 70 | 2 |
| Mode M0 | |||
|---|---|---|---|
| Quadrant | BADHDUFLAG | Total packets | Discarded packets |
| A | 0 | 15001 | 876 |
| B | 0 | 14583 | 905 |
| C | 0 | 13773 | 804 |
| D | 0 | 14943 | 924 |
| Quadrant | Total seconds | Saturated seconds | Saturation percentage |
|---|---|---|---|
| A | 3301 | 3 | 0.090882% |
| B | 3295 | 0 | 0.000000% |
| C | 3298 | 0 | 0.000000% |
| D | 3288 | 63 | 1.916058% |
Noise dominated data is calculated using 1-second bins in cleaned event files. If a bin has >2000 counts, and if more than 50% of those come from <1% of pixels, then it is considered to be noise-dominated and hence unusable.
| Quadrant | # 1 sec bins | Bins with >0 counts | Bins with >2000 counts | High rate bins dominated by noise | Noise dominated (total time) | Noise dominated (detector-on time) | Marked lightcurve |
|---|---|---|---|---|---|---|---|
| A | 6272 | 3332 | 101 | 101 | 1.61% | 3.03% | 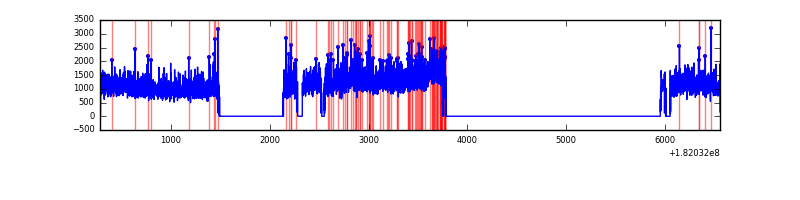 |
| B | 6270 | 3326 | 38 | 38 | 0.61% | 1.14% |  |
| C | 6265 | 3329 | 27 | 27 | 0.43% | 0.81% | 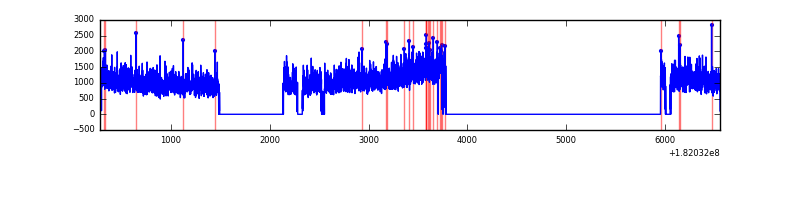 |
| D | 6265 | 3323 | 222 | 222 | 3.54% | 6.68% |  |
Top three noisy pixels from each quadrant. If the there are fewer than three noisy pixels in the level2.evt file, extra rows are filled as -1
| Pixel properties | Quadrant properties | ||||||
|---|---|---|---|---|---|---|---|
| Quadrant | DetID | PixID | Counts | Sigma | Mean | Median | Sigma |
| A | 15 | 106 | 89065 | 401.68 | 983 | 977 | 219.3 |
| A | 14 | 201 | 20803 | 90.41 | 983 | 977 | 219.3 |
| A | 14 | 10 | 16929 | 72.74 | 983 | 977 | 219.3 |
| B | 10 | 199 | 11570 | 45.4 | 989 | 998 | 232.9 |
| B | 0 | 212 | 9339 | 35.82 | 989 | 998 | 232.9 |
| B | 14 | 50 | 7438 | 27.66 | 989 | 998 | 232.9 |
| C | 1 | 1 | 16202 | 60.63 | 897 | 927 | 251.9 |
| C | 7 | 255 | 15267 | 56.92 | 897 | 927 | 251.9 |
| C | 9 | 128 | 10056 | 36.24 | 897 | 927 | 251.9 |
| D | 10 | 202 | 308083 | 1160.96 | 879 | 908 | 264.6 |
| D | 14 | 53 | 187591 | 705.57 | 879 | 908 | 264.6 |
| D | 2 | 106 | 11627 | 40.51 | 879 | 908 | 264.6 |
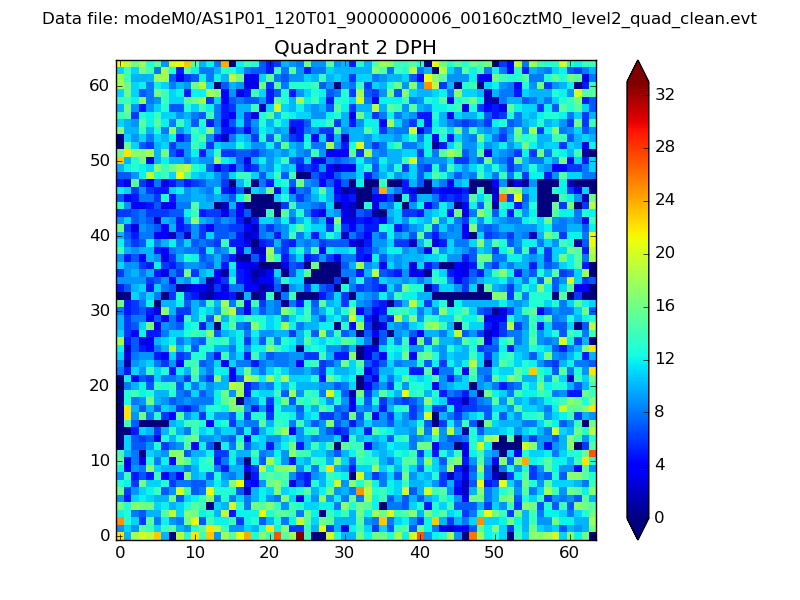
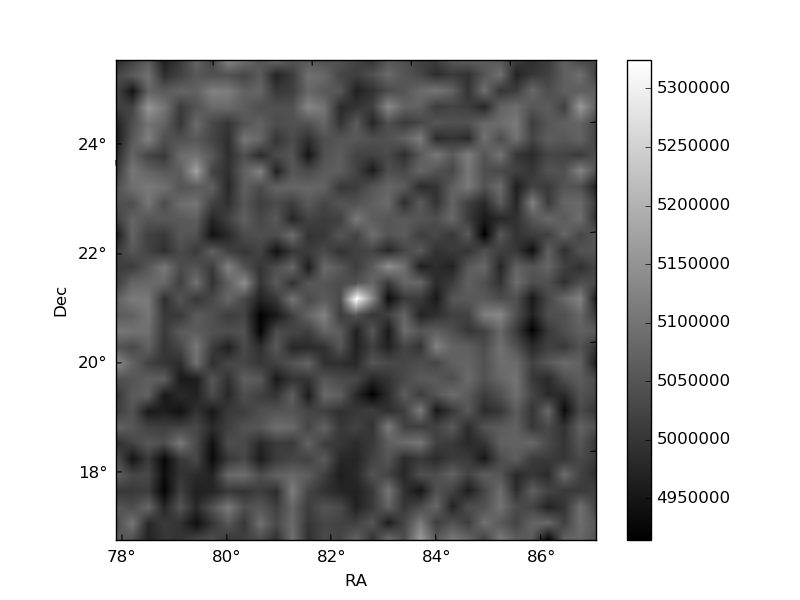
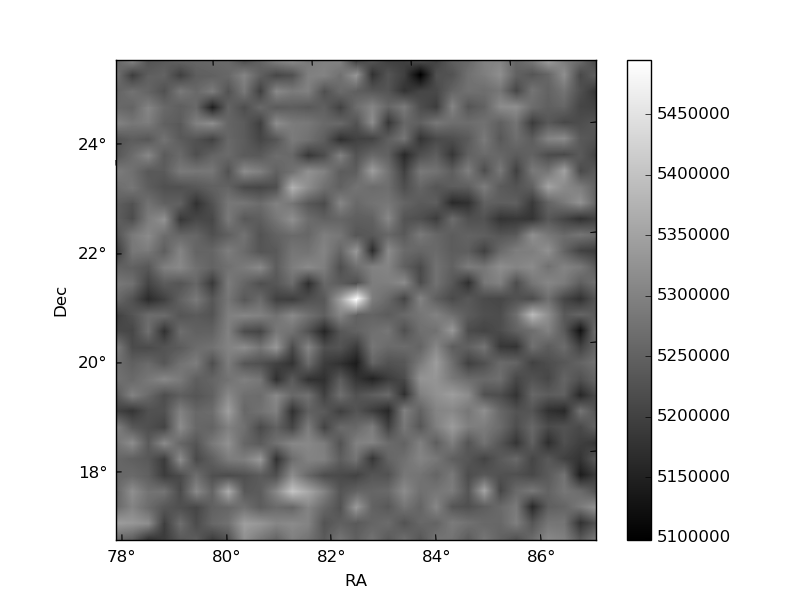
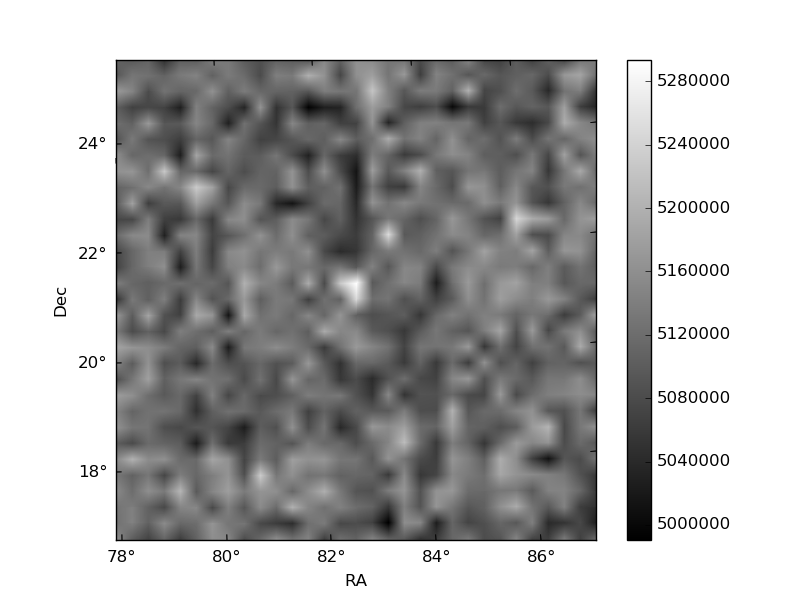
Histogram calculated using DETX and DETY for each event in the final _common_clean file
| Quadrant A | 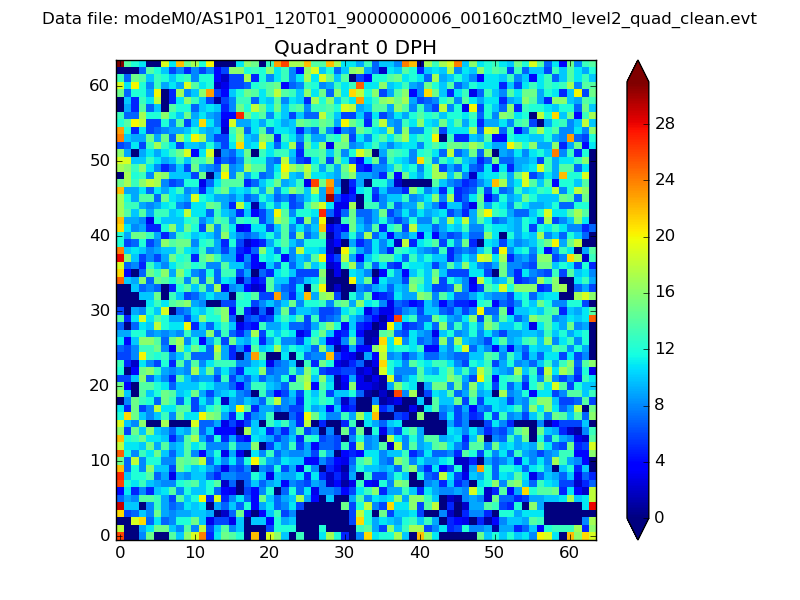 |
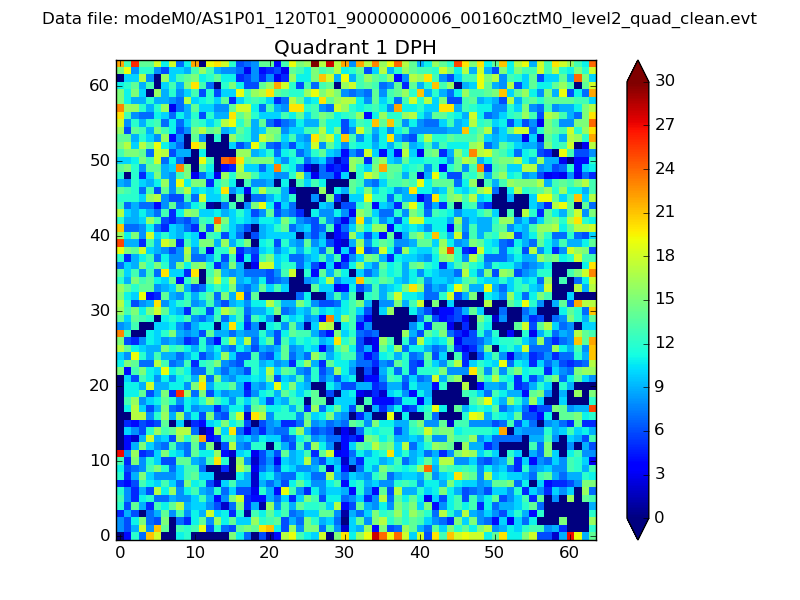 |
Quadrant B |
|---|---|---|---|
| Quadrant D | 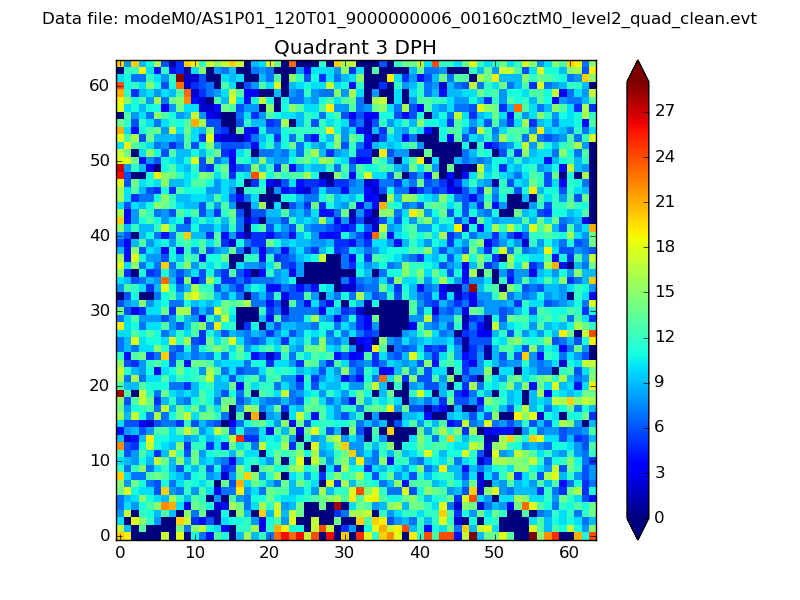 |
 |
Quadrant C |
| Plot type | Count rate plots | Images |
|---|---|---|
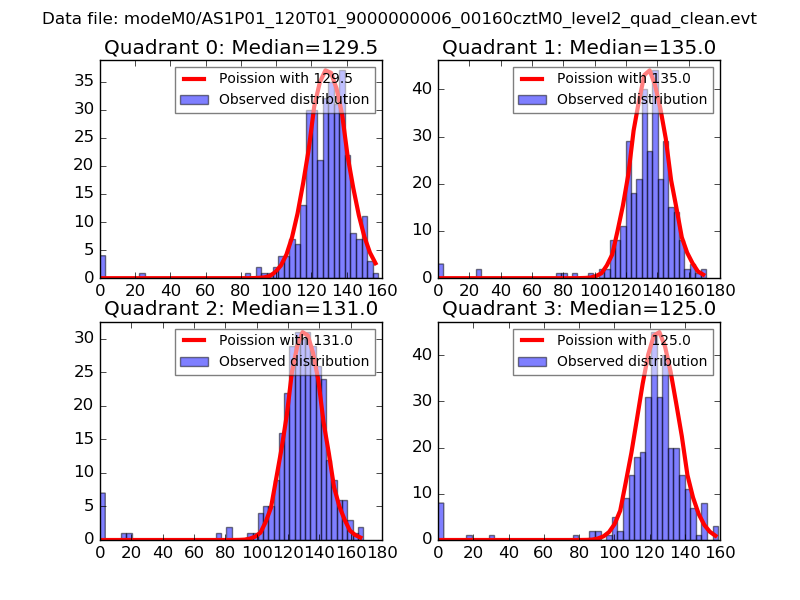
| Comparison with Poisson distribution Blue bars denote a histogram of data divided into 1 sec bins. Red curve is a Poisson curve with rate = median count rate of data. |
 |
 |
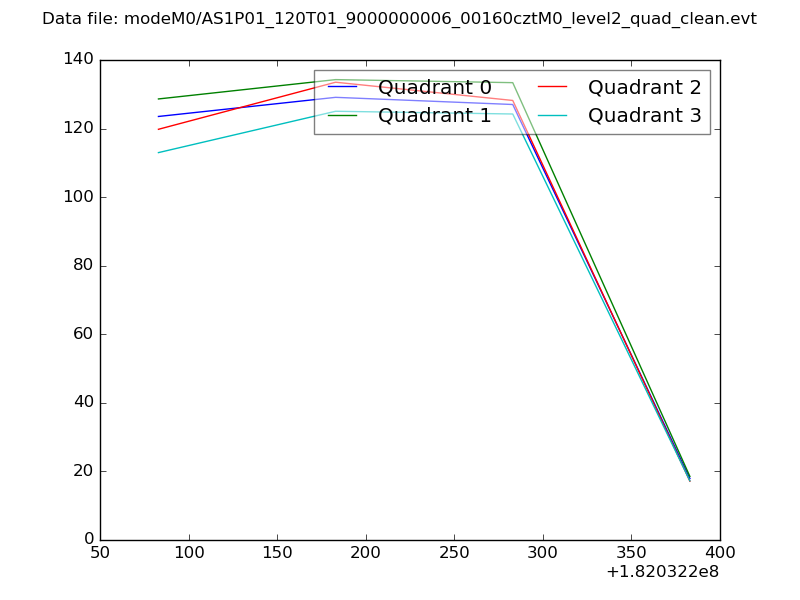
| Quadrant-wise count rates Data is divided into 100 sec bins |
 |
|
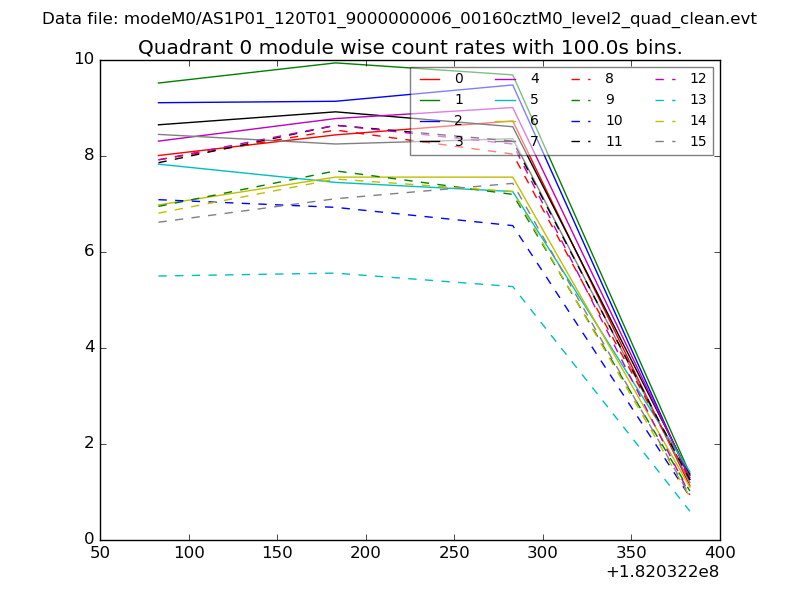
| Module-wise count rates for Quadrant A Data is divided into 100 sec bins |
 |
 |
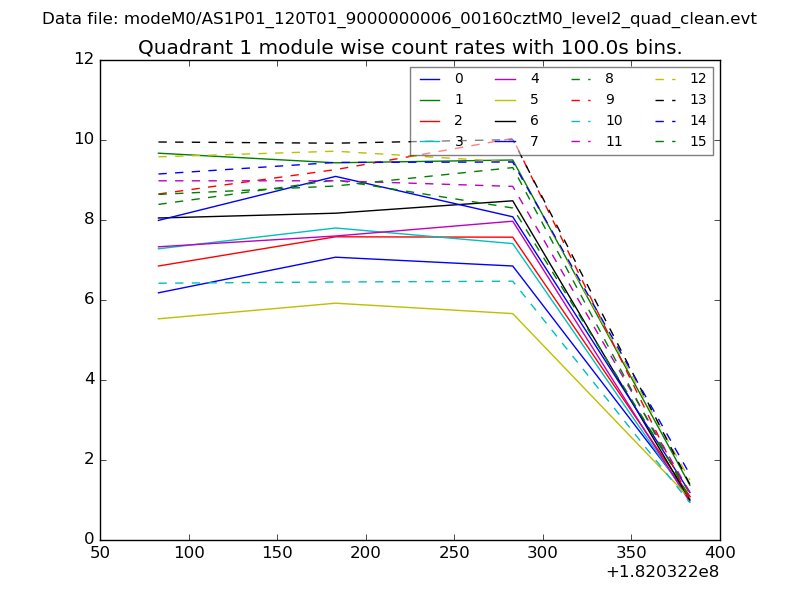
| Module-wise count rates for Quadrant B Data is divided into 100 sec bins |
 |
 |
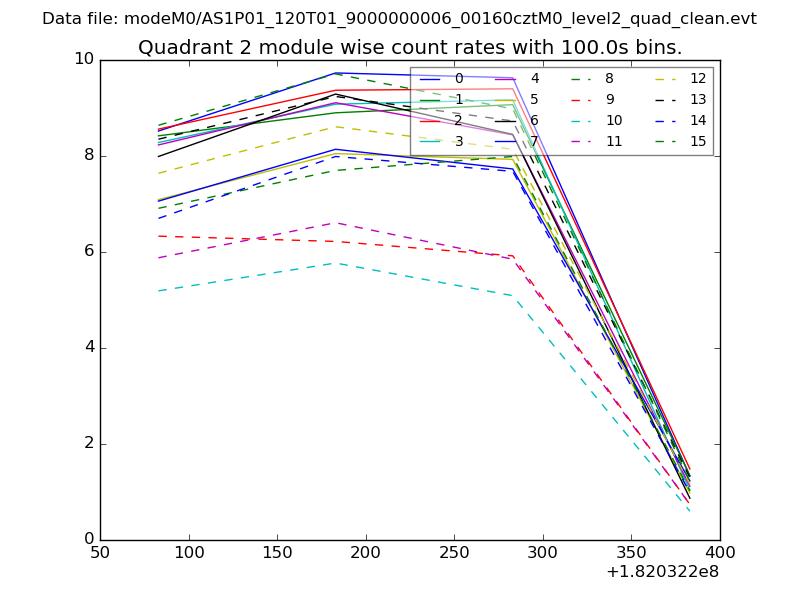
| Module-wise count rates for Quadrant C Data is divided into 100 sec bins |
 |
 |
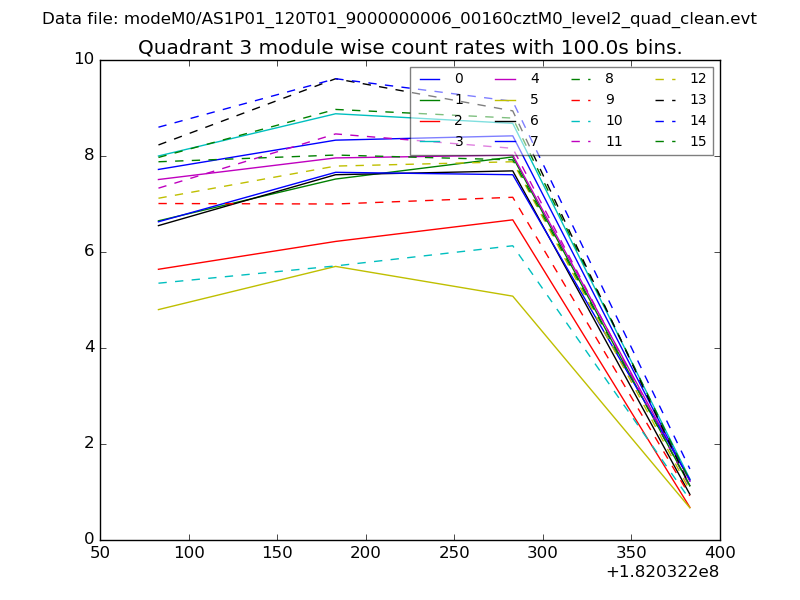
| Module-wise count rates for Quadrant D Data is divided into 100 sec bins |
 |
 |
| Parameter | Plot |
|---|---|
| CZT HV Monitor | 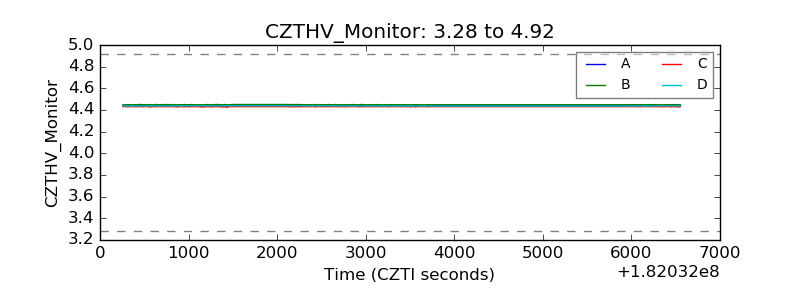 |
| D_VDD | 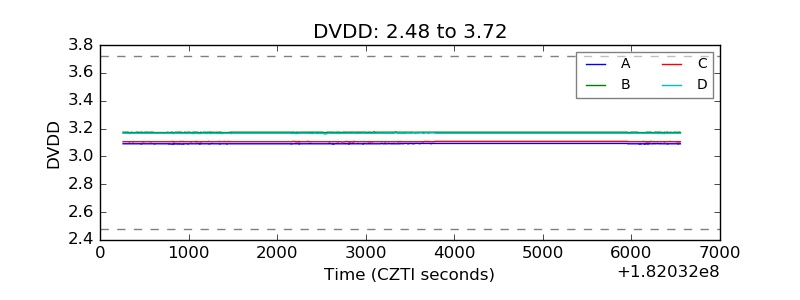 |
| Temperature 1 | 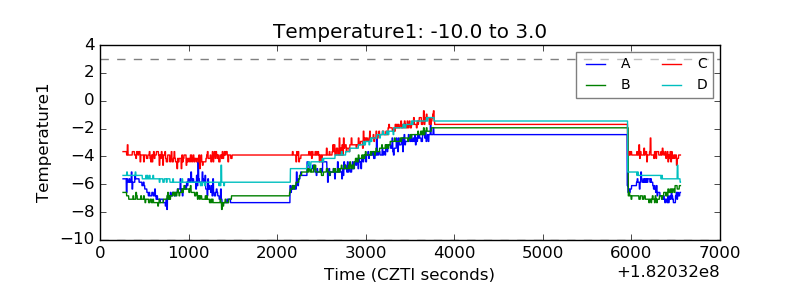 |
| Veto HV Monitor | 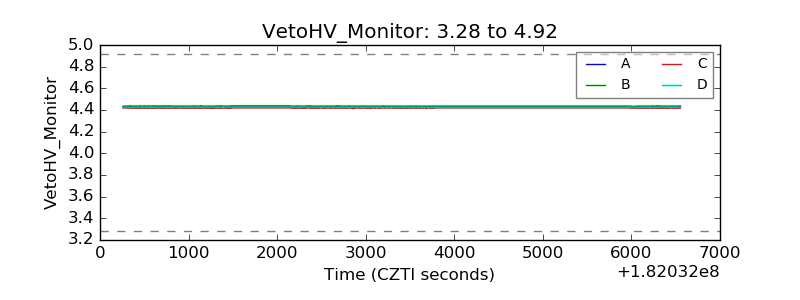 |
| Veto LLD | 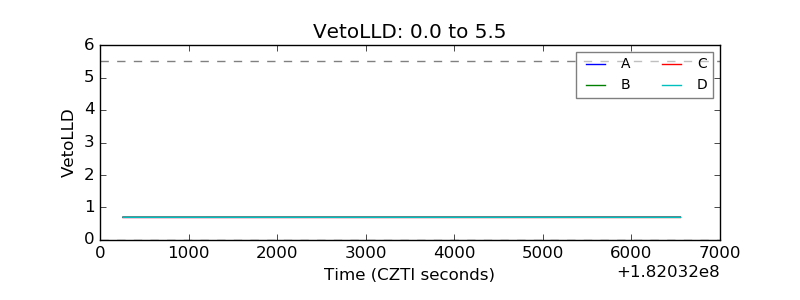 |
| Alpha Counter | 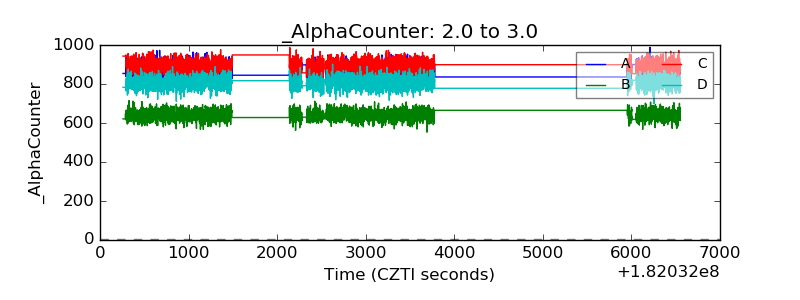 |
| _CPM_Rate | 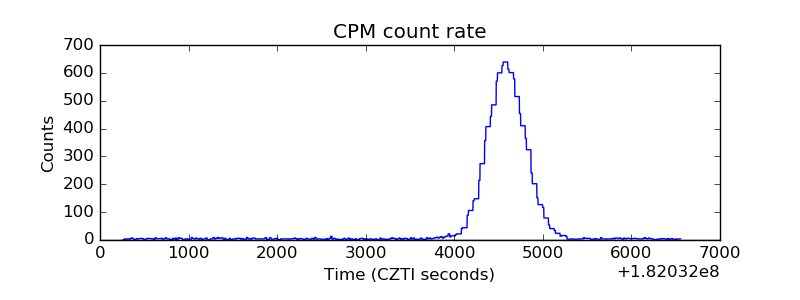 |
| CZT Counter | 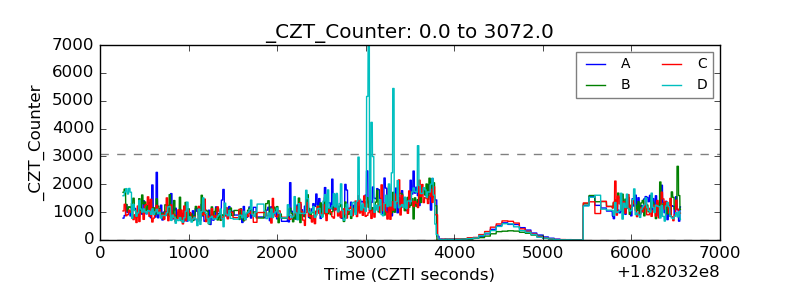 |
| +2.5 Volts monitor |  |
| +5 Volts monitor |  |
| _ROLL_ROT | 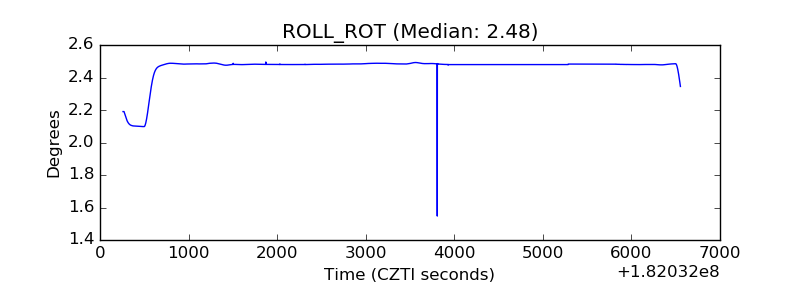 |
| _Roll_DEC | 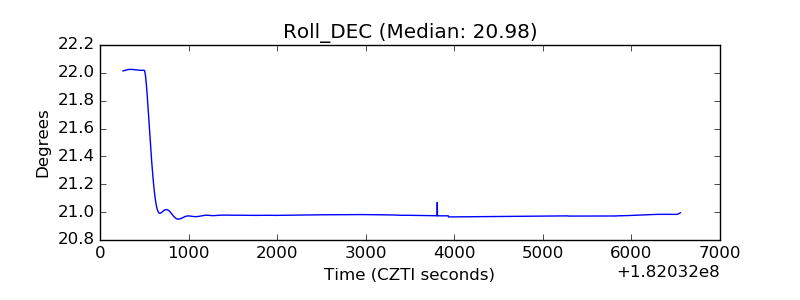 |
| _Roll_RA | 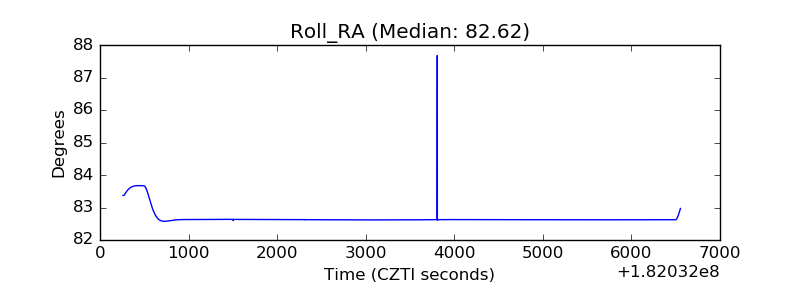 |
| Veto Counter | 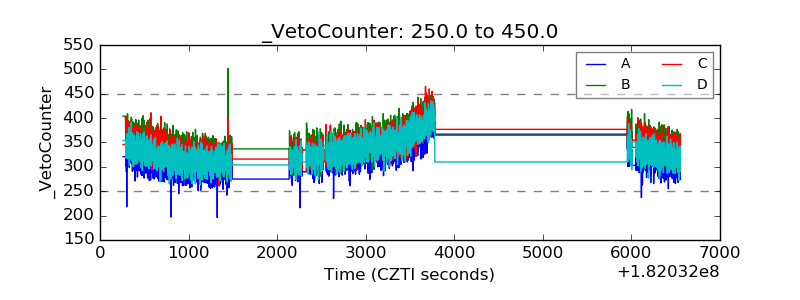 |