| Param | Original file | Final file |
|---|---|---|
| Filename | modeM0/AS1P01_120T01_9000000006_00161cztM0_level2.evt | modeM0/AS1P01_120T01_9000000006_00161cztM0_level2_quad_clean.evt |
| Size (bytes) | 830,191,680 | 70,920,000 |
| Size | 791.7 MB | 67.6 MB |
| Events in quadrant A | 6,238,652 | 442,133 |
| Events in quadrant B | 6,651,269 | 450,294 |
| Events in quadrant C | 5,959,489 | 445,311 |
| Events in quadrant D | 5,933,441 | 432,337 |
| Mode SS | |||
|---|---|---|---|
| Quadrant | BADHDUFLAG | Total packets | Discarded packets |
| A | 0 | 108 | 0 |
| B | 0 | 108 | 0 |
| C | 0 | 108 | 0 |
| D | 0 | 108 | 0 |
| Mode M9 | |||
|---|---|---|---|
| Quadrant | BADHDUFLAG | Total packets | Discarded packets |
| A | 0 | 17 | 0 |
| B | 0 | 17 | 0 |
| C | 0 | 17 | 0 |
| D | 0 | 17 | 0 |
| Mode M0 | |||
|---|---|---|---|
| Quadrant | BADHDUFLAG | Total packets | Discarded packets |
| A | 0 | 22383 | 2 |
| B | 0 | 23621 | 1 |
| C | 0 | 21574 | 1 |
| D | 0 | 21513 | 1 |
| Quadrant | Total seconds | Saturated seconds | Saturation percentage |
|---|---|---|---|
| A | 5411 | 2 | 0.036962% |
| B | 5411 | 28 | 0.517464% |
| C | 5411 | 14 | 0.258732% |
| D | 5411 | 42 | 0.776197% |
Noise dominated data is calculated using 1-second bins in cleaned event files. If a bin has >2000 counts, and if more than 50% of those come from <1% of pixels, then it is considered to be noise-dominated and hence unusable.
| Quadrant | # 1 sec bins | Bins with >0 counts | Bins with >2000 counts | High rate bins dominated by noise | Noise dominated (total time) | Noise dominated (detector-on time) | Marked lightcurve |
|---|---|---|---|---|---|---|---|
| A | 7032 | 5413 | 104 | 104 | 1.48% | 1.92% | 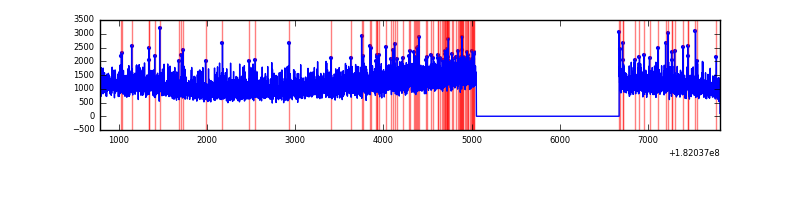 |
| B | 7032 | 5413 | 270 | 270 | 3.84% | 4.99% | 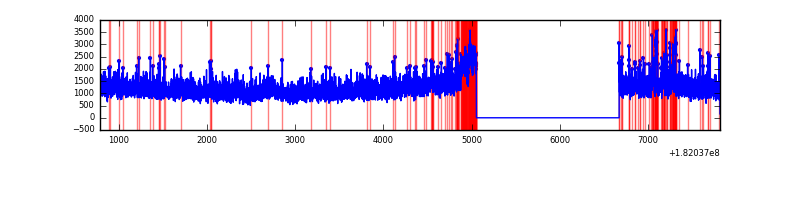 |
| C | 7032 | 5413 | 66 | 66 | 0.94% | 1.22% | 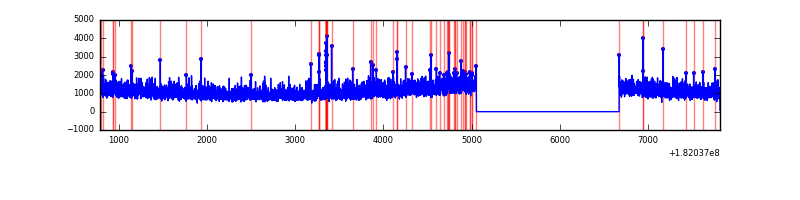 |
| D | 7032 | 5413 | 156 | 156 | 2.22% | 2.88% | 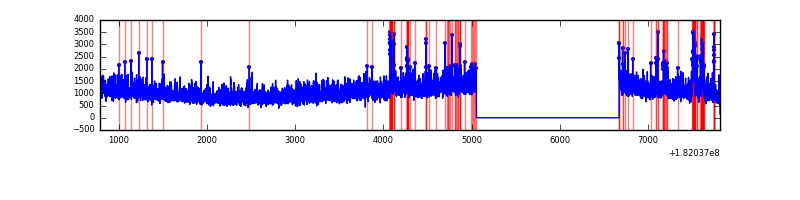 |
Top three noisy pixels from each quadrant. If the there are fewer than three noisy pixels in the level2.evt file, extra rows are filled as -1
| Pixel properties | Quadrant properties | ||||||
|---|---|---|---|---|---|---|---|
| Quadrant | DetID | PixID | Counts | Sigma | Mean | Median | Sigma |
| A | 14 | 10 | 36287 | 100.13 | 1573 | 1562 | 346.8 |
| A | 15 | 106 | 35188 | 96.96 | 1573 | 1562 | 346.8 |
| A | 13 | 17 | 31805 | 87.21 | 1573 | 1562 | 346.8 |
| B | 10 | 199 | 260344 | 696.86 | 1607 | 1621 | 371.3 |
| B | 7 | 235 | 146145 | 389.27 | 1607 | 1621 | 371.3 |
| B | 5 | 216 | 66925 | 175.89 | 1607 | 1621 | 371.3 |
| C | 12 | 48 | 58809 | 139.87 | 1464 | 1522 | 409.6 |
| C | 1 | 1 | 34891 | 81.47 | 1464 | 1522 | 409.6 |
| C | 9 | 128 | 26368 | 60.66 | 1464 | 1522 | 409.6 |
| D | 10 | 202 | 274256 | 634.74 | 1422 | 1471 | 429.8 |
| D | 14 | 53 | 67722 | 154.16 | 1422 | 1471 | 429.8 |
| D | 2 | 106 | 31982 | 71.0 | 1422 | 1471 | 429.8 |
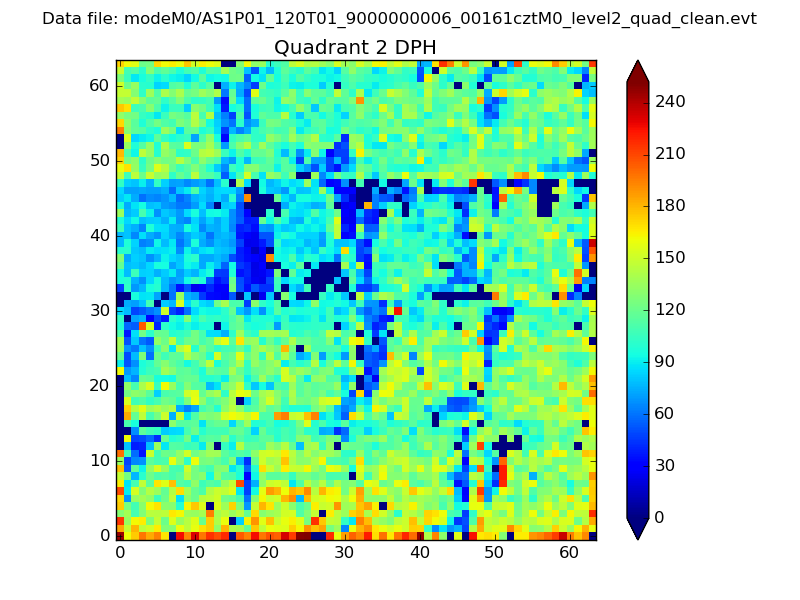
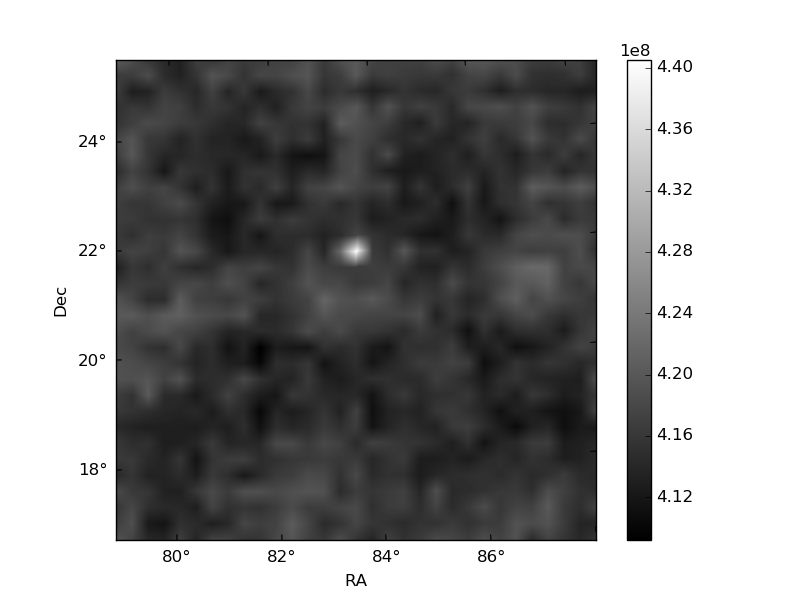
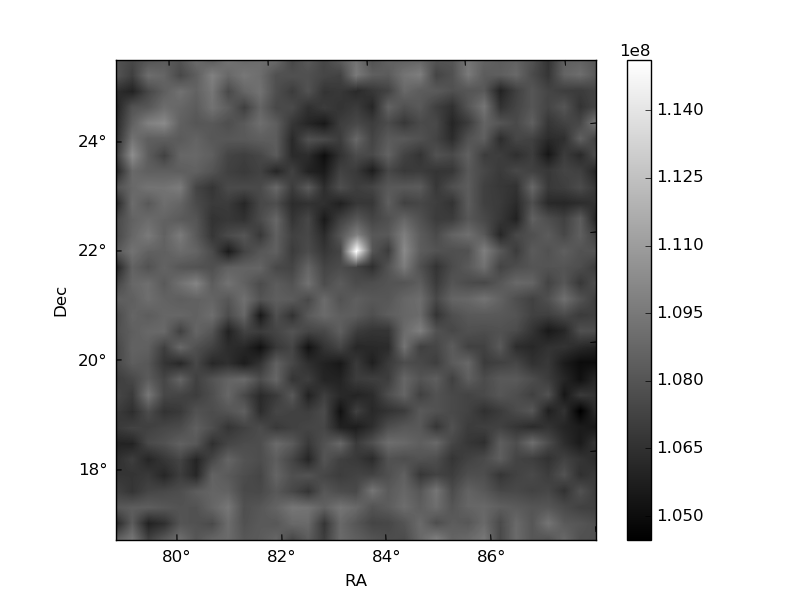
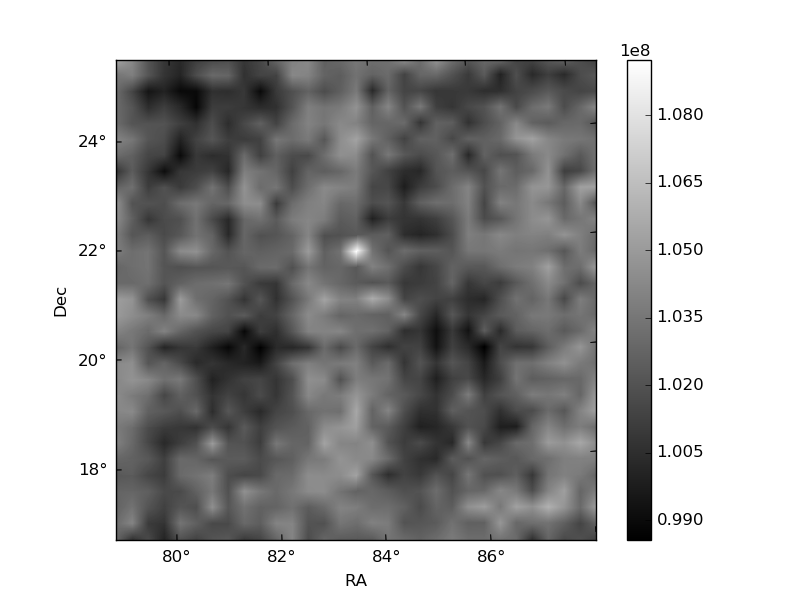
Histogram calculated using DETX and DETY for each event in the final _common_clean file
| Quadrant A | 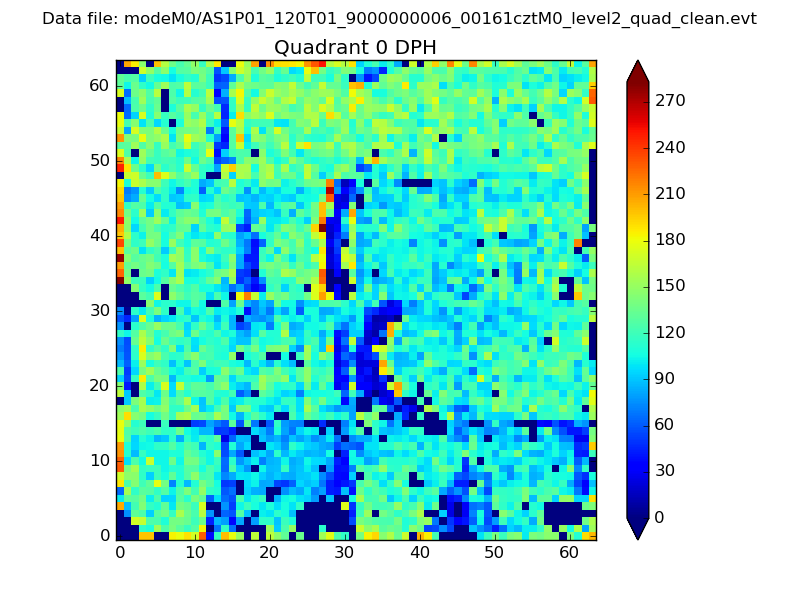 |
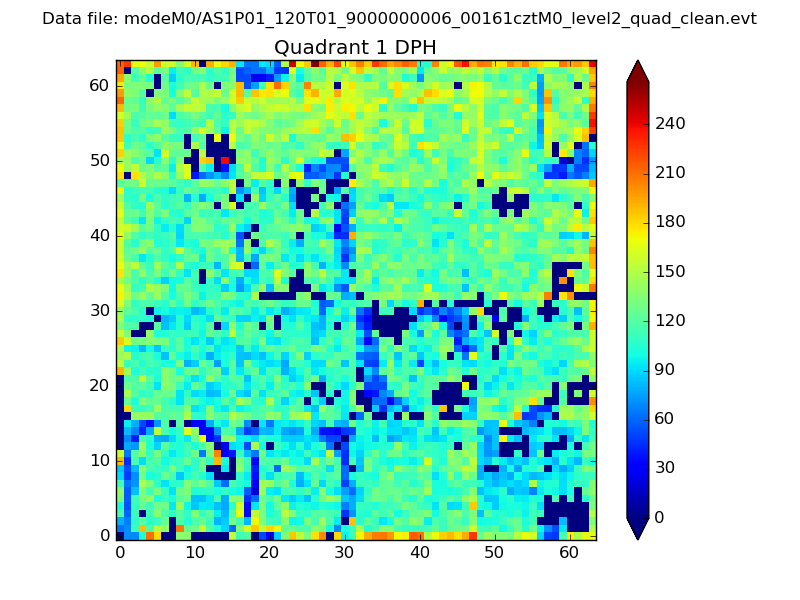 |
Quadrant B |
|---|---|---|---|
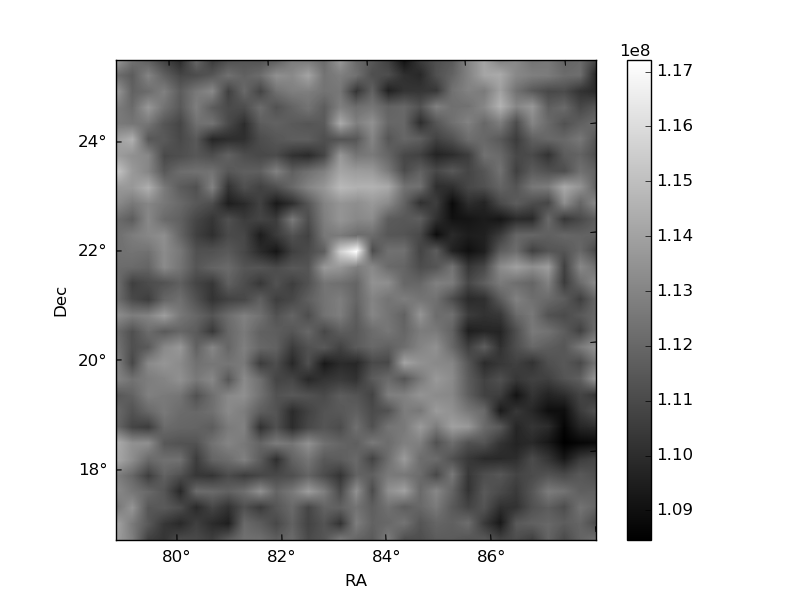
| Quadrant D | 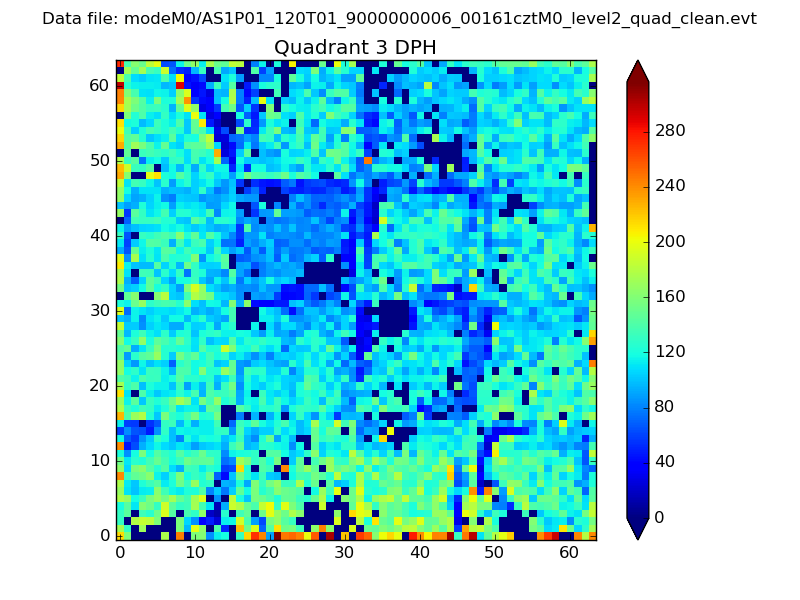 |
 |
Quadrant C |
| Plot type | Count rate plots | Images |
|---|---|---|
| Comparison with Poisson distribution Blue bars denote a histogram of data divided into 1 sec bins. Red curve is a Poisson curve with rate = median count rate of data. |
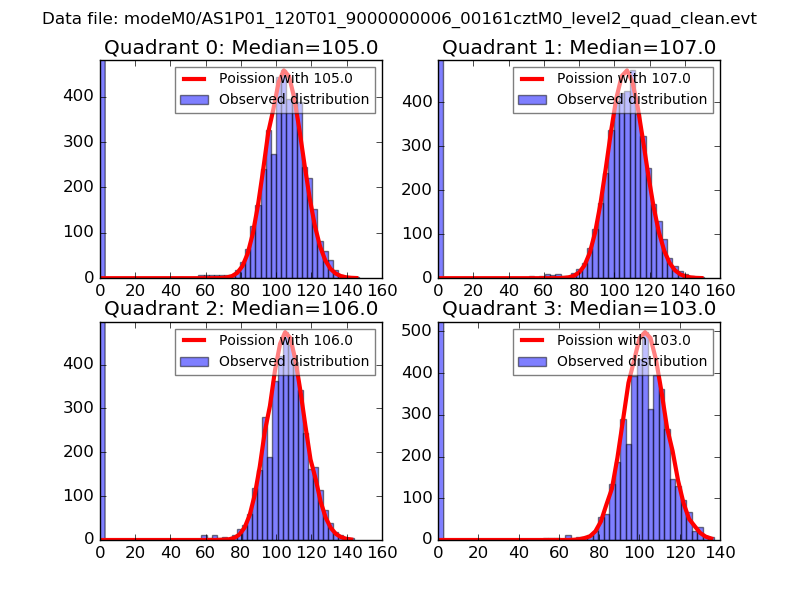 |
 |
| Quadrant-wise count rates Data is divided into 100 sec bins |
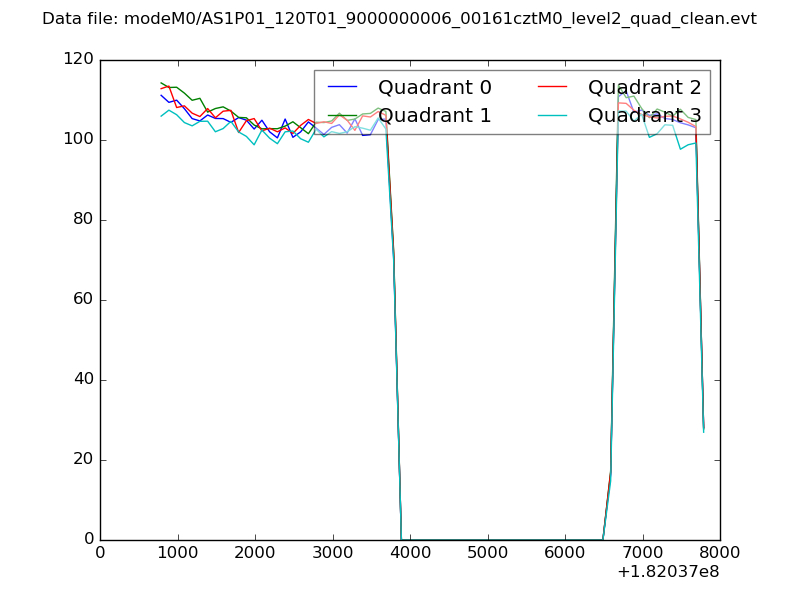 |
|
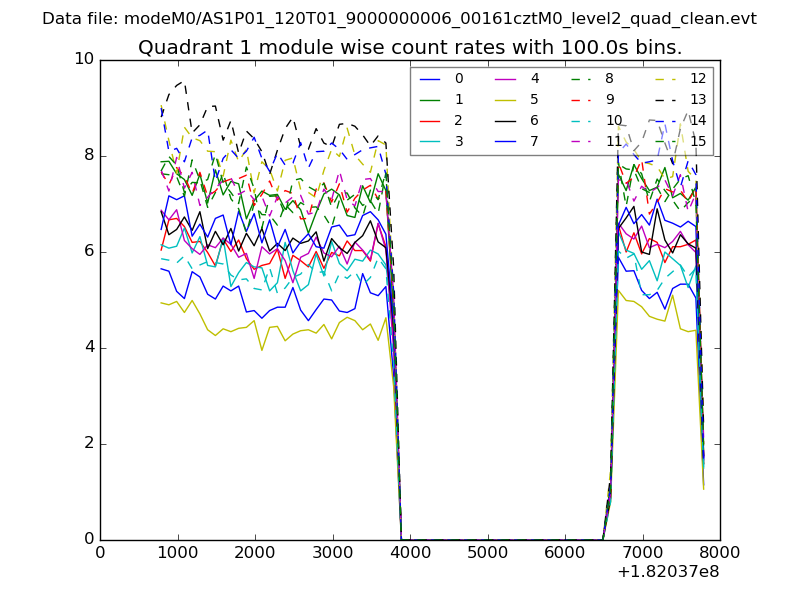
| Module-wise count rates for Quadrant A Data is divided into 100 sec bins |
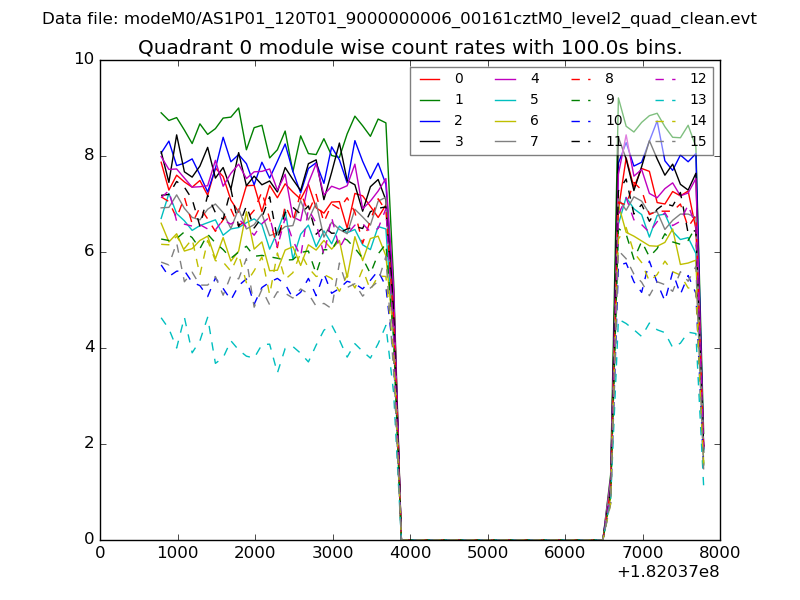 |
 |
| Module-wise count rates for Quadrant B Data is divided into 100 sec bins |
 |
 |
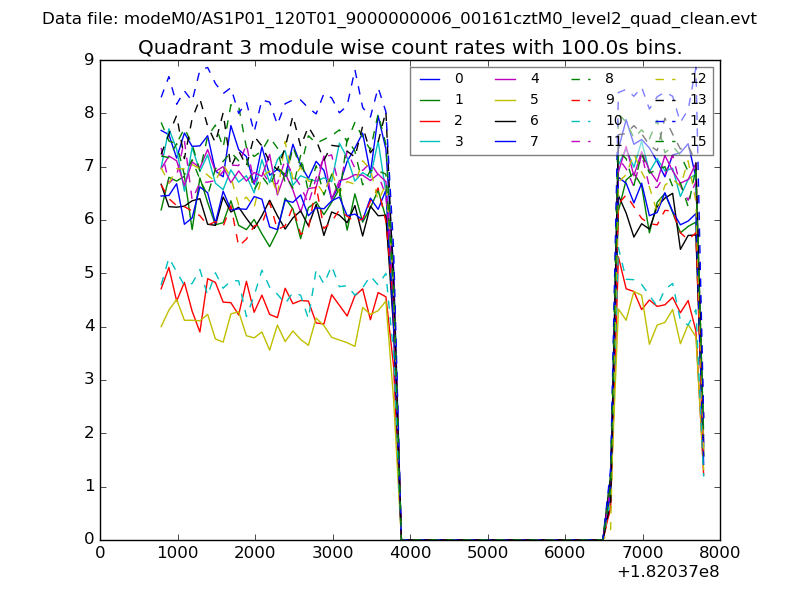
| Module-wise count rates for Quadrant C Data is divided into 100 sec bins |
 |
 |
| Module-wise count rates for Quadrant D Data is divided into 100 sec bins |
 |
 |
| Parameter | Plot |
|---|---|
| CZT HV Monitor | 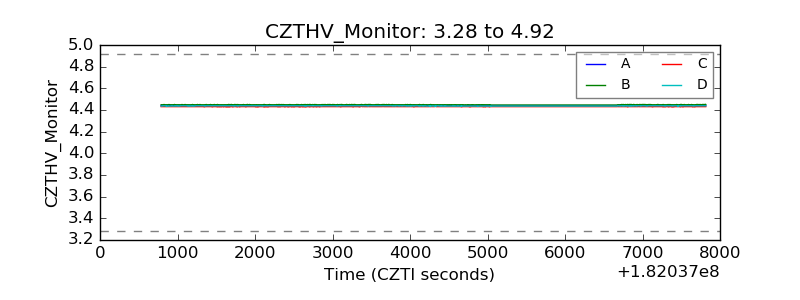 |
| D_VDD | 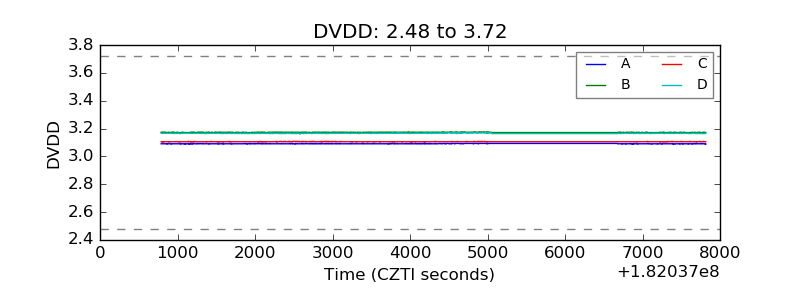 |
| Temperature 1 | 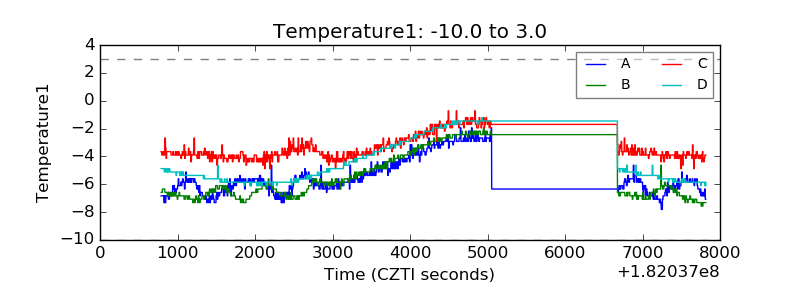 |
| Veto HV Monitor | 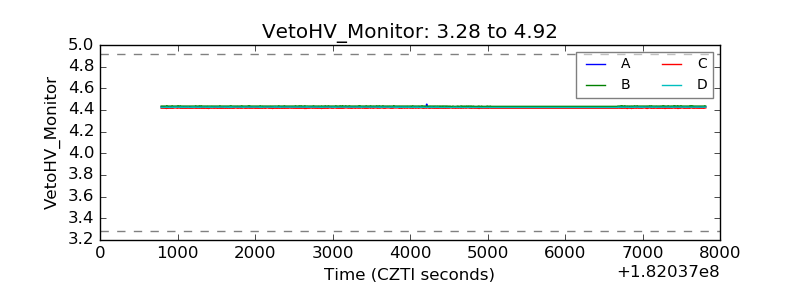 |
| Veto LLD | 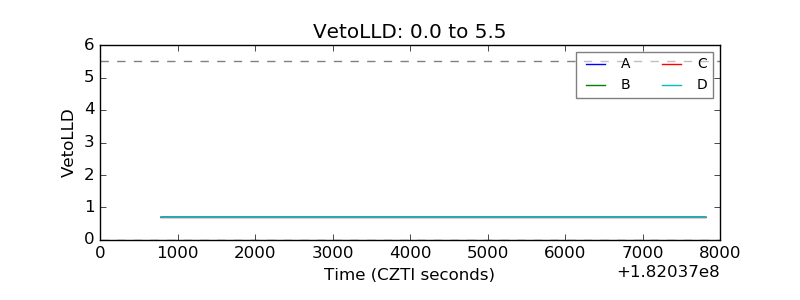 |
| Alpha Counter | 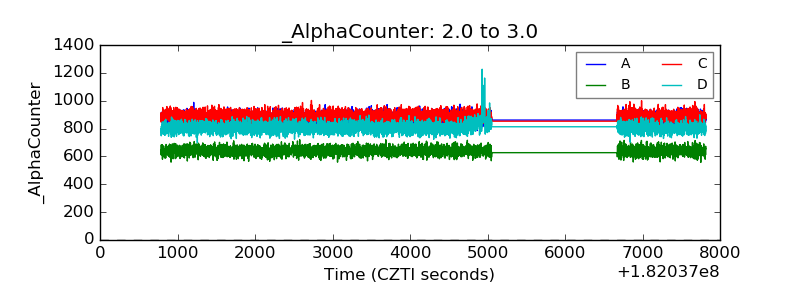 |
| _CPM_Rate | 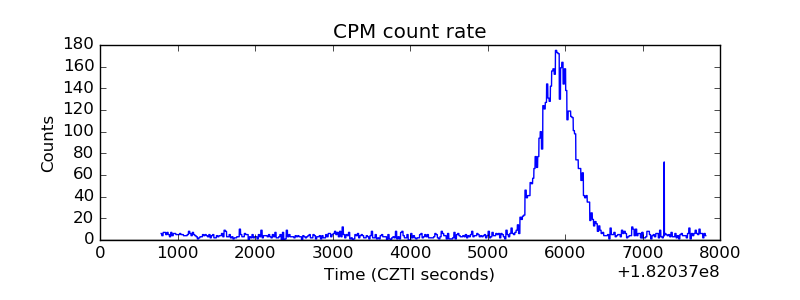 |
| CZT Counter | 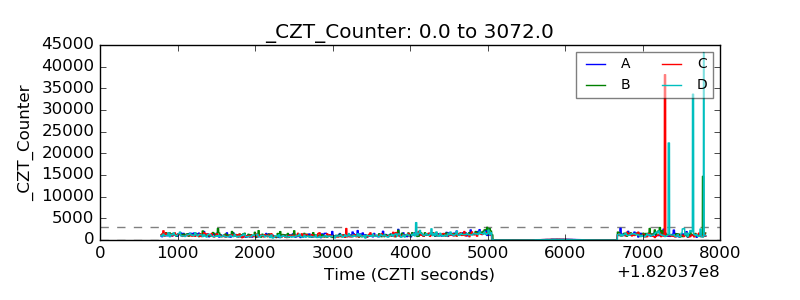 |
| +2.5 Volts monitor |  |
| +5 Volts monitor |  |
| _ROLL_ROT | 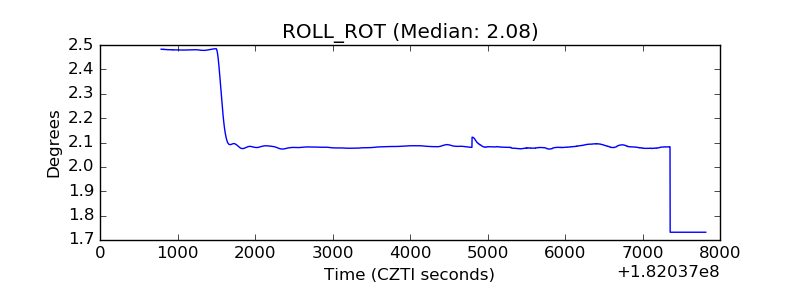 |
| _Roll_DEC | 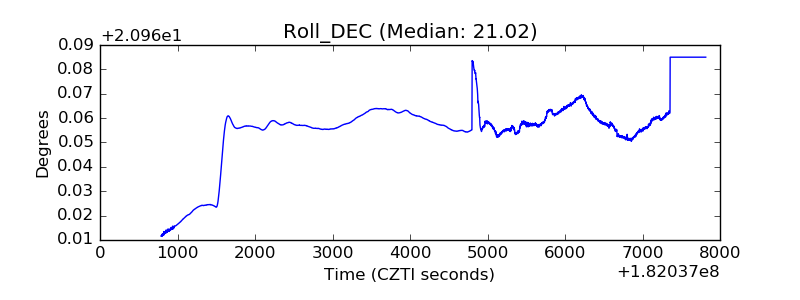 |
| _Roll_RA | 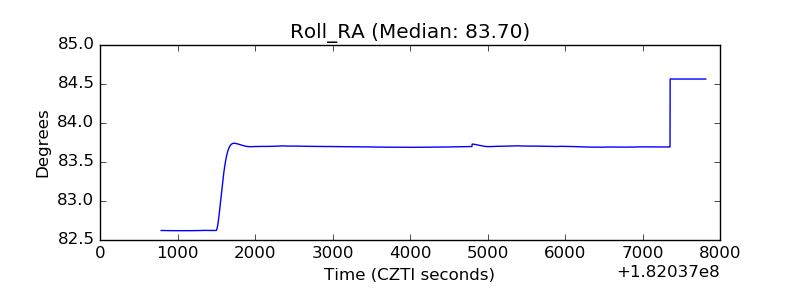 |
| Veto Counter |  |