| Param | Original file | Final file |
|---|---|---|
| Filename | modeM0/AS1P01_120T01_9000000006_00162cztM0_level2.evt | modeM0/AS1P01_120T01_9000000006_00162cztM0_level2_quad_clean.evt |
| Size (bytes) | 490,495,680 | 39,165,120 |
| Size | 467.8 MB | 37.4 MB |
| Events in quadrant A | 3,703,207 | 240,651 |
| Events in quadrant B | 3,940,678 | 241,658 |
| Events in quadrant C | 3,586,132 | 240,826 |
| Events in quadrant D | 3,409,809 | 235,508 |
| Mode SS | |||
|---|---|---|---|
| Quadrant | BADHDUFLAG | Total packets | Discarded packets |
| A | 0 | 86 | 14 |
| B | 0 | 86 | 12 |
| C | 0 | 87 | 17 |
| D | 0 | 89 | 17 |
| Mode M9 | |||
|---|---|---|---|
| Quadrant | BADHDUFLAG | Total packets | Discarded packets |
| A | 0 | 17 | 1 |
| B | 0 | 16 | 0 |
| C | 0 | 16 | 0 |
| D | 0 | 18 | 2 |
| Mode M0 | |||
|---|---|---|---|
| Quadrant | BADHDUFLAG | Total packets | Discarded packets |
| A | 0 | 17765 | 4512 |
| B | 0 | 18580 | 4621 |
| C | 0 | 17137 | 4219 |
| D | 0 | 16926 | 4511 |
| Quadrant | Total seconds | Saturated seconds | Saturation percentage |
|---|---|---|---|
| A | 3181 | 13 | 0.408677% |
| B | 3184 | 11 | 0.345477% |
| C | 3187 | 8 | 0.251020% |
| D | 3186 | 15 | 0.470810% |
Noise dominated data is calculated using 1-second bins in cleaned event files. If a bin has >2000 counts, and if more than 50% of those come from <1% of pixels, then it is considered to be noise-dominated and hence unusable.
| Quadrant | # 1 sec bins | Bins with >0 counts | Bins with >2000 counts | High rate bins dominated by noise | Noise dominated (total time) | Noise dominated (detector-on time) | Marked lightcurve |
|---|---|---|---|---|---|---|---|
| A | 6895 | 3232 | 100 | 100 | 1.45% | 3.09% | 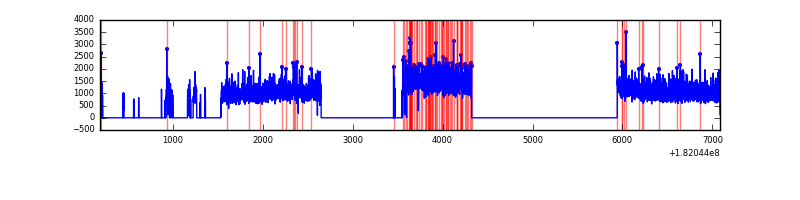 |
| B | 6894 | 3246 | 140 | 140 | 2.03% | 4.31% | 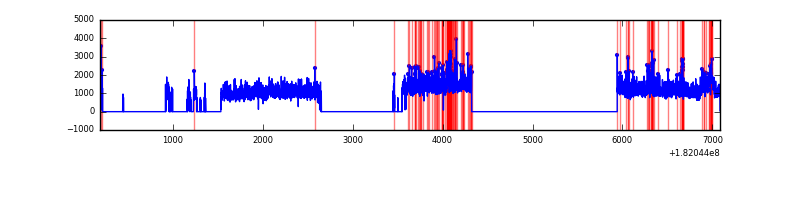 |
| C | 6894 | 3244 | 67 | 67 | 0.97% | 2.07% | 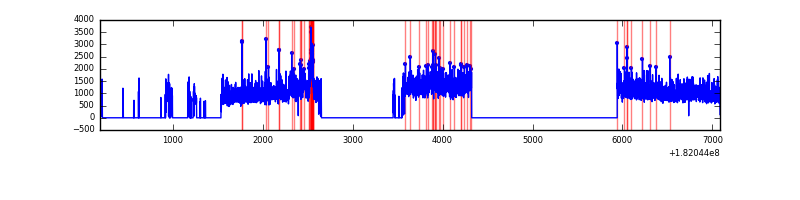 |
| D | 6896 | 3255 | 73 | 73 | 1.06% | 2.24% | 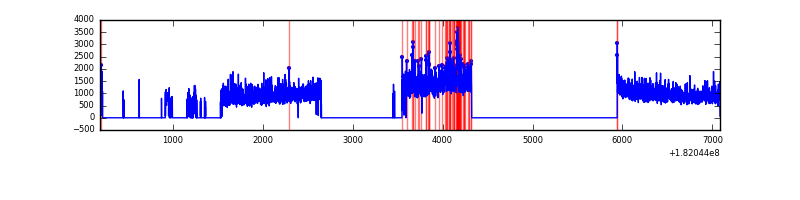 |
Top three noisy pixels from each quadrant. If the there are fewer than three noisy pixels in the level2.evt file, extra rows are filled as -1
| Pixel properties | Quadrant properties | ||||||
|---|---|---|---|---|---|---|---|
| Quadrant | DetID | PixID | Counts | Sigma | Mean | Median | Sigma |
| A | 0 | 86 | 33096 | 154.99 | 932 | 927 | 207.6 |
| A | 14 | 10 | 30802 | 143.94 | 932 | 927 | 207.6 |
| A | 13 | 17 | 9290 | 40.29 | 932 | 927 | 207.6 |
| B | 10 | 199 | 144326 | 642.74 | 942 | 950 | 223.1 |
| B | 5 | 216 | 79216 | 350.86 | 942 | 950 | 223.1 |
| B | 5 | 85 | 74014 | 327.54 | 942 | 950 | 223.1 |
| C | 1 | 1 | 193241 | 810.78 | 850 | 885 | 237.2 |
| C | 3 | 32 | 11340 | 44.07 | 850 | 885 | 237.2 |
| C | 0 | 188 | 10970 | 42.51 | 850 | 885 | 237.2 |
| D | 10 | 202 | 61796 | 236.79 | 836 | 864 | 257.3 |
| D | 13 | 223 | 50813 | 194.11 | 836 | 864 | 257.3 |
| D | 2 | 106 | 24353 | 91.28 | 836 | 864 | 257.3 |
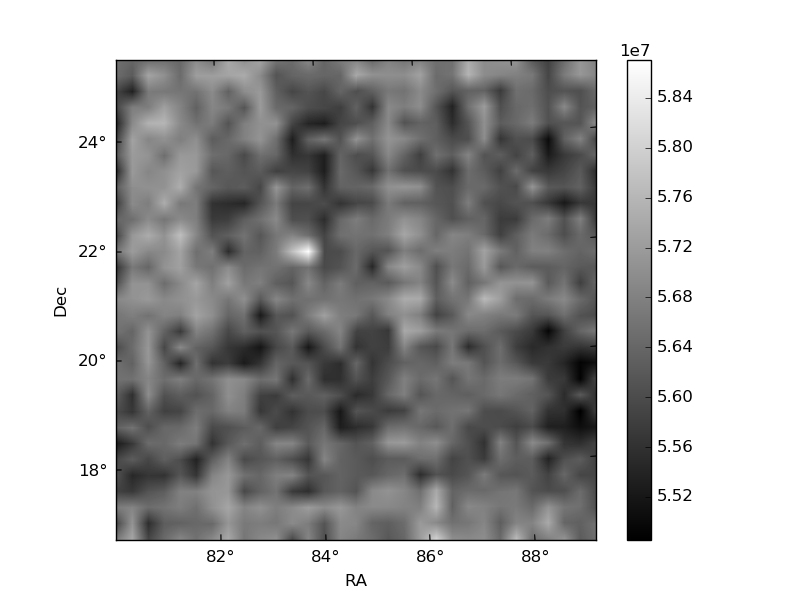
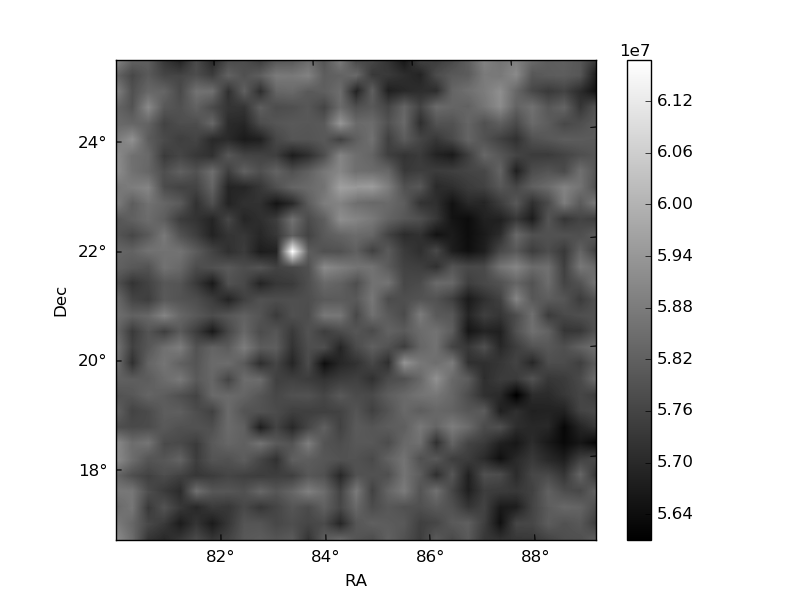
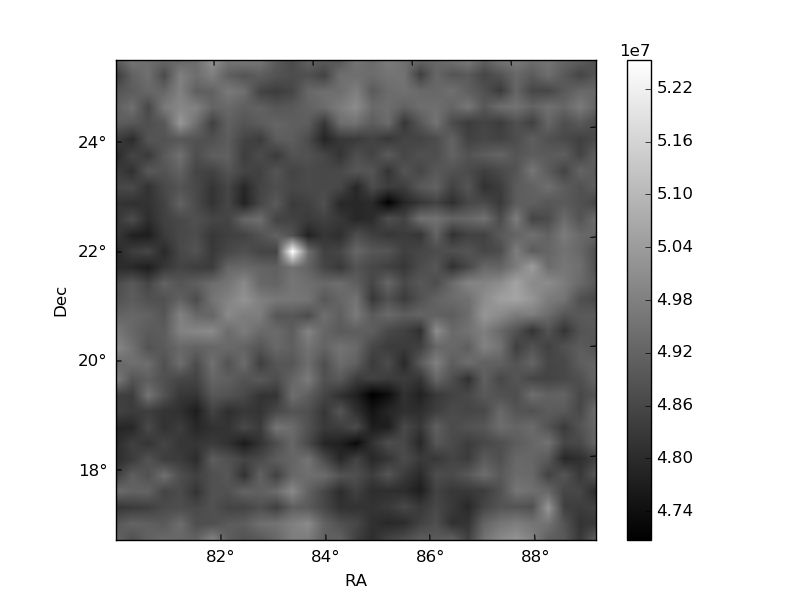
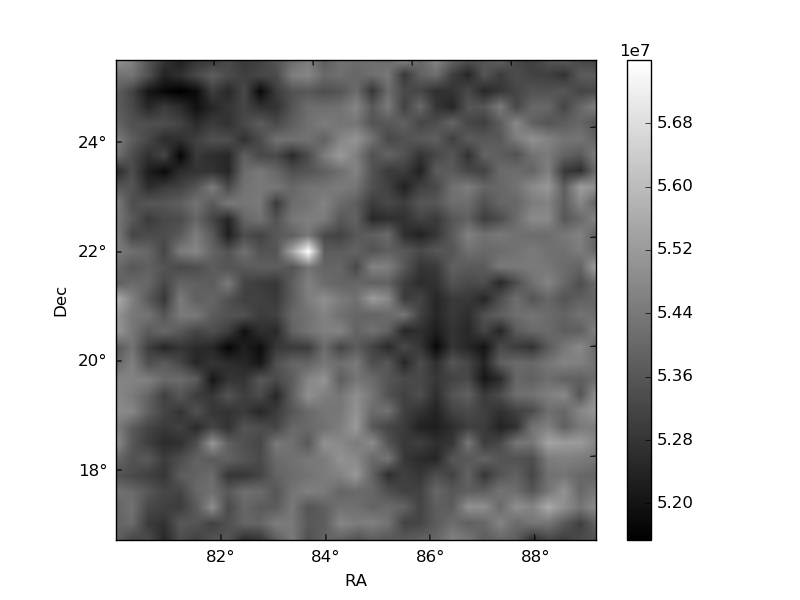
Histogram calculated using DETX and DETY for each event in the final _common_clean file
| Quadrant A | 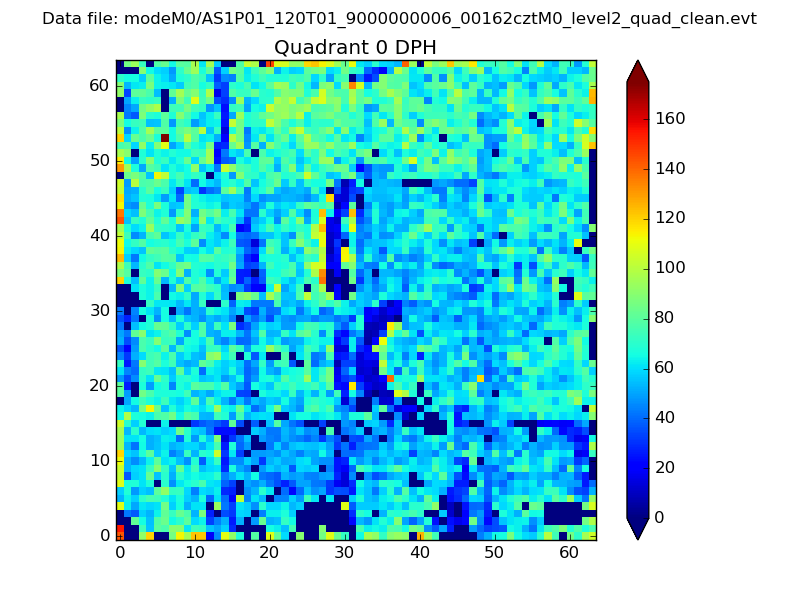 |
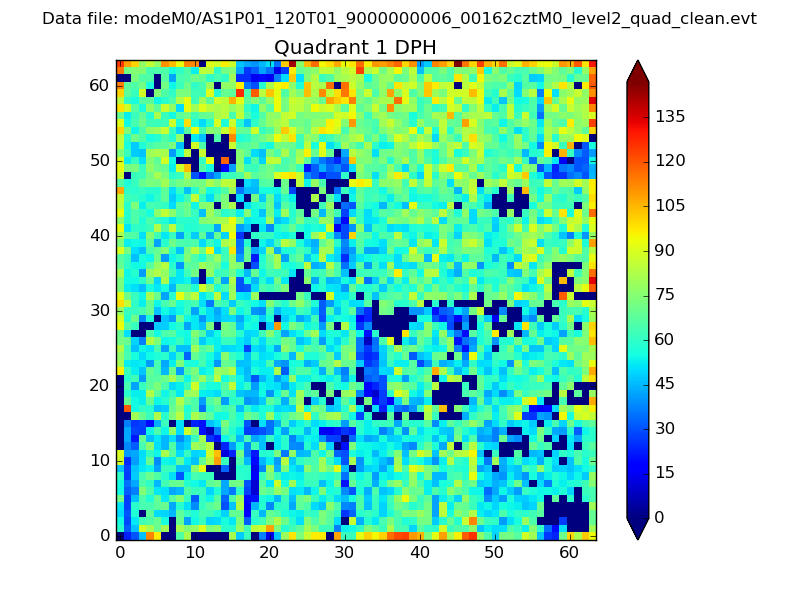 |
Quadrant B |
|---|---|---|---|
| Quadrant D | 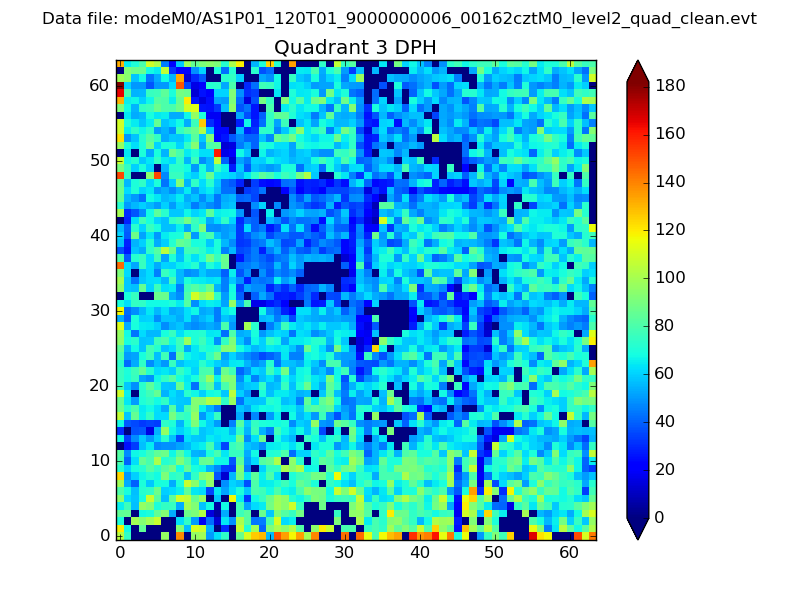 |
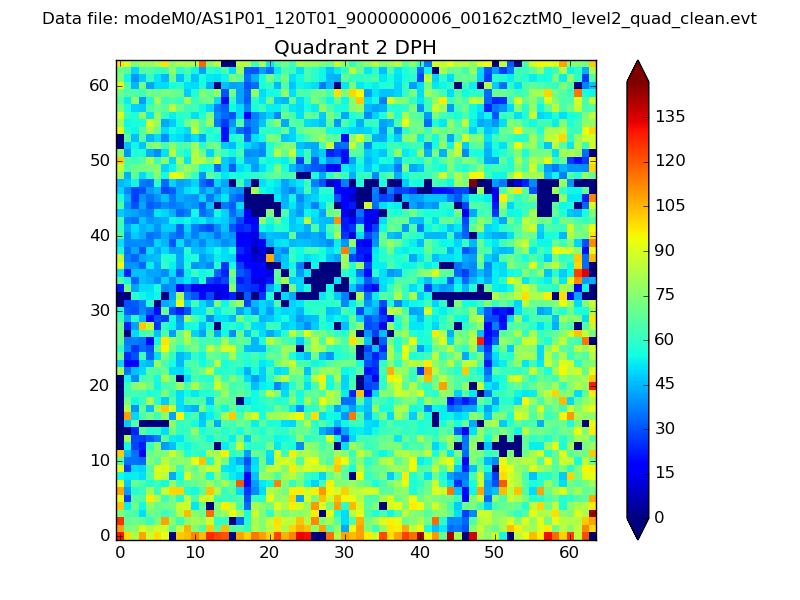 |
Quadrant C |
| Plot type | Count rate plots | Images |
|---|---|---|
| Comparison with Poisson distribution Blue bars denote a histogram of data divided into 1 sec bins. Red curve is a Poisson curve with rate = median count rate of data. |
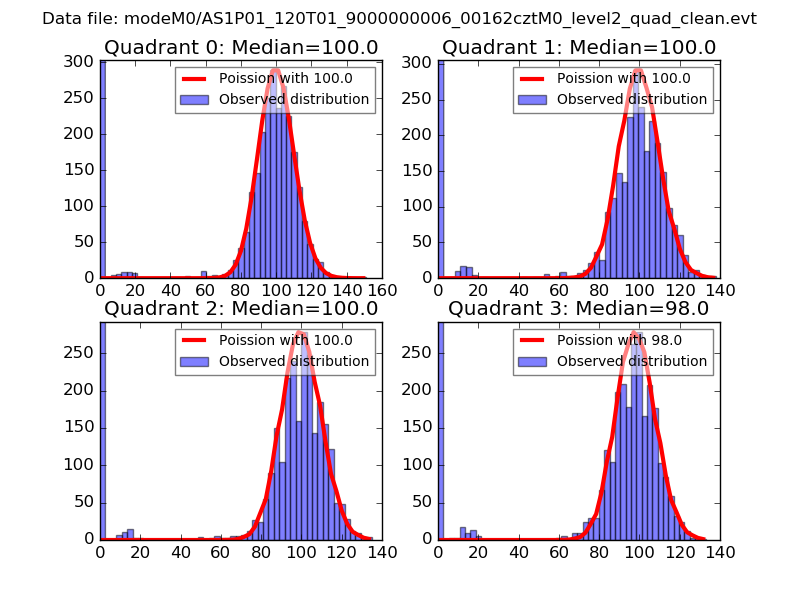 |
 |
| Quadrant-wise count rates Data is divided into 100 sec bins |
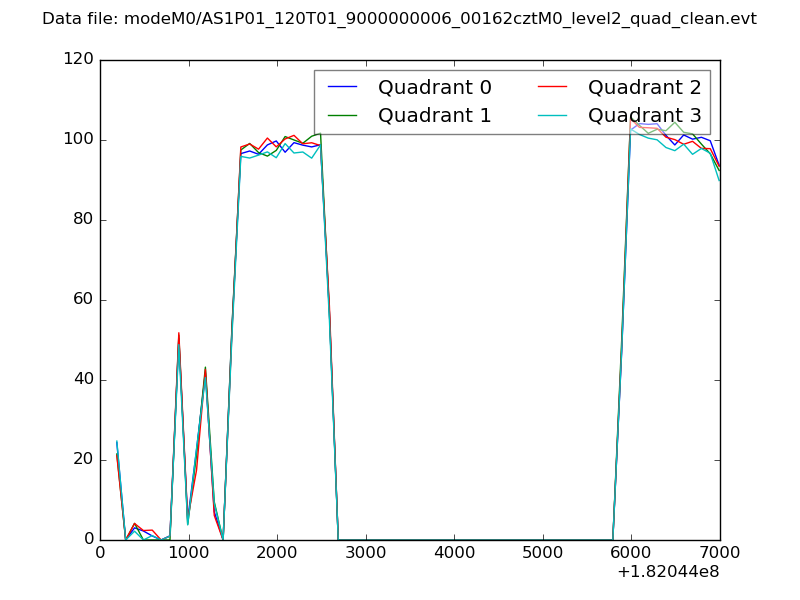 |
|
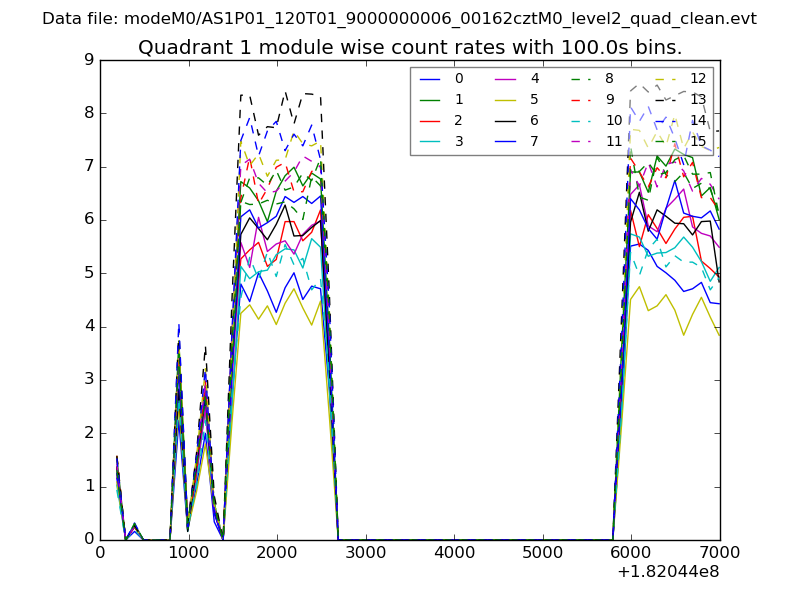
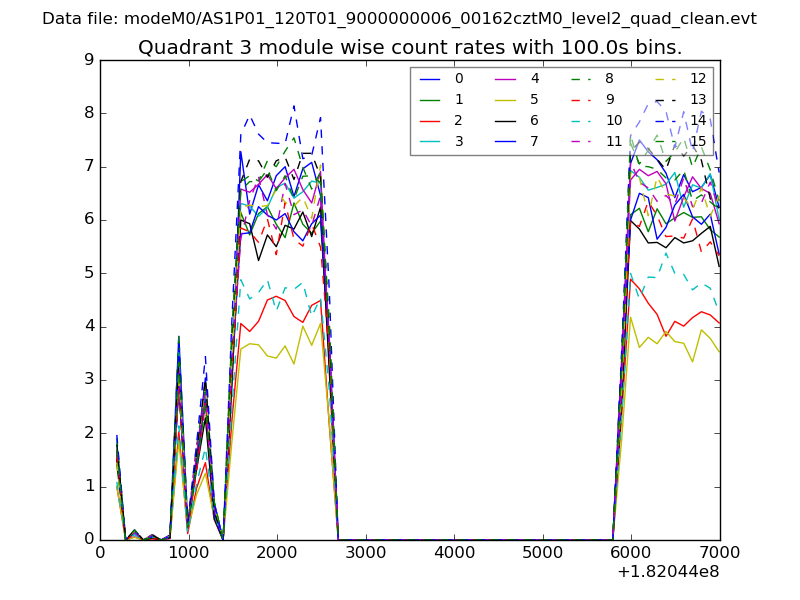
| Module-wise count rates for Quadrant A Data is divided into 100 sec bins |
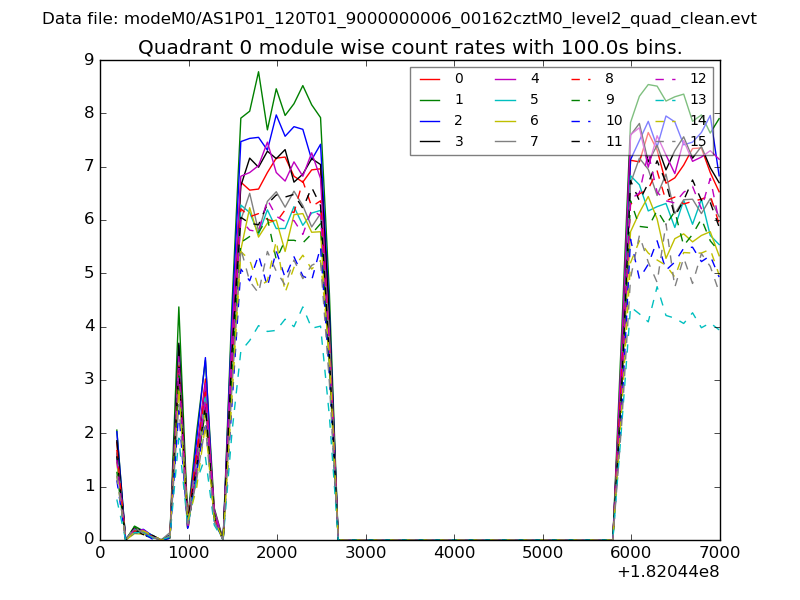 |
 |
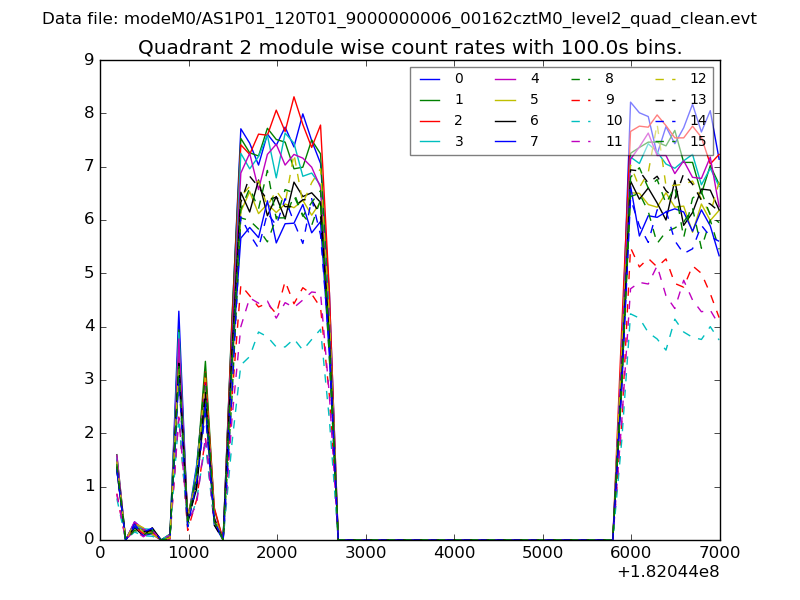
| Module-wise count rates for Quadrant B Data is divided into 100 sec bins |
 |
 |
| Module-wise count rates for Quadrant C Data is divided into 100 sec bins |
 |
 |
| Module-wise count rates for Quadrant D Data is divided into 100 sec bins |
 |
 |
| Parameter | Plot |
|---|---|
| CZT HV Monitor | 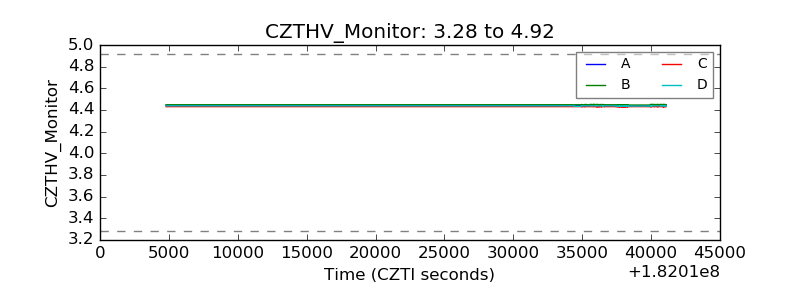 |
| D_VDD | 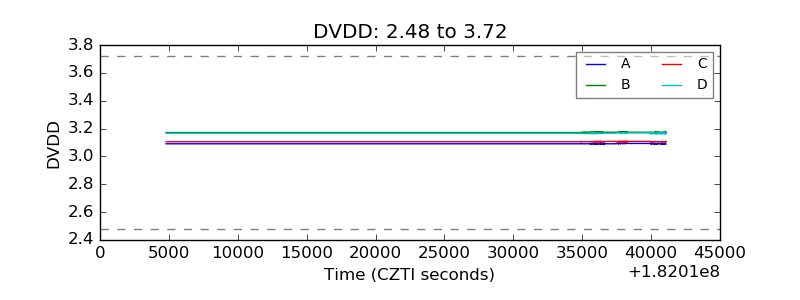 |
| Temperature 1 | 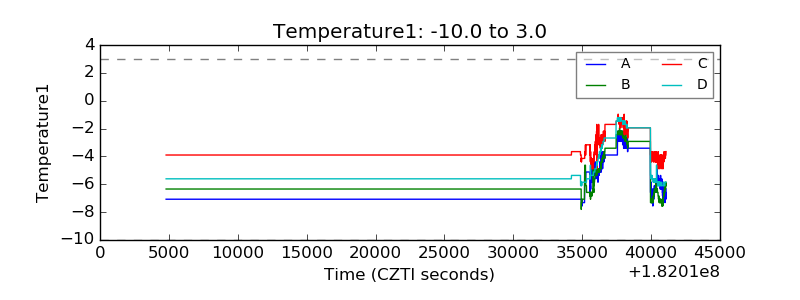 |
| Veto HV Monitor | 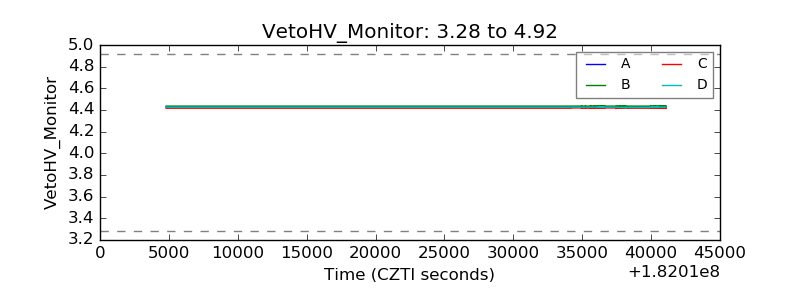 |
| Veto LLD | 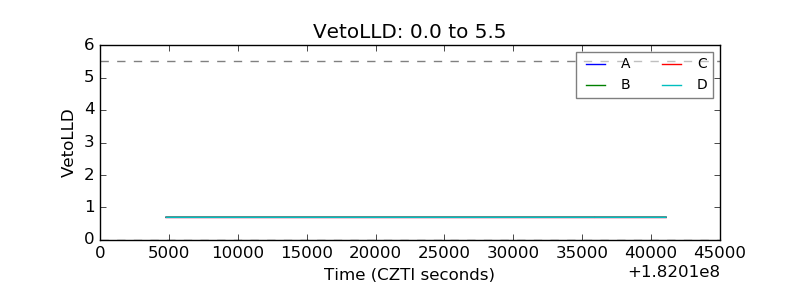 |
| Alpha Counter | 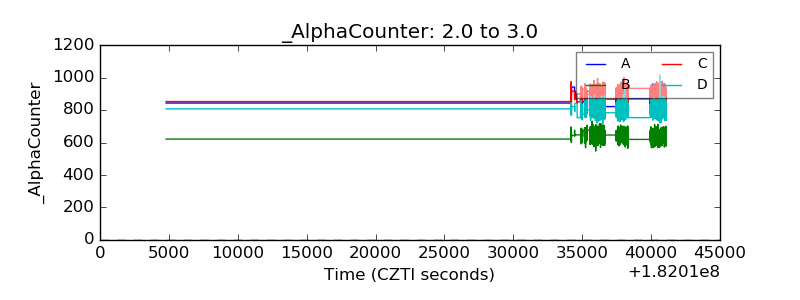 |
| _CPM_Rate | 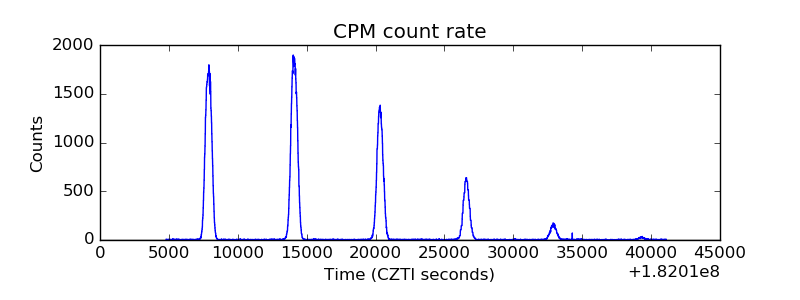 |
| CZT Counter | 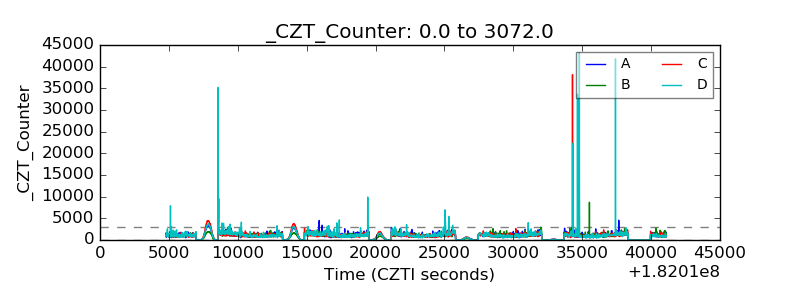 |
| +2.5 Volts monitor |  |
| +5 Volts monitor |  |
| _ROLL_ROT | 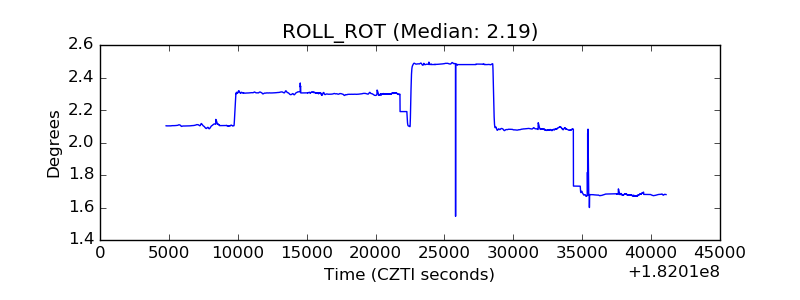 |
| _Roll_DEC | 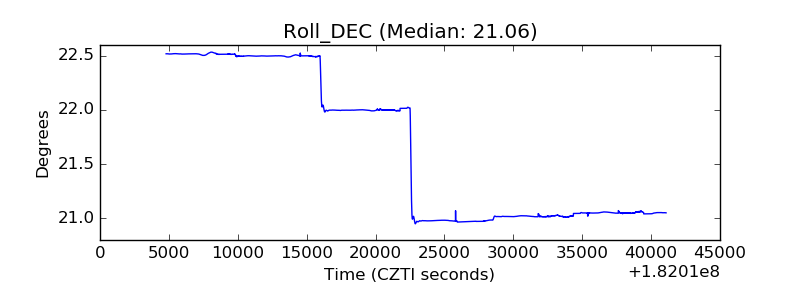 |
| _Roll_RA | 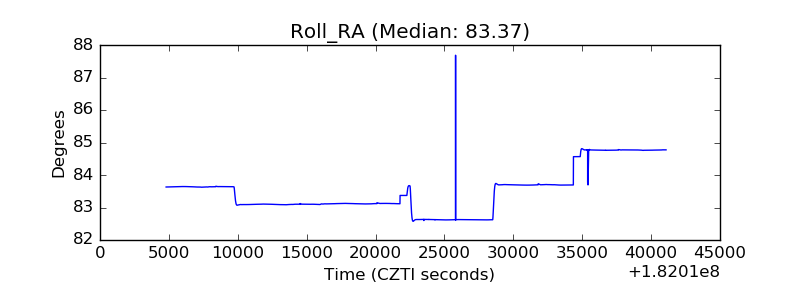 |
| Veto Counter | 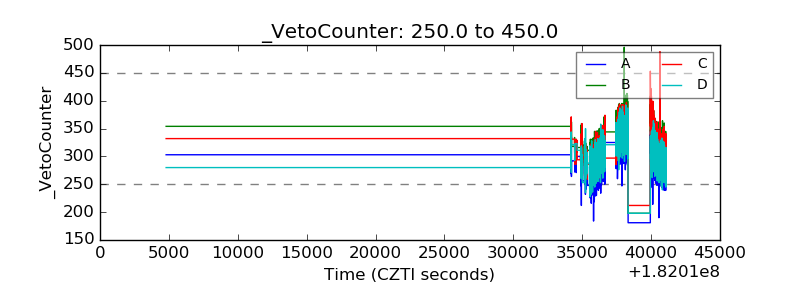 |