| Param | Original file | Final file |
|---|---|---|
| Filename | modeM0/AS1P01_120T01_9000000006_00164cztM0_level2.evt | modeM0/AS1P01_120T01_9000000006_00164cztM0_level2_quad_clean.evt |
| Size (bytes) | 530,712,000 | 8,634,240 |
| Size | 506.1 MB | 8.2 MB |
| Events in quadrant A | 3,928,811 | 7,592 |
| Events in quadrant B | 4,421,061 | 7,817 |
| Events in quadrant C | 3,680,399 | 7,792 |
| Events in quadrant D | 3,825,857 | 7,450 |
| Mode SS | |||
|---|---|---|---|
| Quadrant | BADHDUFLAG | Total packets | Discarded packets |
| A | 0 | 92 | 20 |
| B | 0 | 92 | 22 |
| C | 0 | 92 | 22 |
| D | 0 | 92 | 22 |
| Mode M9 | |||
|---|---|---|---|
| Quadrant | BADHDUFLAG | Total packets | Discarded packets |
| A | 0 | 16 | 0 |
| B | 0 | 16 | 0 |
| C | 0 | 16 | 0 |
| D | 0 | 16 | 0 |
| Mode M0 | |||
|---|---|---|---|
| Quadrant | BADHDUFLAG | Total packets | Discarded packets |
| A | 0 | 19691 | 5794 |
| B | 0 | 20862 | 5427 |
| C | 0 | 17976 | 4696 |
| D | 0 | 19070 | 5441 |
| Quadrant | Total seconds | Saturated seconds | Saturation percentage |
|---|---|---|---|
| A | 3182 | 10 | 0.314268% |
| B | 3215 | 165 | 5.132193% |
| C | 3280 | 2 | 0.060976% |
| D | 3200 | 12 | 0.375000% |
Noise dominated data is calculated using 1-second bins in cleaned event files. If a bin has >2000 counts, and if more than 50% of those come from <1% of pixels, then it is considered to be noise-dominated and hence unusable.
| Quadrant | # 1 sec bins | Bins with >0 counts | Bins with >2000 counts | High rate bins dominated by noise | Noise dominated (total time) | Noise dominated (detector-on time) | Marked lightcurve |
|---|---|---|---|---|---|---|---|
| A | 5956 | 3445 | 91 | 91 | 1.53% | 2.64% | 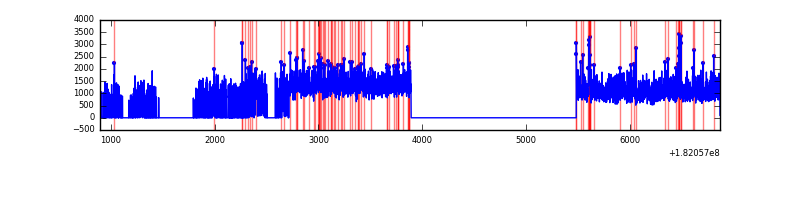 |
| B | 5969 | 3482 | 334 | 334 | 5.60% | 9.59% | 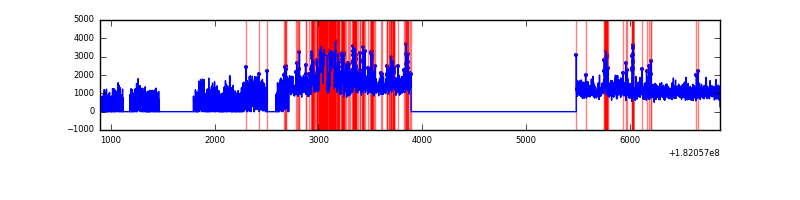 |
| C | 5968 | 3566 | 46 | 46 | 0.77% | 1.29% | 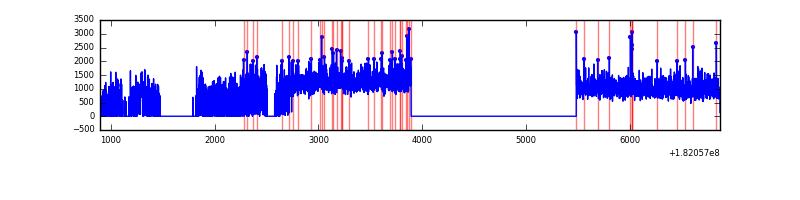 |
| D | 5970 | 3474 | 88 | 88 | 1.47% | 2.53% | 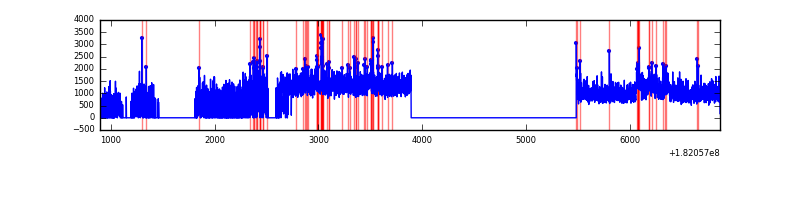 |
Top three noisy pixels from each quadrant. If the there are fewer than three noisy pixels in the level2.evt file, extra rows are filled as -1
| Pixel properties | Quadrant properties | ||||||
|---|---|---|---|---|---|---|---|
| Quadrant | DetID | PixID | Counts | Sigma | Mean | Median | Sigma |
| A | 14 | 10 | 82888 | 375.24 | 979 | 972 | 218.3 |
| A | 0 | 86 | 21728 | 95.08 | 979 | 972 | 218.3 |
| A | 12 | 244 | 12402 | 52.36 | 979 | 972 | 218.3 |
| B | 5 | 85 | 285081 | 1263.72 | 956 | 961 | 224.8 |
| B | 5 | 216 | 218654 | 968.27 | 956 | 961 | 224.8 |
| B | 10 | 199 | 200508 | 887.56 | 956 | 961 | 224.8 |
| C | 0 | 188 | 17585 | 63.94 | 920 | 953 | 260.1 |
| C | 0 | 202 | 11212 | 39.44 | 920 | 953 | 260.1 |
| C | 8 | 31 | 9045 | 31.11 | 920 | 953 | 260.1 |
| D | 7 | 68 | 152736 | 557.23 | 892 | 925 | 272.4 |
| D | 14 | 53 | 48736 | 175.49 | 892 | 925 | 272.4 |
| D | 13 | 28 | 30714 | 109.34 | 892 | 925 | 272.4 |
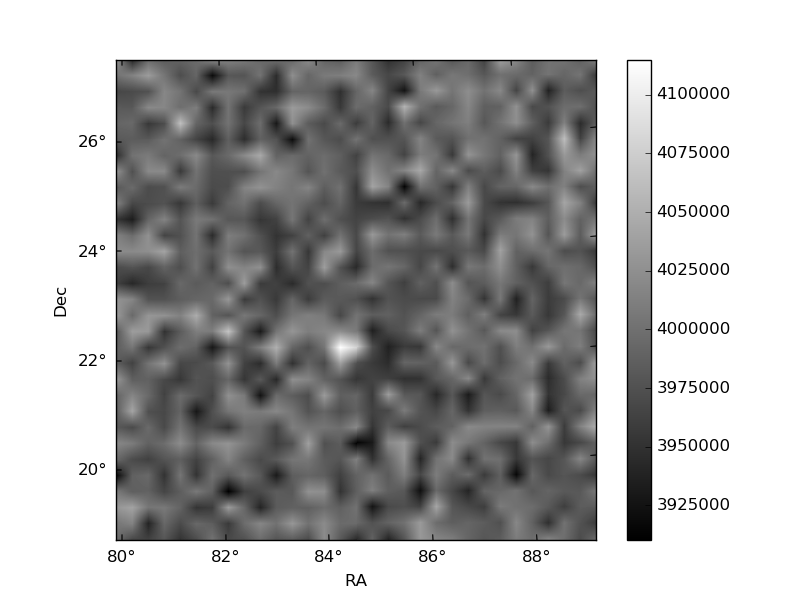
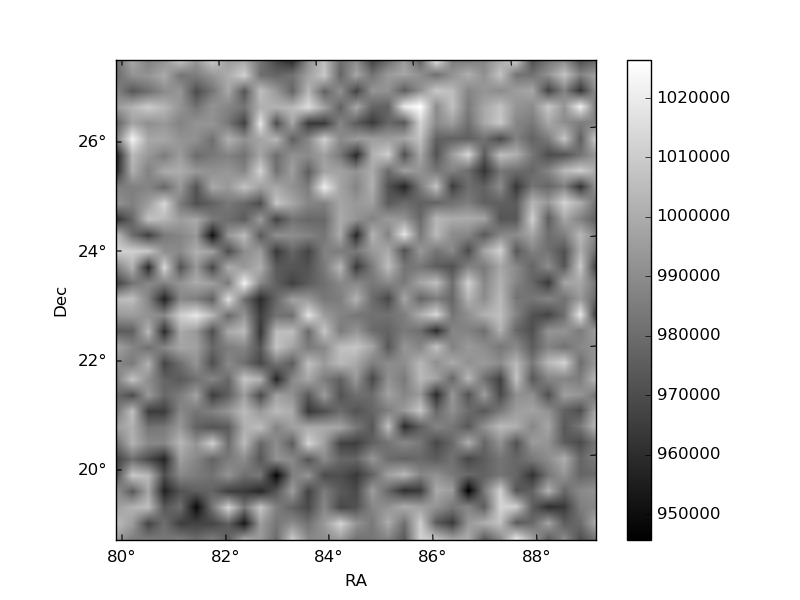
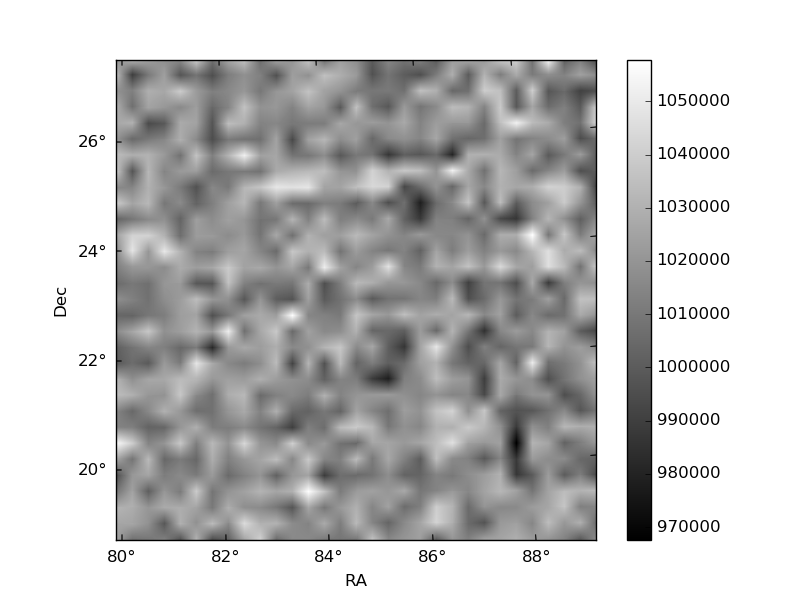
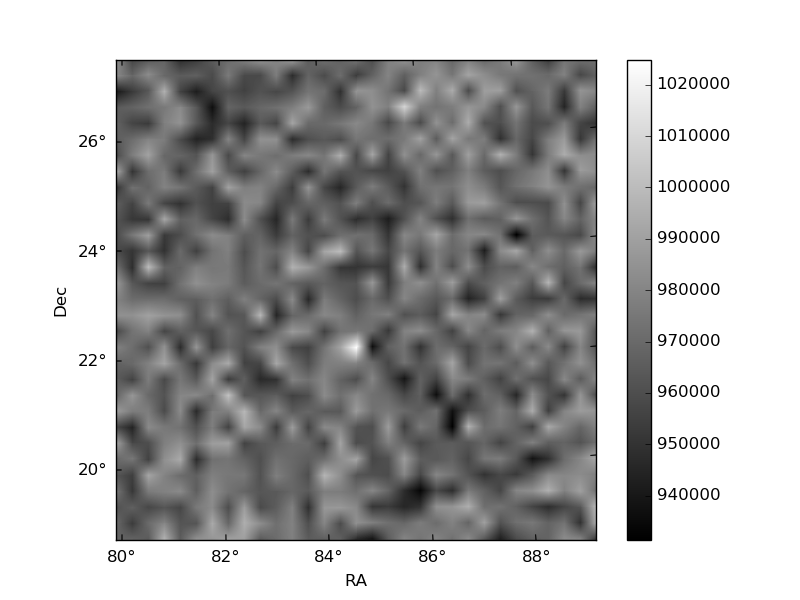
Histogram calculated using DETX and DETY for each event in the final _common_clean file
| Quadrant A | 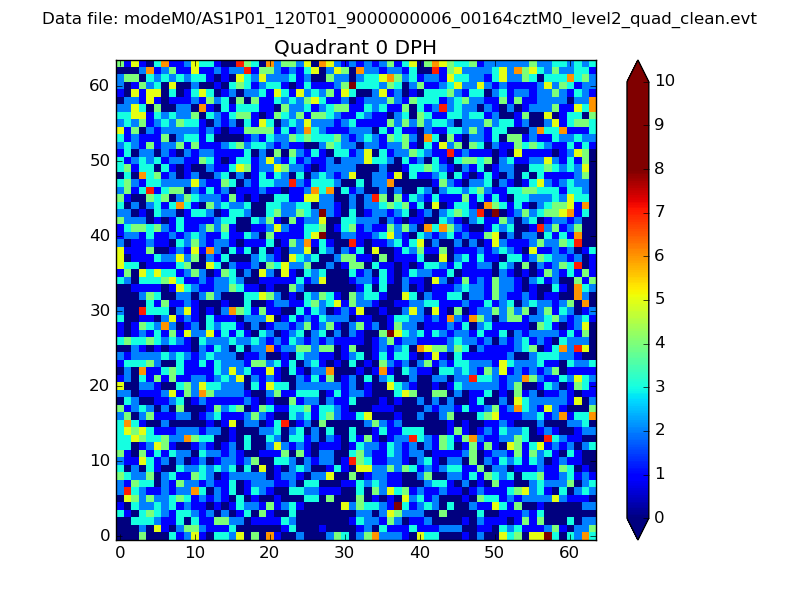 |
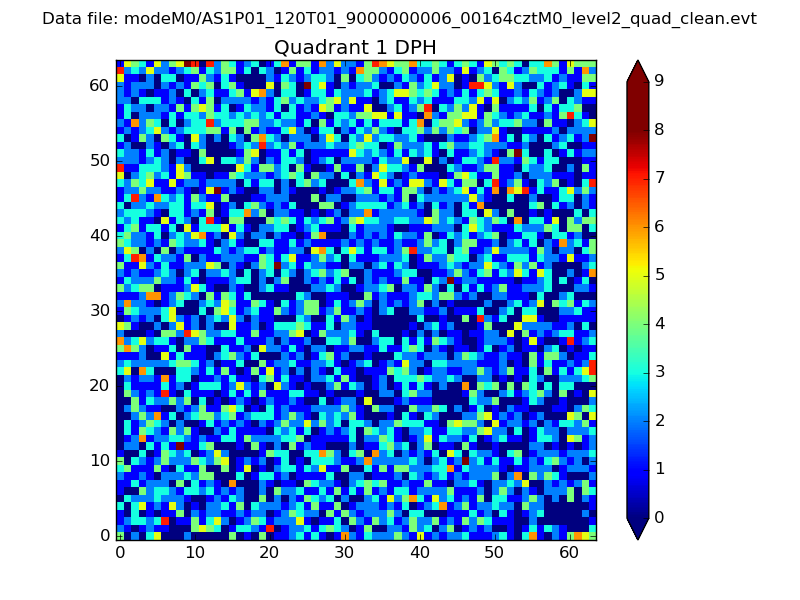 |
Quadrant B |
|---|---|---|---|
| Quadrant D | 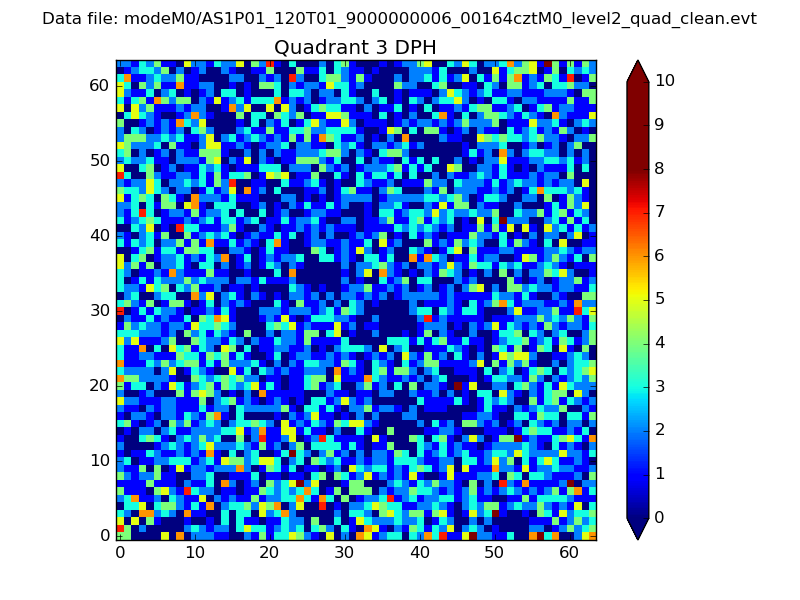 |
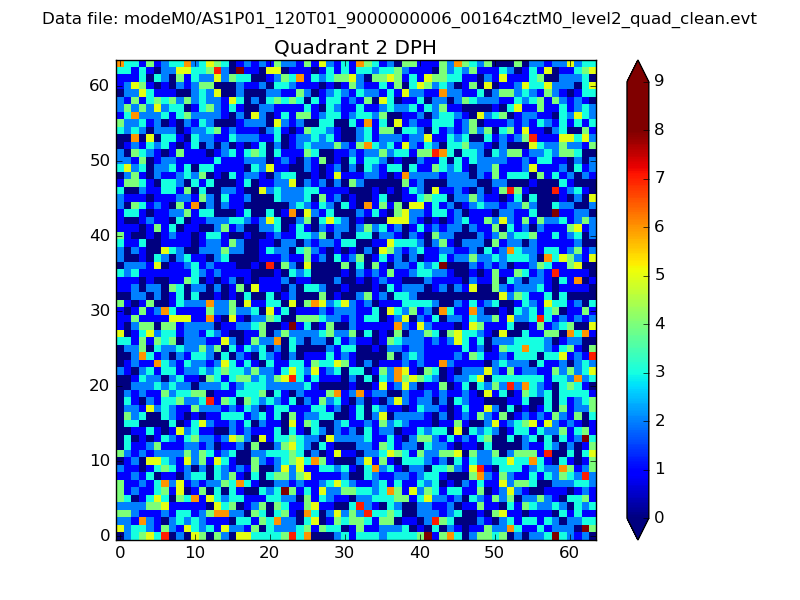 |
Quadrant C |
| Plot type | Count rate plots | Images |
|---|---|---|
| Comparison with Poisson distribution Blue bars denote a histogram of data divided into 1 sec bins. Red curve is a Poisson curve with rate = median count rate of data. |
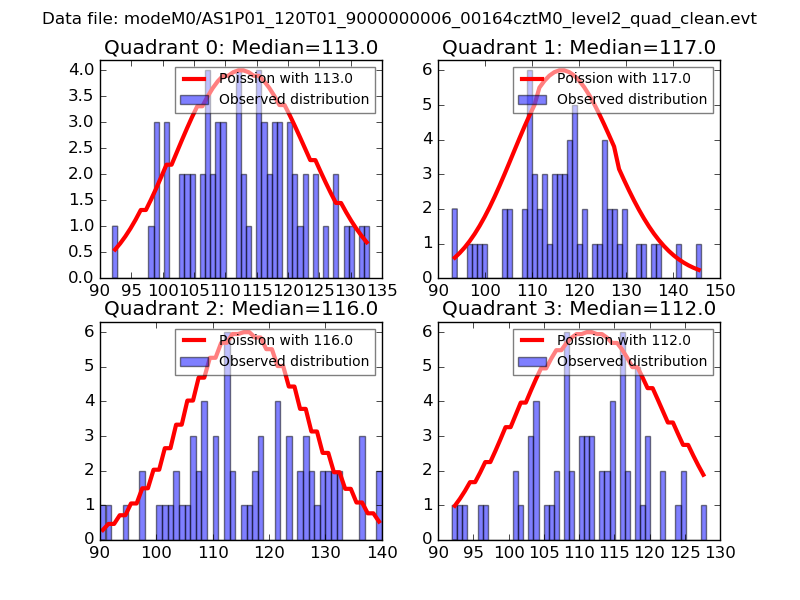 |
 |
| Quadrant-wise count rates Data is divided into 100 sec bins |
 |
|
| Module-wise count rates for Quadrant A Data is divided into 100 sec bins |
 |
 |
| Module-wise count rates for Quadrant B Data is divided into 100 sec bins |
 |
 |
| Module-wise count rates for Quadrant C Data is divided into 100 sec bins |
 |
 |
| Module-wise count rates for Quadrant D Data is divided into 100 sec bins |
 |
 |
| Parameter | Plot |
|---|---|
| CZT HV Monitor | 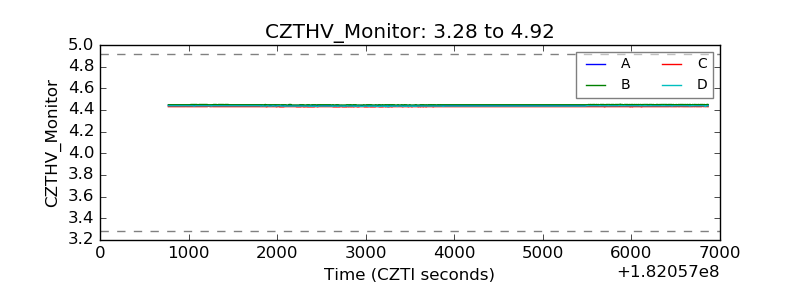 |
| D_VDD | 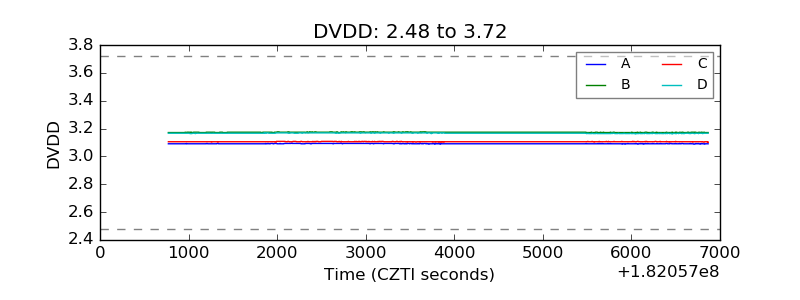 |
| Temperature 1 | 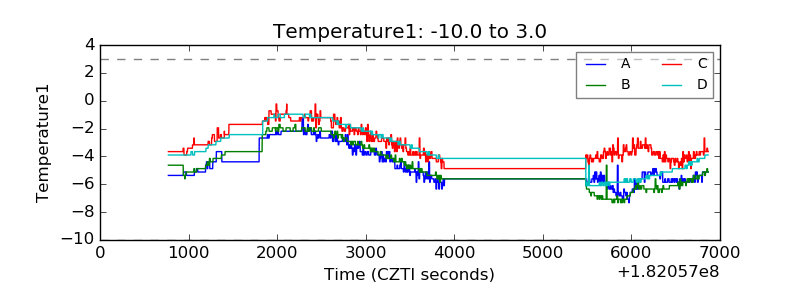 |
| Veto HV Monitor | 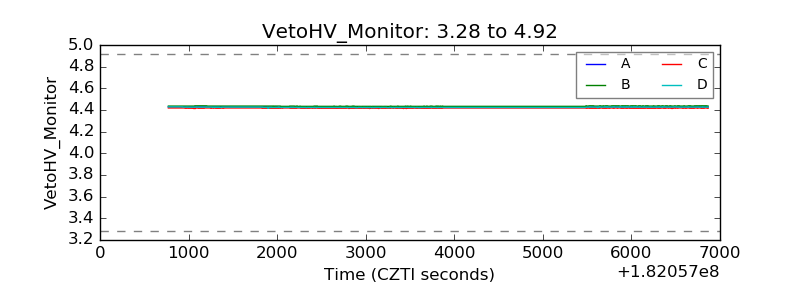 |
| Veto LLD |  |
| Alpha Counter | 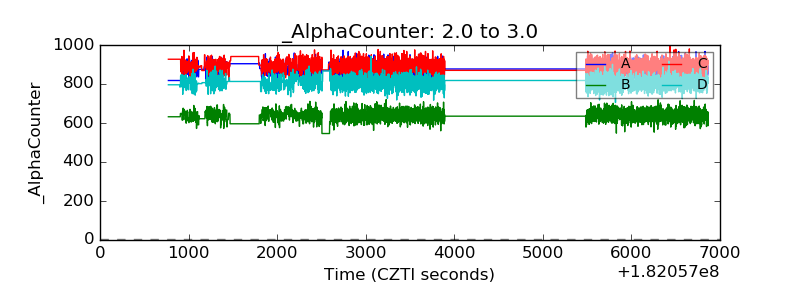 |
| _CPM_Rate | 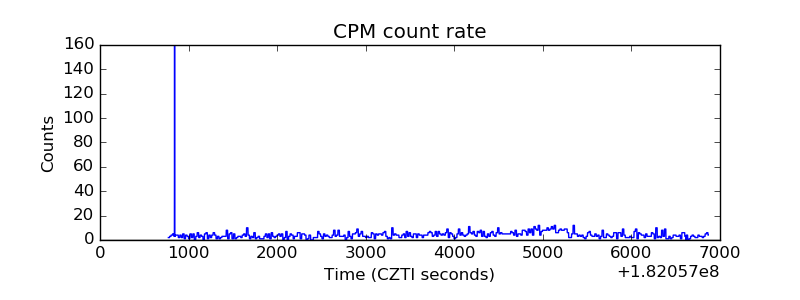 |
| CZT Counter | 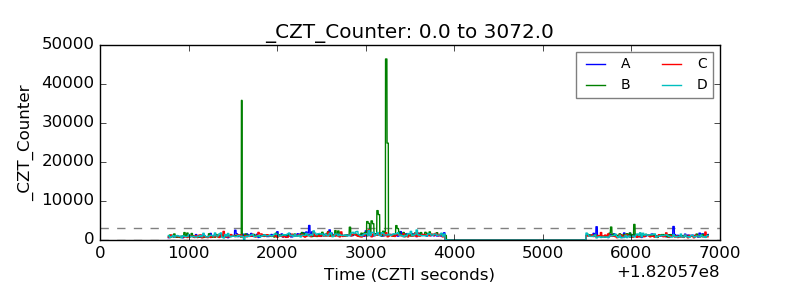 |
| +2.5 Volts monitor |  |
| +5 Volts monitor |  |
| _ROLL_ROT | 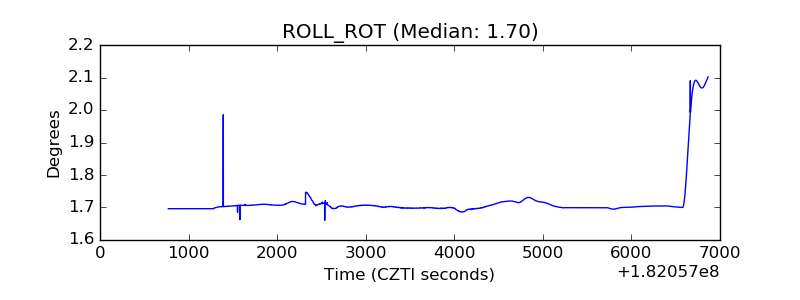 |
| _Roll_DEC | 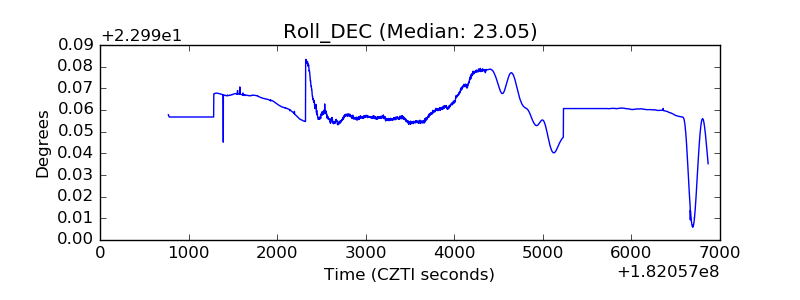 |
| _Roll_RA | 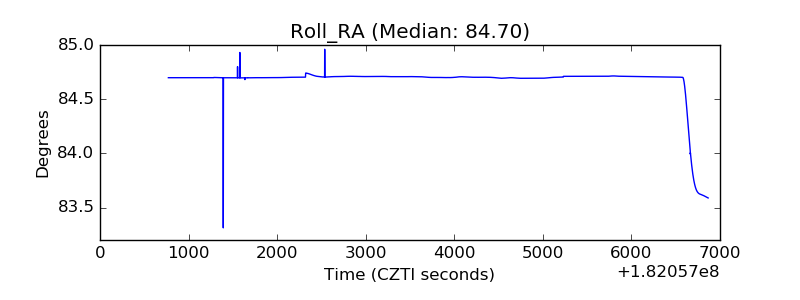 |
| Veto Counter | 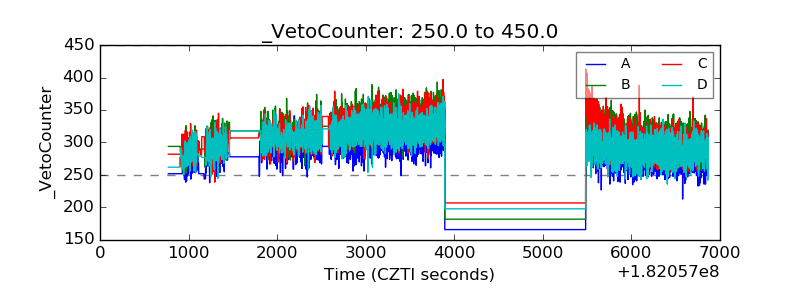 |