| Param | Original file | Final file |
|---|---|---|
| Filename | modeM0/AS1P01_120T01_9000000006_00165cztM0_level2.evt | modeM0/AS1P01_120T01_9000000006_00165cztM0_level2_quad_clean.evt |
| Size (bytes) | 895,089,600 | 44,064,000 |
| Size | 853.6 MB | 42.0 MB |
| Events in quadrant A | 6,739,183 | 235,431 |
| Events in quadrant B | 6,892,856 | 242,055 |
| Events in quadrant C | 6,105,975 | 242,364 |
| Events in quadrant D | 7,001,401 | 225,625 |
| Mode SS | |||
|---|---|---|---|
| Quadrant | BADHDUFLAG | Total packets | Discarded packets |
| A | 0 | 120 | 6 |
| B | 0 | 120 | 6 |
| C | 0 | 120 | 6 |
| D | 0 | 120 | 4 |
| Mode M9 | |||
|---|---|---|---|
| Quadrant | BADHDUFLAG | Total packets | Discarded packets |
| A | 0 | 15 | 0 |
| B | 0 | 15 | 0 |
| C | 0 | 15 | 0 |
| D | 0 | 15 | 0 |
| Mode M0 | |||
|---|---|---|---|
| Quadrant | BADHDUFLAG | Total packets | Discarded packets |
| A | 0 | 24941 | 997 |
| B | 0 | 25291 | 898 |
| C | 0 | 22948 | 867 |
| D | 0 | 25599 | 831 |
| Quadrant | Total seconds | Saturated seconds | Saturation percentage |
|---|---|---|---|
| A | 5535 | 12 | 0.216802% |
| B | 5541 | 23 | 0.415088% |
| C | 5535 | 4 | 0.072267% |
| D | 5554 | 218 | 3.925099% |
Noise dominated data is calculated using 1-second bins in cleaned event files. If a bin has >2000 counts, and if more than 50% of those come from <1% of pixels, then it is considered to be noise-dominated and hence unusable.
| Quadrant | # 1 sec bins | Bins with >0 counts | Bins with >2000 counts | High rate bins dominated by noise | Noise dominated (total time) | Noise dominated (detector-on time) | Marked lightcurve |
|---|---|---|---|---|---|---|---|
| A | 7366 | 5589 | 137 | 137 | 1.86% | 2.45% | 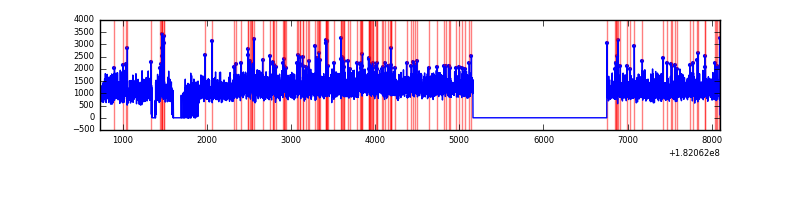 |
| B | 7366 | 5585 | 167 | 167 | 2.27% | 2.99% | 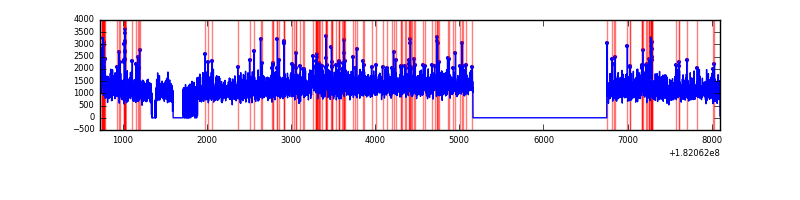 |
| C | 7366 | 5580 | 53 | 53 | 0.72% | 0.95% | 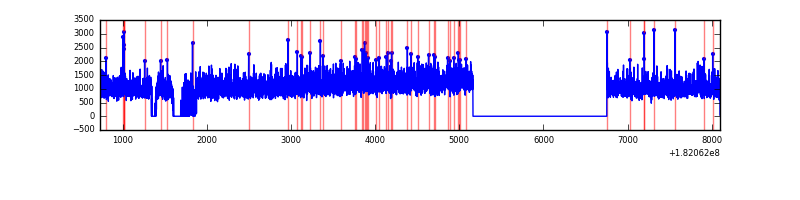 |
| D | 7366 | 5596 | 429 | 429 | 5.82% | 7.67% | 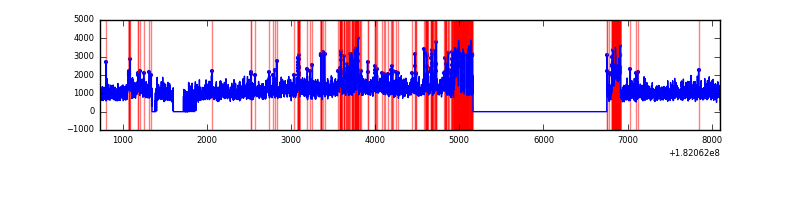 |
Top three noisy pixels from each quadrant. If the there are fewer than three noisy pixels in the level2.evt file, extra rows are filled as -1
| Pixel properties | Quadrant properties | ||||||
|---|---|---|---|---|---|---|---|
| Quadrant | DetID | PixID | Counts | Sigma | Mean | Median | Sigma |
| A | 12 | 244 | 60499 | 158.68 | 1692 | 1677 | 370.7 |
| A | 14 | 10 | 56487 | 147.85 | 1692 | 1677 | 370.7 |
| A | 13 | 17 | 29617 | 75.37 | 1692 | 1677 | 370.7 |
| B | 10 | 199 | 326234 | 821.14 | 1670 | 1684 | 395.2 |
| B | 5 | 216 | 83525 | 207.06 | 1670 | 1684 | 395.2 |
| B | 8 | 233 | 17562 | 40.17 | 1670 | 1684 | 395.2 |
| C | 8 | 31 | 28327 | 62.54 | 1516 | 1570 | 427.8 |
| C | 0 | 188 | 26999 | 59.44 | 1516 | 1570 | 427.8 |
| C | 0 | 202 | 23340 | 50.88 | 1516 | 1570 | 427.8 |
| D | 13 | 71 | 628811 | 1353.59 | 1503 | 1556 | 463.4 |
| D | 13 | 28 | 141908 | 302.87 | 1503 | 1556 | 463.4 |
| D | 7 | 68 | 125425 | 267.3 | 1503 | 1556 | 463.4 |
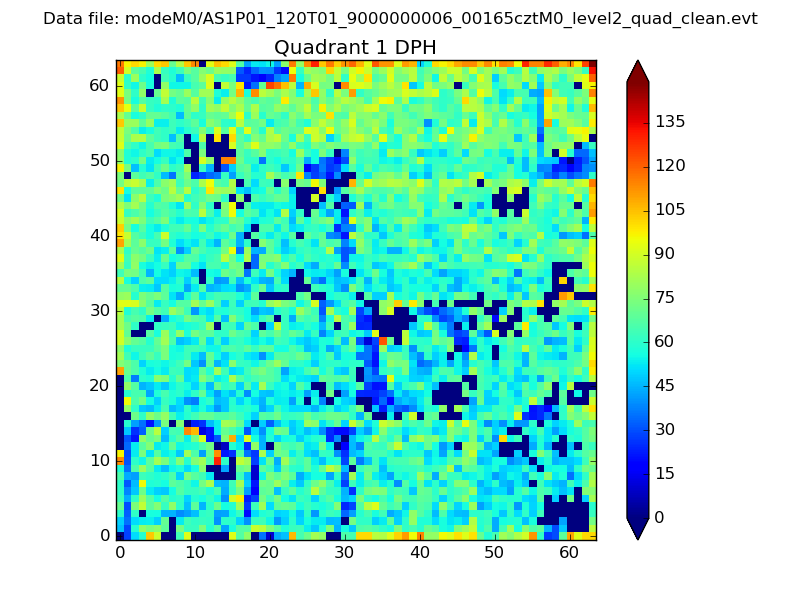
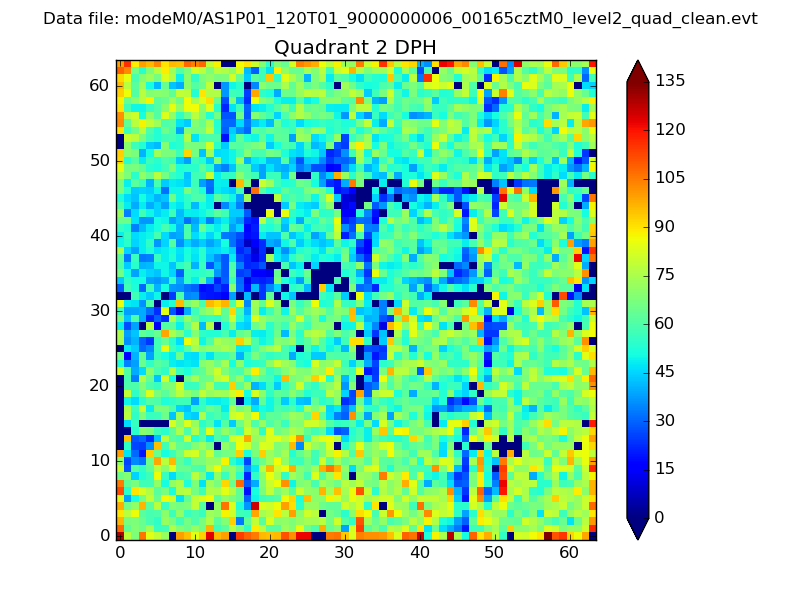
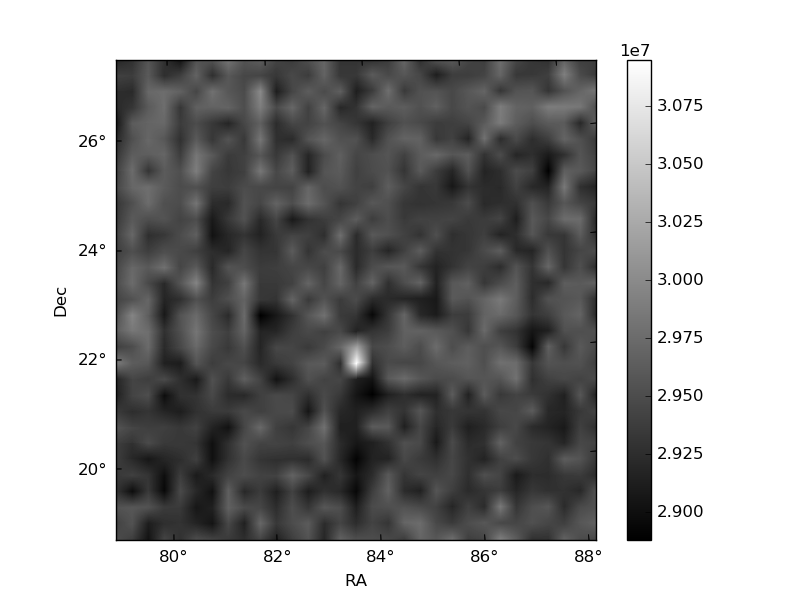
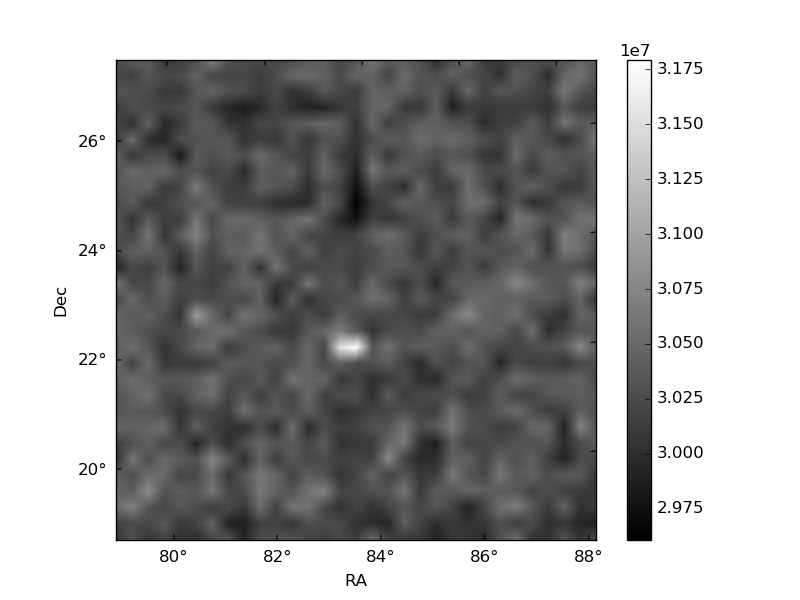
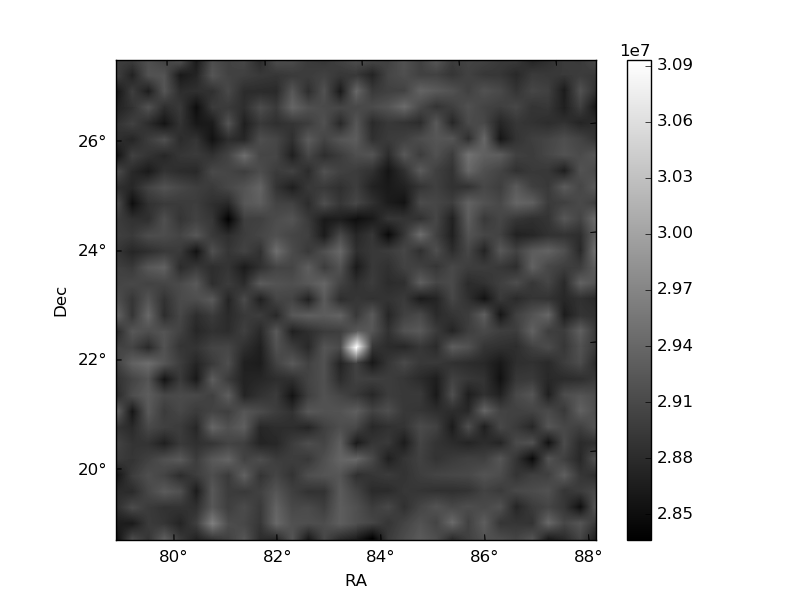
Histogram calculated using DETX and DETY for each event in the final _common_clean file
| Quadrant A |  |
 |
Quadrant B |
|---|---|---|---|
| Quadrant D | 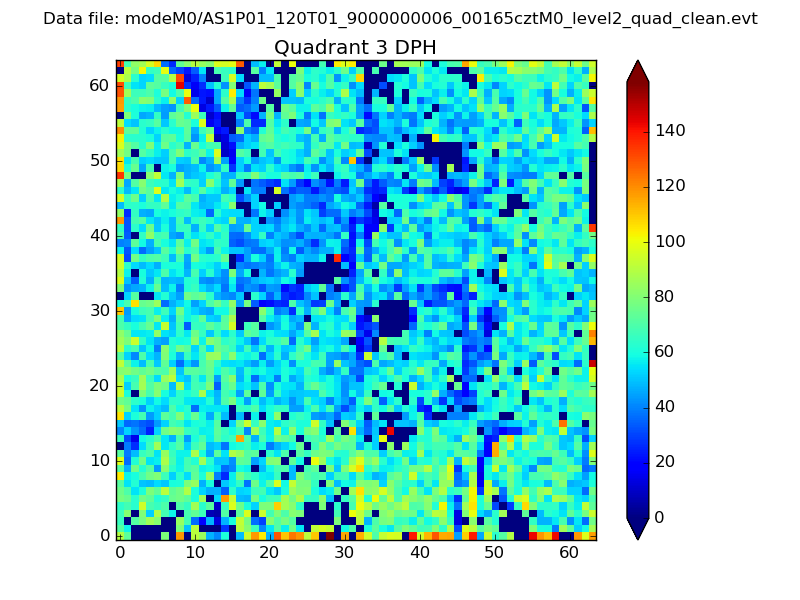 |
 |
Quadrant C |
| Plot type | Count rate plots | Images |
|---|---|---|
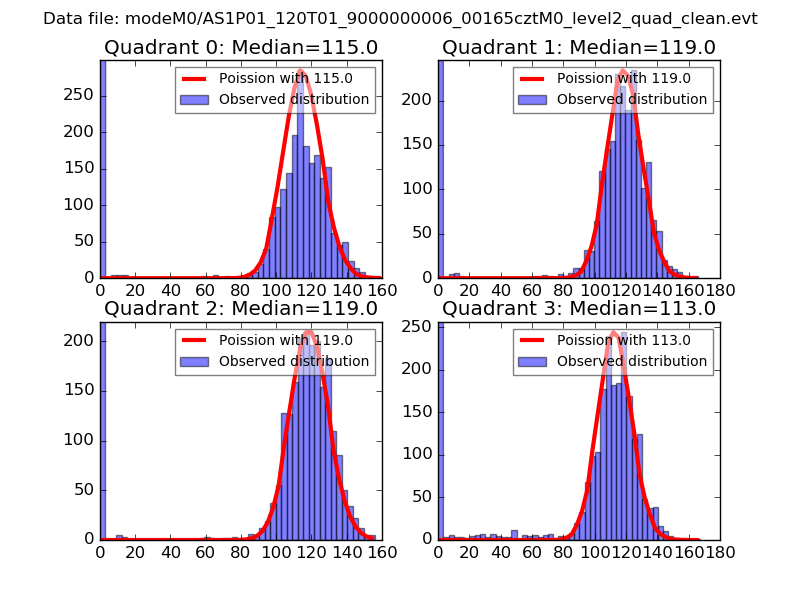
| Comparison with Poisson distribution Blue bars denote a histogram of data divided into 1 sec bins. Red curve is a Poisson curve with rate = median count rate of data. |
 |
 |
| Quadrant-wise count rates Data is divided into 100 sec bins |
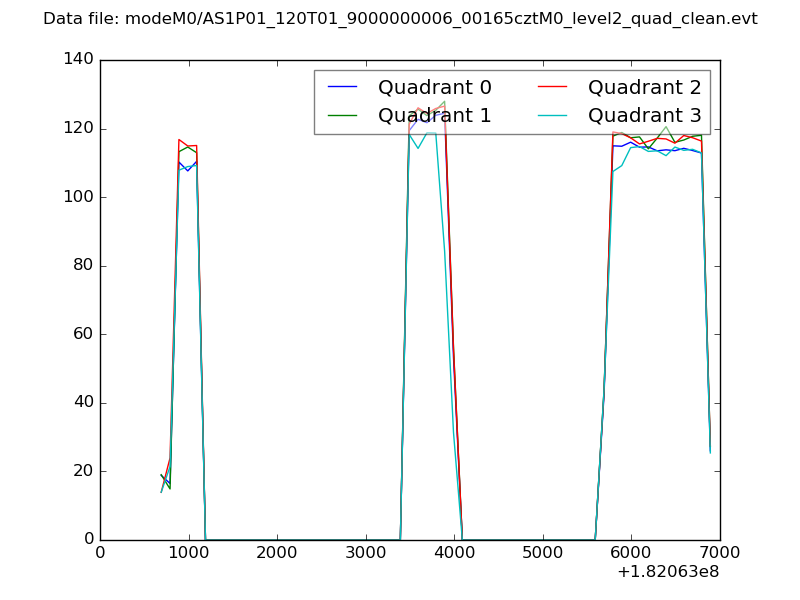 |
|
| Module-wise count rates for Quadrant A Data is divided into 100 sec bins |
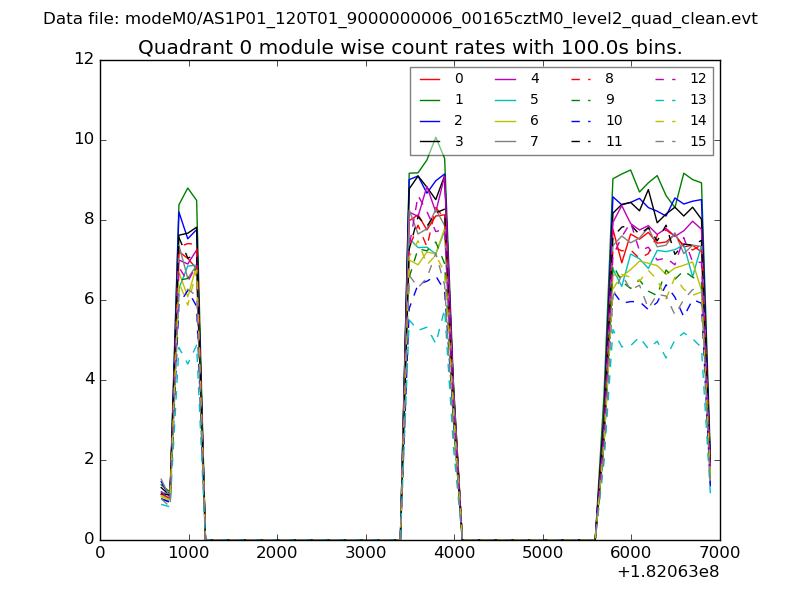 |
 |
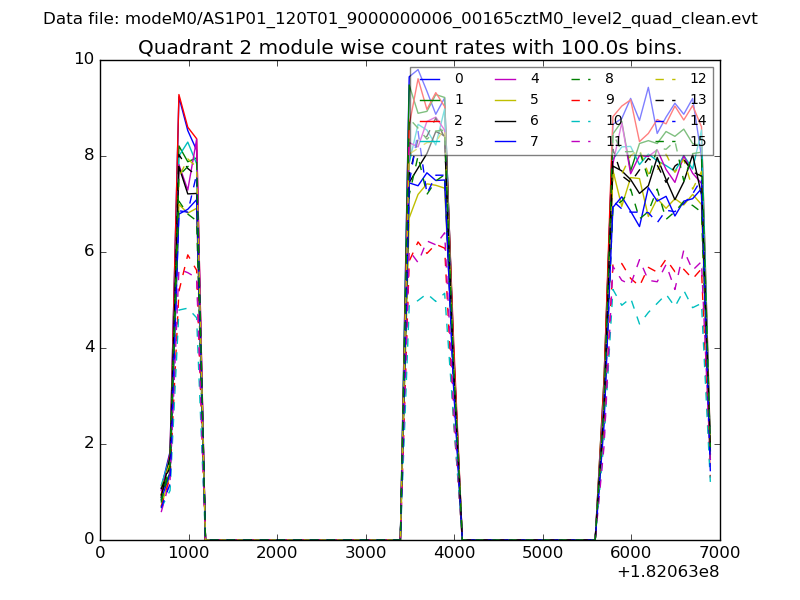
| Module-wise count rates for Quadrant B Data is divided into 100 sec bins |
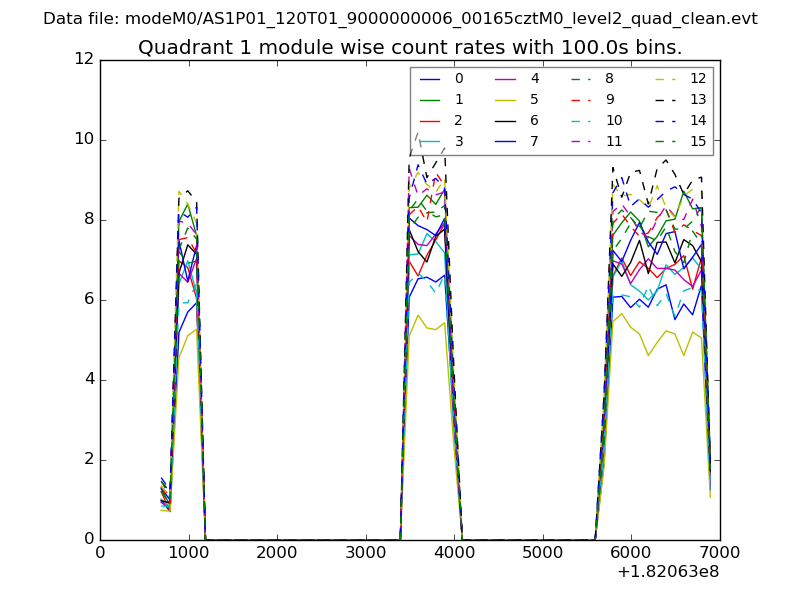 |
 |
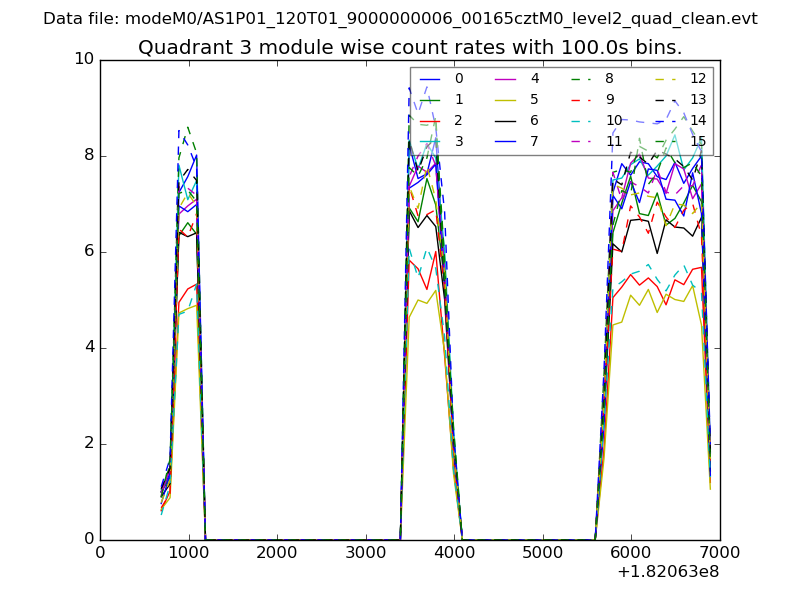
| Module-wise count rates for Quadrant C Data is divided into 100 sec bins |
 |
 |
| Module-wise count rates for Quadrant D Data is divided into 100 sec bins |
 |
 |
| Parameter | Plot |
|---|---|
| CZT HV Monitor | 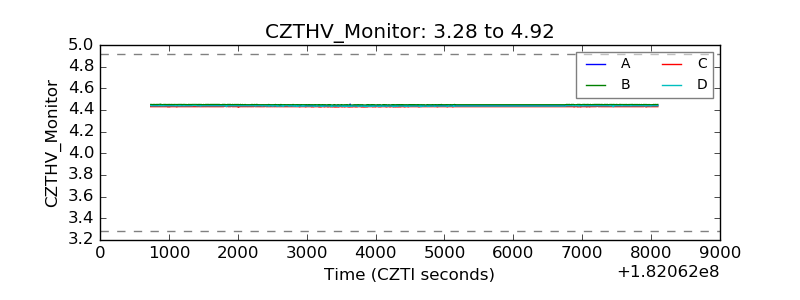 |
| D_VDD | 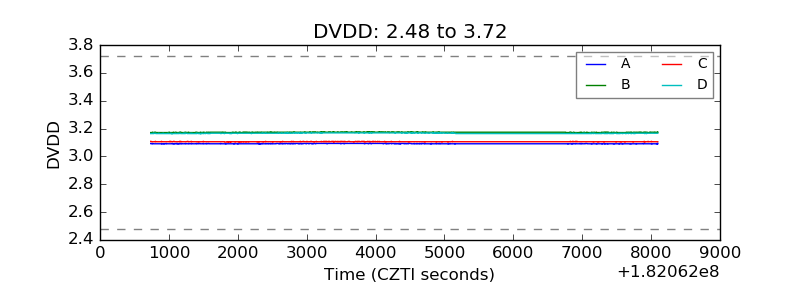 |
| Temperature 1 | 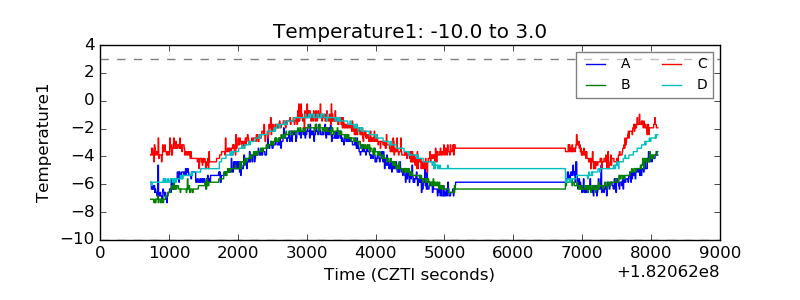 |
| Veto HV Monitor | 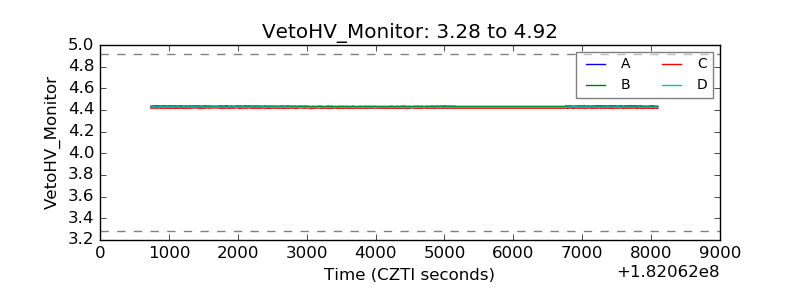 |
| Veto LLD | 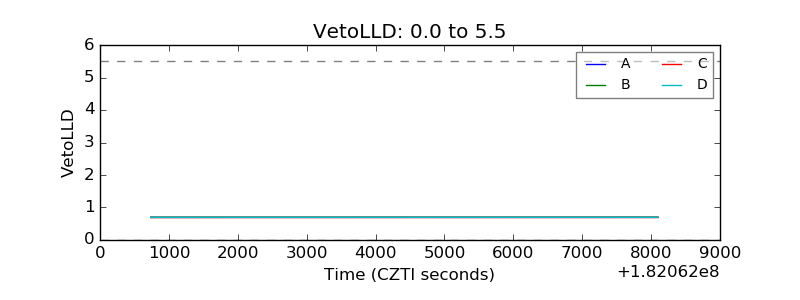 |
| Alpha Counter | 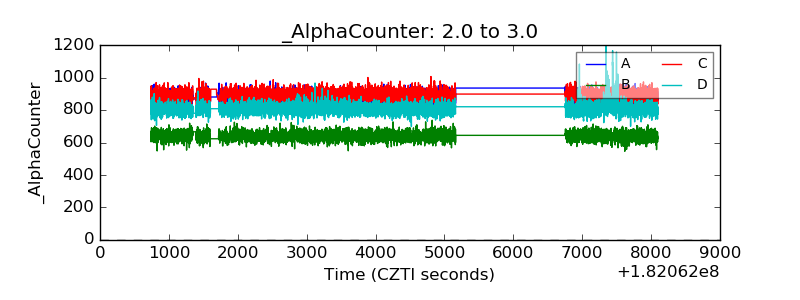 |
| _CPM_Rate | 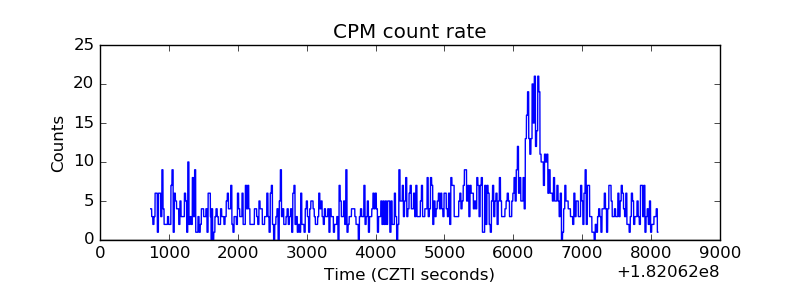 |
| CZT Counter | 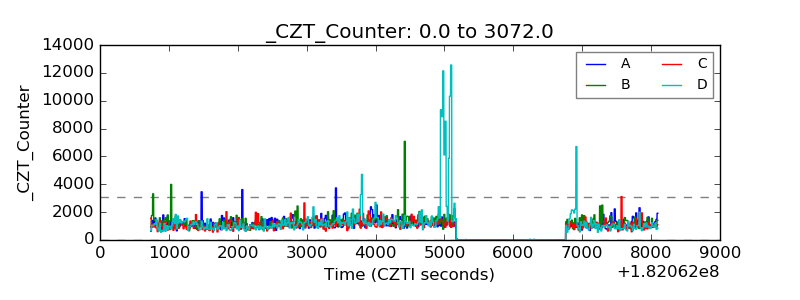 |
| +2.5 Volts monitor |  |
| +5 Volts monitor |  |
| _ROLL_ROT | 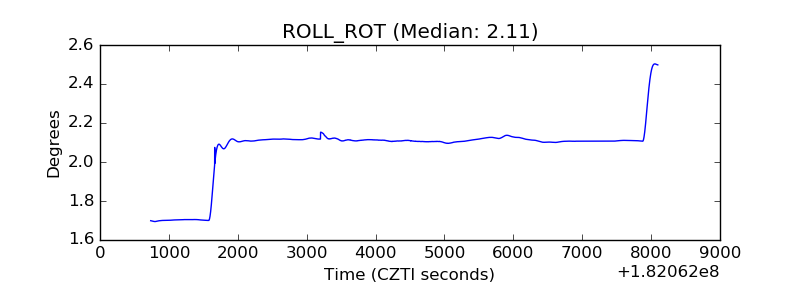 |
| _Roll_DEC | 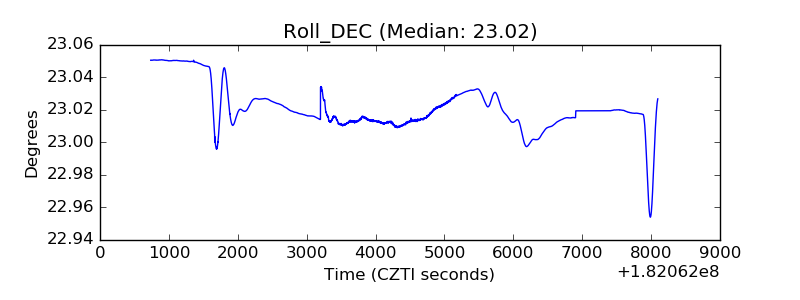 |
| _Roll_RA |  |
| Veto Counter | 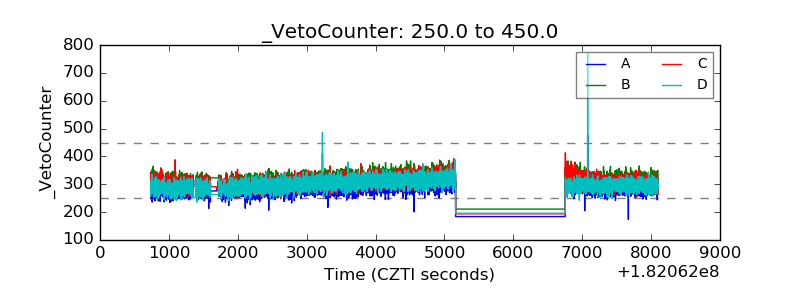 |