| Param | Original file | Final file |
|---|---|---|
| Filename | modeM0/AS1P01_120T01_9000000006_00166cztM0_level2.evt | modeM0/AS1P01_120T01_9000000006_00166cztM0_level2_quad_clean.evt |
| Size (bytes) | 884,779,200 | 20,194,560 |
| Size | 843.8 MB | 19.3 MB |
| Events in quadrant A | 7,162,265 | 57,197 |
| Events in quadrant B | 6,762,044 | 58,965 |
| Events in quadrant C | 6,219,841 | 58,613 |
| Events in quadrant D | 6,292,691 | 57,102 |
| Mode SS | |||
|---|---|---|---|
| Quadrant | BADHDUFLAG | Total packets | Discarded packets |
| A | 0 | 110 | 0 |
| B | 0 | 110 | 0 |
| C | 0 | 110 | 0 |
| D | 0 | 110 | 0 |
| Mode M9 | |||
|---|---|---|---|
| Quadrant | BADHDUFLAG | Total packets | Discarded packets |
| A | 0 | 16 | 0 |
| B | 0 | 16 | 0 |
| C | 0 | 16 | 0 |
| D | 0 | 16 | 0 |
| Mode M0 | |||
|---|---|---|---|
| Quadrant | BADHDUFLAG | Total packets | Discarded packets |
| A | 0 | 25089 | 2 |
| B | 0 | 23925 | 1 |
| C | 0 | 22344 | 1 |
| D | 0 | 22535 | 1 |
| Quadrant | Total seconds | Saturated seconds | Saturation percentage |
|---|---|---|---|
| A | 5406 | 56 | 1.035886% |
| B | 5406 | 17 | 0.314465% |
| C | 5406 | 4 | 0.073992% |
| D | 5406 | 40 | 0.739919% |
Noise dominated data is calculated using 1-second bins in cleaned event files. If a bin has >2000 counts, and if more than 50% of those come from <1% of pixels, then it is considered to be noise-dominated and hence unusable.
| Quadrant | # 1 sec bins | Bins with >0 counts | Bins with >2000 counts | High rate bins dominated by noise | Noise dominated (total time) | Noise dominated (detector-on time) | Marked lightcurve |
|---|---|---|---|---|---|---|---|
| A | 6997 | 5408 | 343 | 343 | 4.90% | 6.34% | 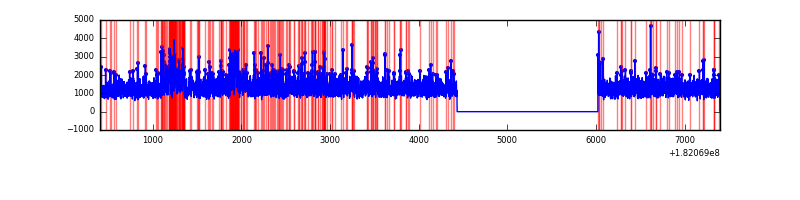 |
| B | 6997 | 5408 | 161 | 161 | 2.30% | 2.98% | 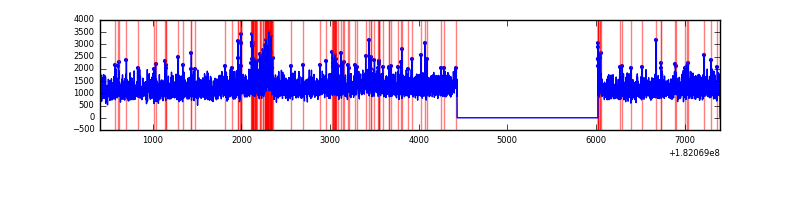 |
| C | 6997 | 5408 | 61 | 61 | 0.87% | 1.13% | 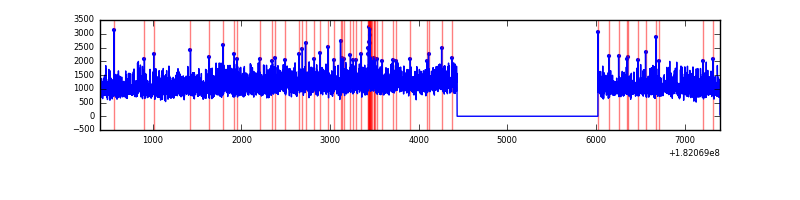 |
| D | 6997 | 5408 | 122 | 122 | 1.74% | 2.26% | 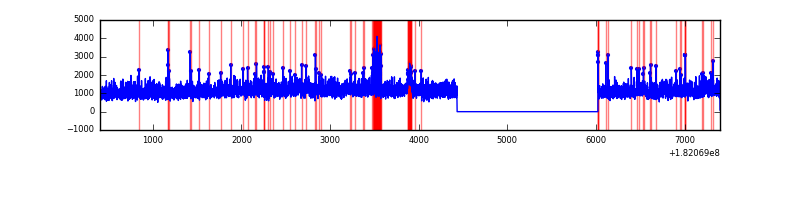 |
Top three noisy pixels from each quadrant. If the there are fewer than three noisy pixels in the level2.evt file, extra rows are filled as -1
| Pixel properties | Quadrant properties | ||||||
|---|---|---|---|---|---|---|---|
| Quadrant | DetID | PixID | Counts | Sigma | Mean | Median | Sigma |
| A | 14 | 10 | 396963 | 1046.31 | 1709 | 1695 | 377.8 |
| A | 0 | 96 | 64844 | 167.16 | 1709 | 1695 | 377.8 |
| A | 14 | 170 | 31621 | 79.22 | 1709 | 1695 | 377.8 |
| B | 10 | 199 | 297004 | 746.16 | 1664 | 1675 | 395.8 |
| B | 5 | 216 | 55039 | 134.82 | 1664 | 1675 | 395.8 |
| B | 0 | 212 | 12712 | 27.88 | 1664 | 1675 | 395.8 |
| C | 8 | 31 | 141978 | 326.05 | 1524 | 1580 | 430.6 |
| C | 0 | 202 | 37819 | 84.16 | 1524 | 1580 | 430.6 |
| C | 10 | 17 | 19159 | 40.82 | 1524 | 1580 | 430.6 |
| D | 13 | 223 | 108687 | 226.07 | 1547 | 1599 | 473.7 |
| D | 2 | 63 | 51574 | 105.5 | 1547 | 1599 | 473.7 |
| D | 1 | 2 | 36330 | 73.32 | 1547 | 1599 | 473.7 |
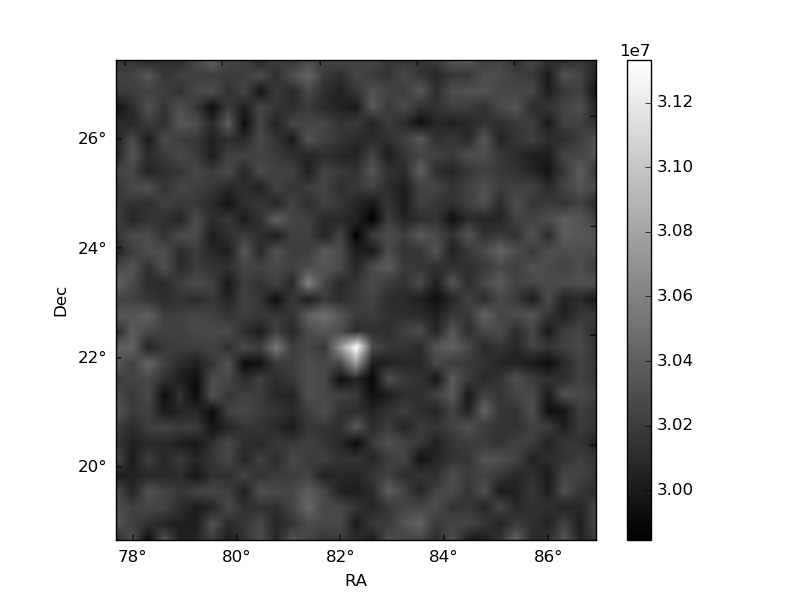
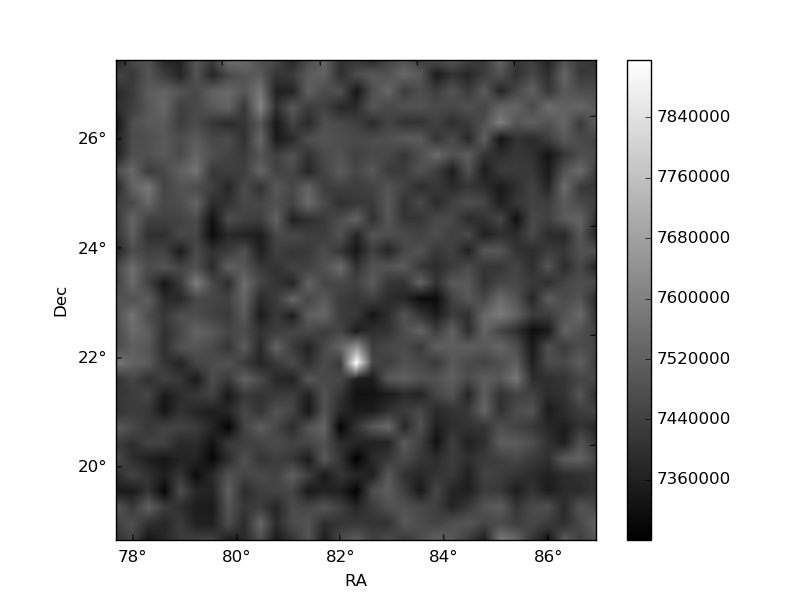
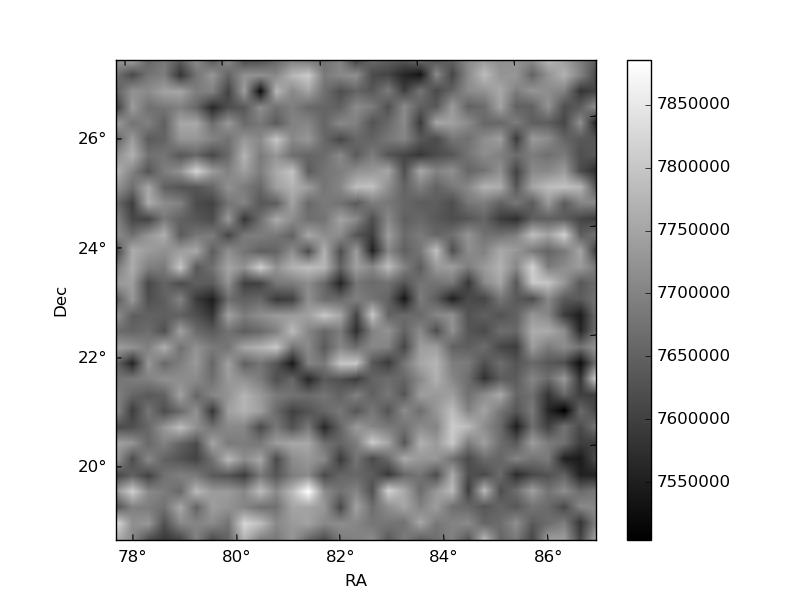
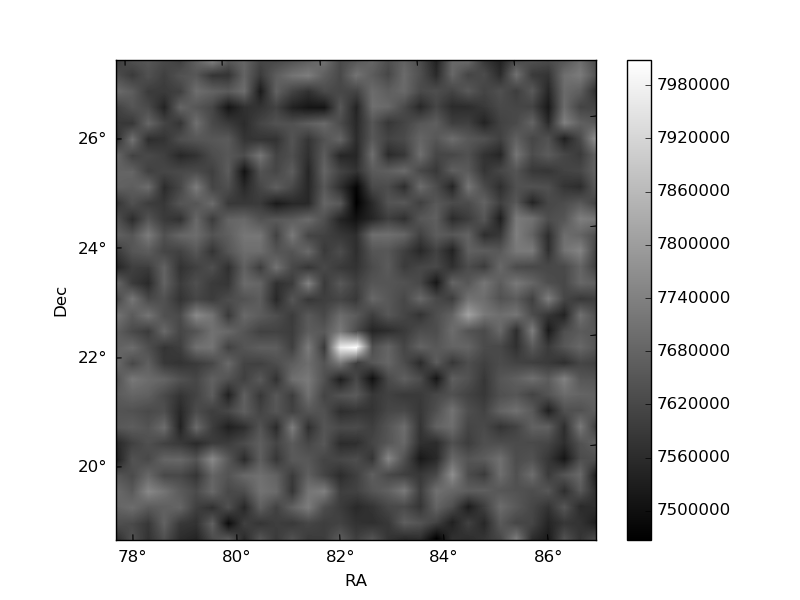
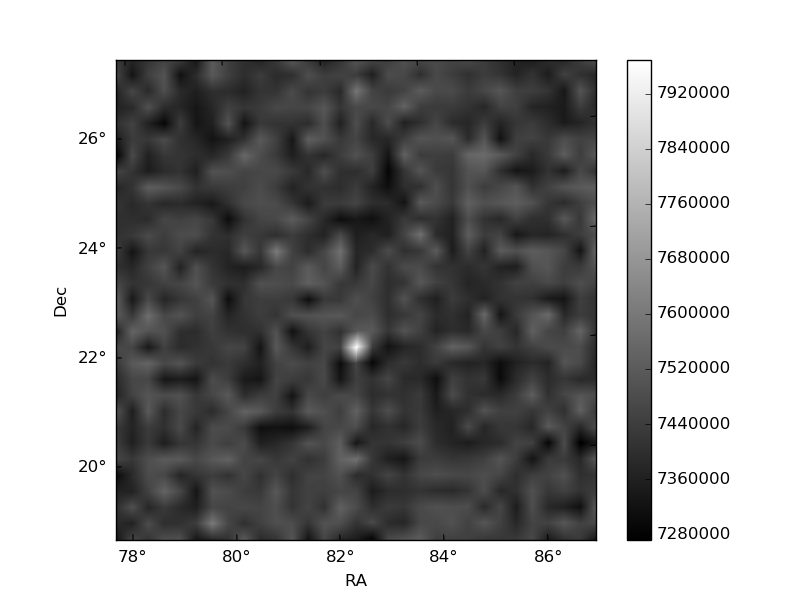
Histogram calculated using DETX and DETY for each event in the final _common_clean file
| Quadrant A | 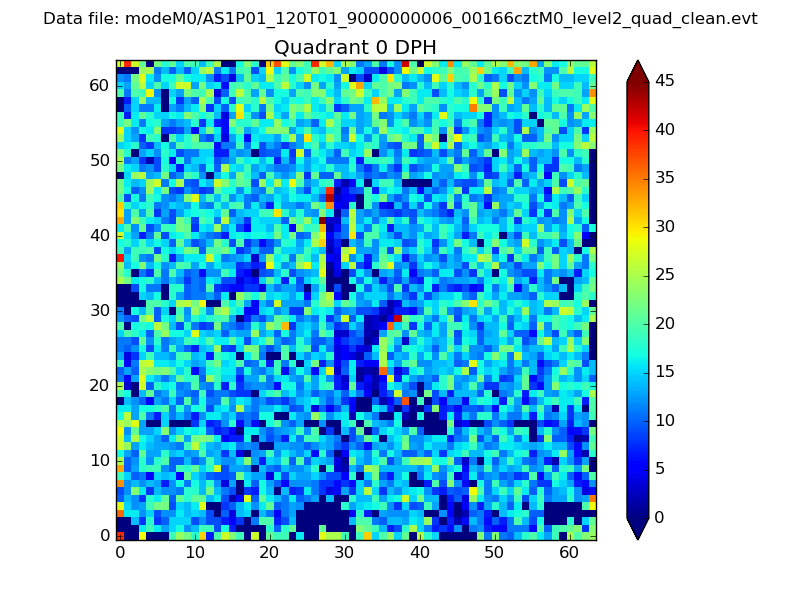 |
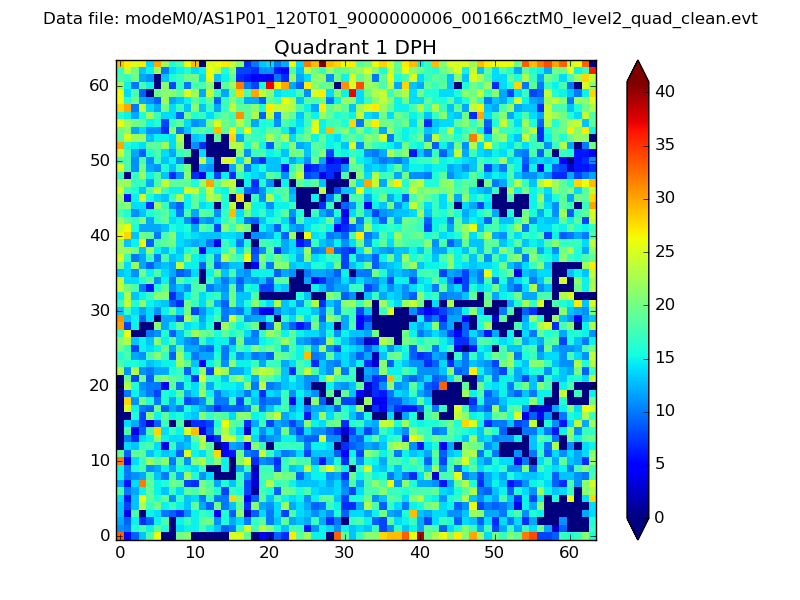 |
Quadrant B |
|---|---|---|---|
| Quadrant D | 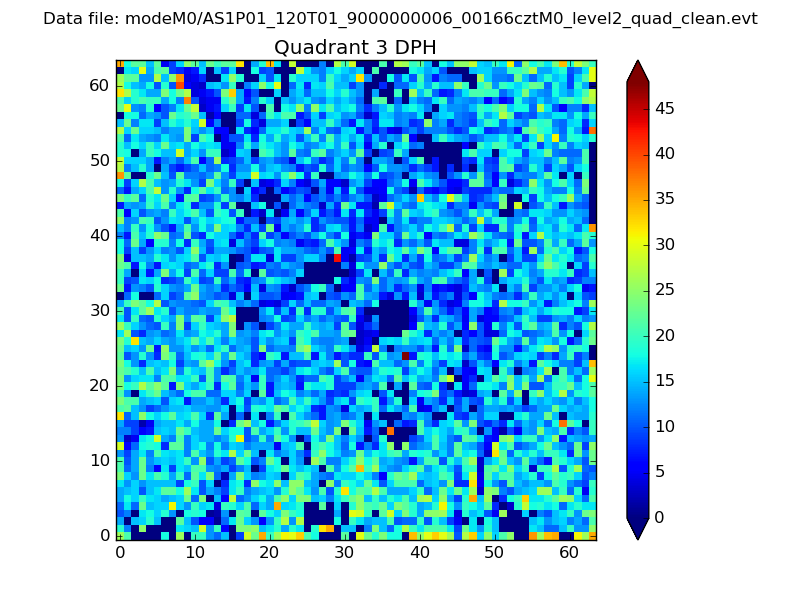 |
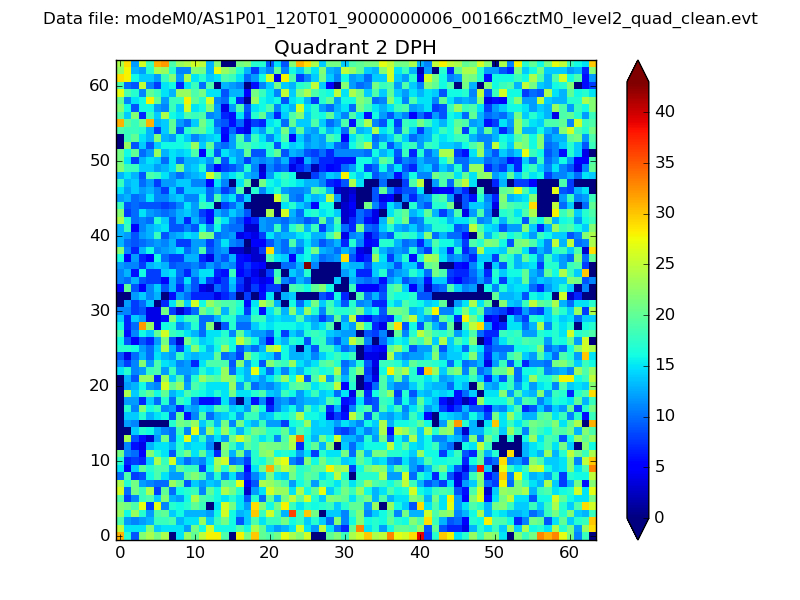 |
Quadrant C |
| Plot type | Count rate plots | Images |
|---|---|---|
| Comparison with Poisson distribution Blue bars denote a histogram of data divided into 1 sec bins. Red curve is a Poisson curve with rate = median count rate of data. |
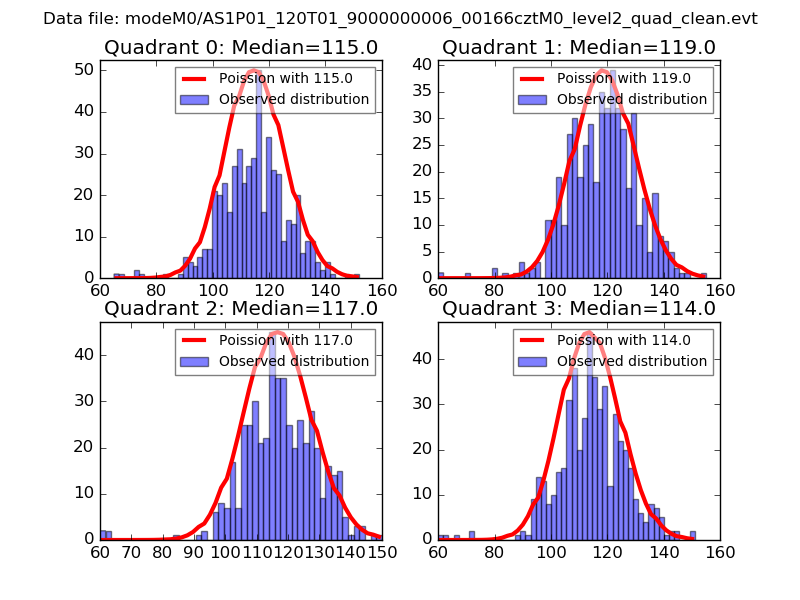 |
 |
| Quadrant-wise count rates Data is divided into 100 sec bins |
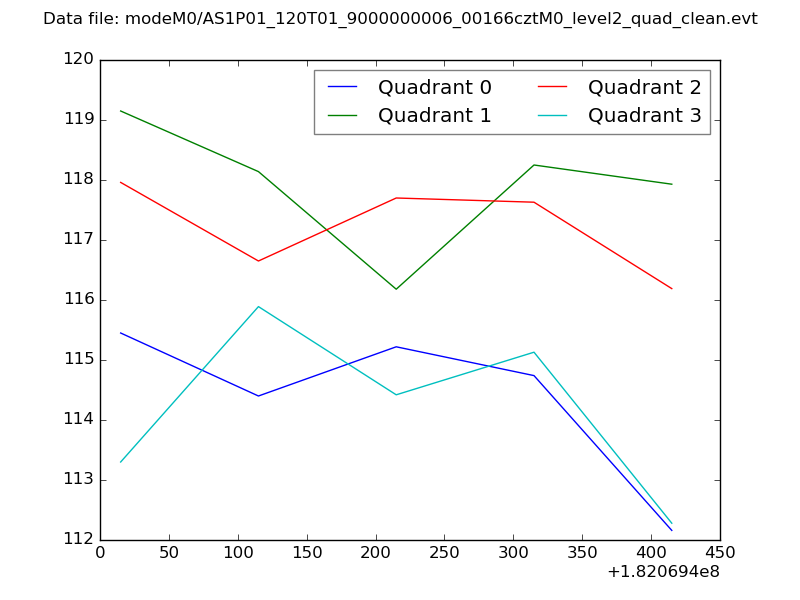 |
|
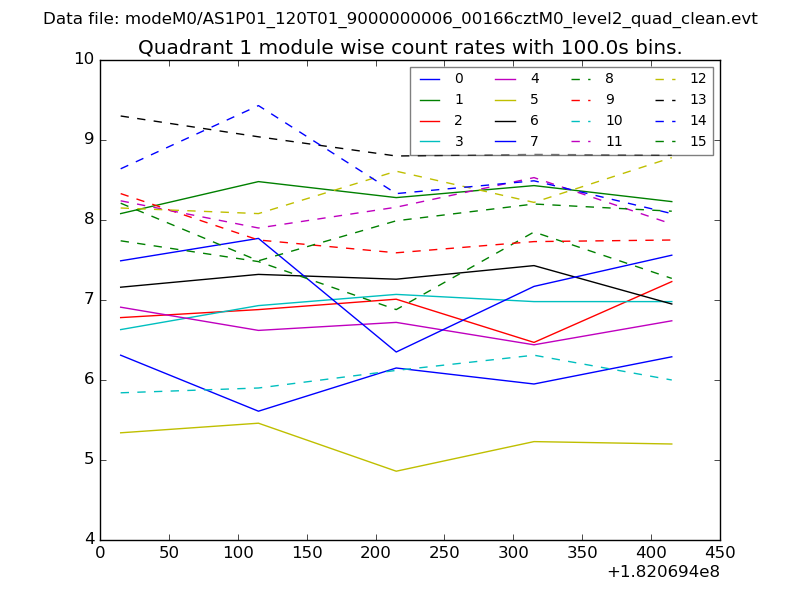
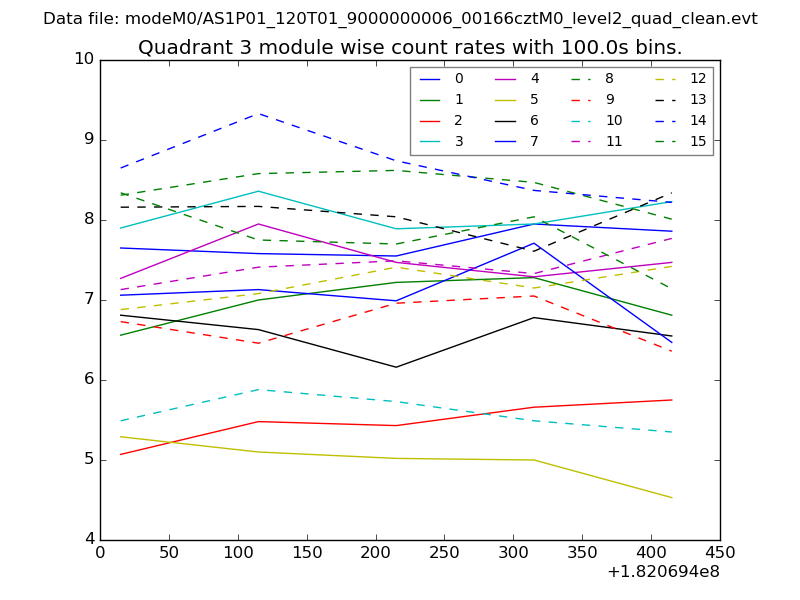
| Module-wise count rates for Quadrant A Data is divided into 100 sec bins |
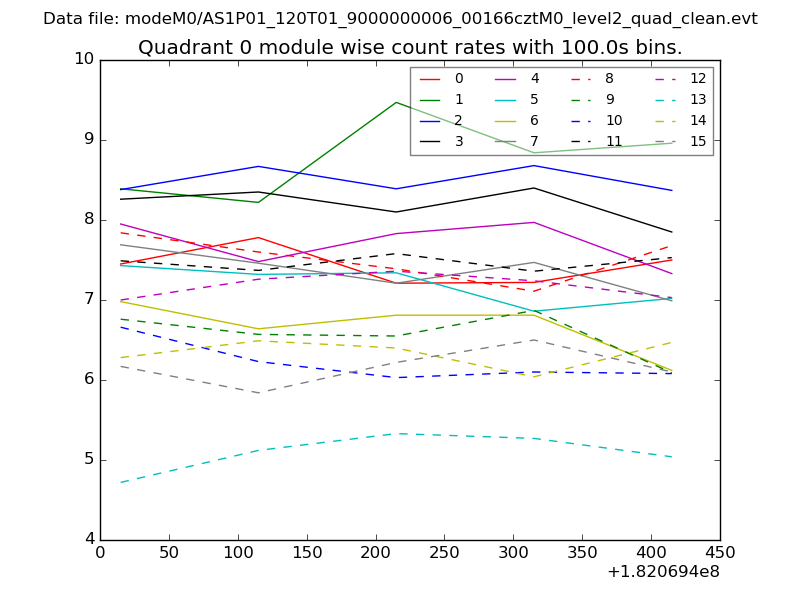 |
 |
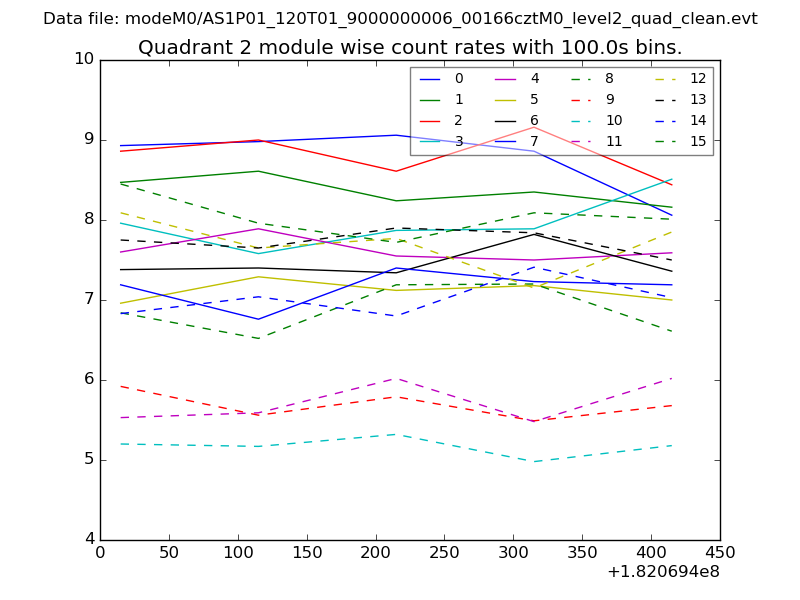
| Module-wise count rates for Quadrant B Data is divided into 100 sec bins |
 |
 |
| Module-wise count rates for Quadrant C Data is divided into 100 sec bins |
 |
 |
| Module-wise count rates for Quadrant D Data is divided into 100 sec bins |
 |
 |
| Parameter | Plot |
|---|---|
| CZT HV Monitor | 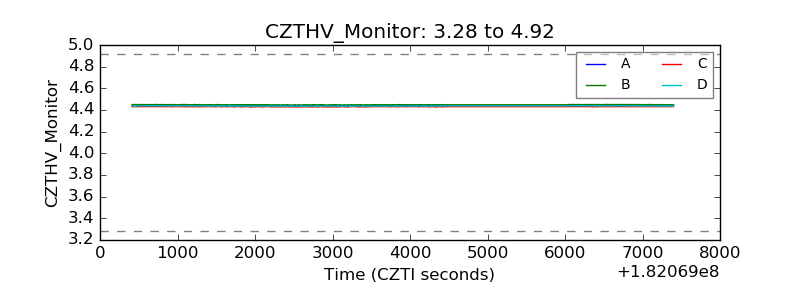 |
| D_VDD | 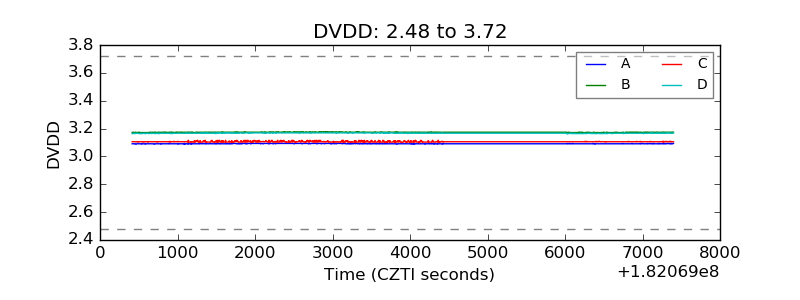 |
| Temperature 1 | 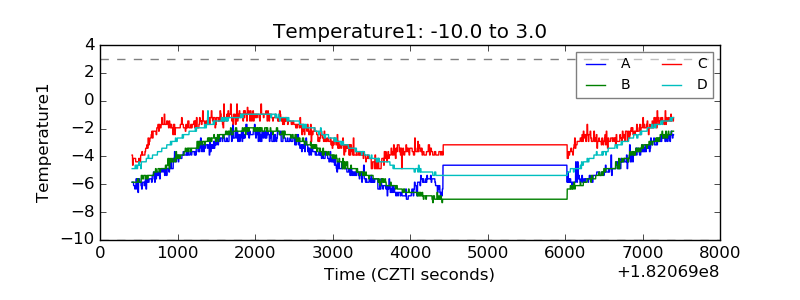 |
| Veto HV Monitor | 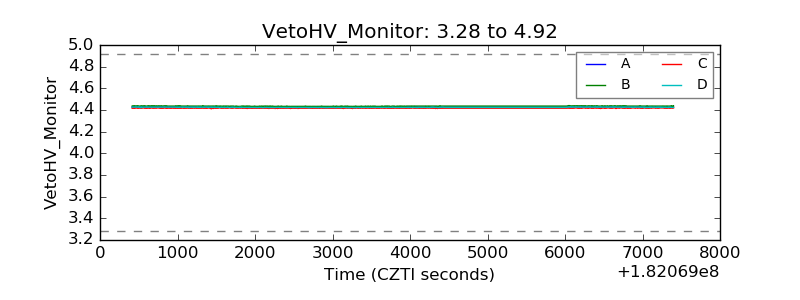 |
| Veto LLD |  |
| Alpha Counter | 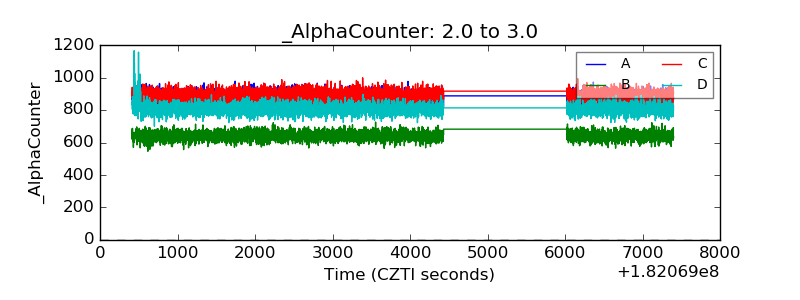 |
| _CPM_Rate | 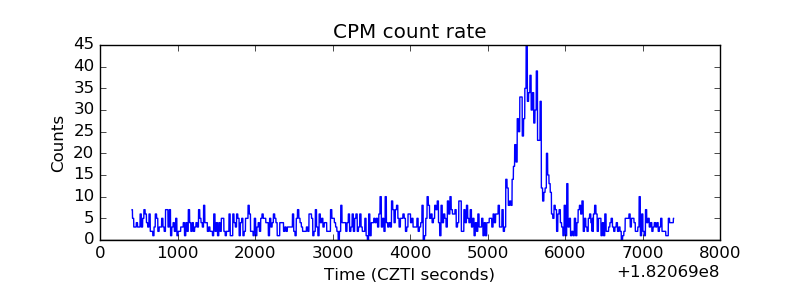 |
| CZT Counter | 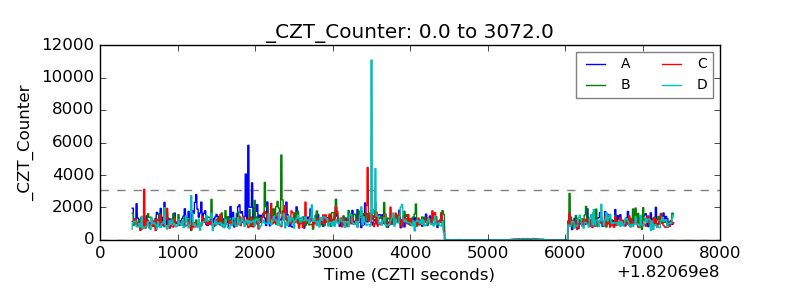 |
| +2.5 Volts monitor | 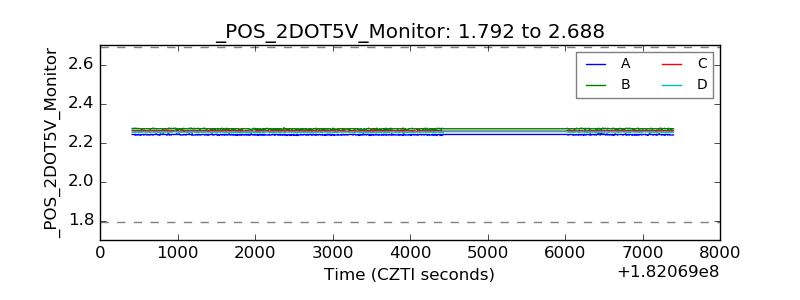 |
| +5 Volts monitor |  |
| _ROLL_ROT | 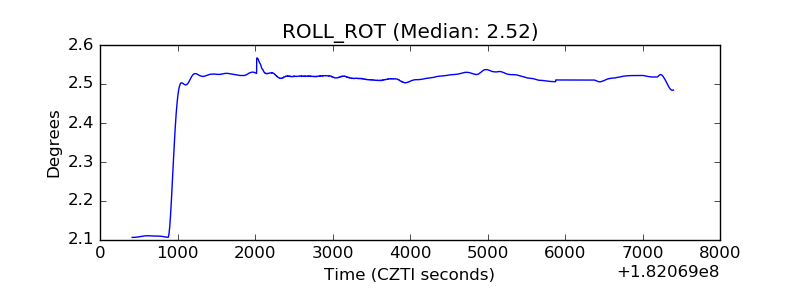 |
| _Roll_DEC | 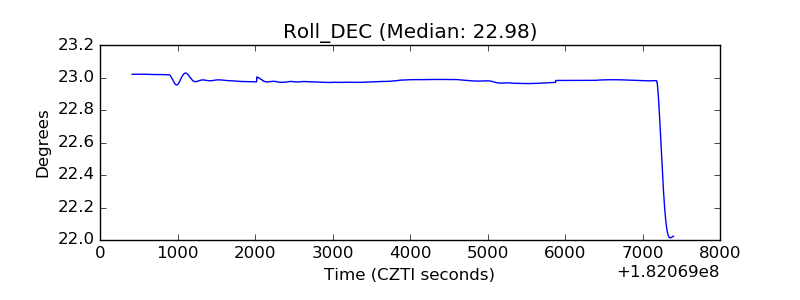 |
| _Roll_RA | 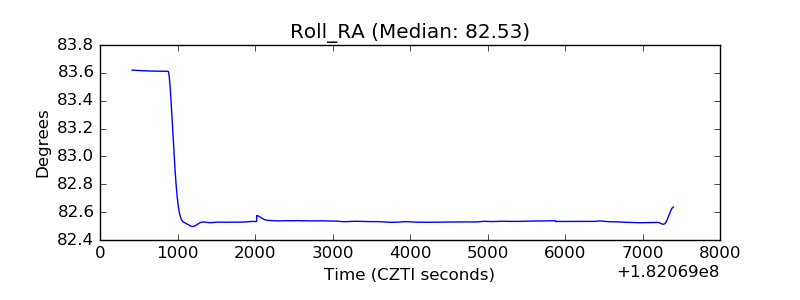 |
| Veto Counter | 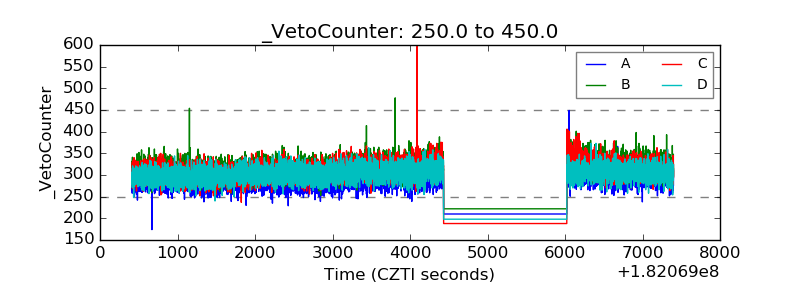 |