| Param | Original file | Final file |
|---|---|---|
| Filename | modeM0/AS1P01_120T01_9000000006_00167cztM0_level2.evt | modeM0/AS1P01_120T01_9000000006_00167cztM0_level2_quad_clean.evt |
| Size (bytes) | 802,581,120 | 36,158,400 |
| Size | 765.4 MB | 34.5 MB |
| Events in quadrant A | 6,125,791 | 186,898 |
| Events in quadrant B | 6,226,097 | 192,313 |
| Events in quadrant C | 5,640,534 | 189,489 |
| Events in quadrant D | 5,989,591 | 182,936 |
| Mode SS | |||
|---|---|---|---|
| Quadrant | BADHDUFLAG | Total packets | Discarded packets |
| A | 0 | 104 | 6 |
| B | 0 | 103 | 7 |
| C | 0 | 104 | 6 |
| D | 0 | 106 | 8 |
| Mode M9 | |||
|---|---|---|---|
| Quadrant | BADHDUFLAG | Total packets | Discarded packets |
| A | 0 | 13 | 6 |
| B | 0 | 12 | 5 |
| C | 0 | 12 | 7 |
| D | 0 | 13 | 7 |
| Mode M0 | |||
|---|---|---|---|
| Quadrant | BADHDUFLAG | Total packets | Discarded packets |
| A | 0 | 23098 | 1461 |
| B | 0 | 23411 | 1456 |
| C | 0 | 21581 | 1349 |
| D | 0 | 22645 | 1403 |
| Quadrant | Total seconds | Saturated seconds | Saturation percentage |
|---|---|---|---|
| A | 4879 | 5 | 0.102480% |
| B | 4884 | 15 | 0.307125% |
| C | 4882 | 0 | 0.000000% |
| D | 4882 | 79 | 1.618189% |
Noise dominated data is calculated using 1-second bins in cleaned event files. If a bin has >2000 counts, and if more than 50% of those come from <1% of pixels, then it is considered to be noise-dominated and hence unusable.
| Quadrant | # 1 sec bins | Bins with >0 counts | Bins with >2000 counts | High rate bins dominated by noise | Noise dominated (total time) | Noise dominated (detector-on time) | Marked lightcurve |
|---|---|---|---|---|---|---|---|
| A | 6921 | 4889 | 150 | 150 | 2.17% | 3.07% | 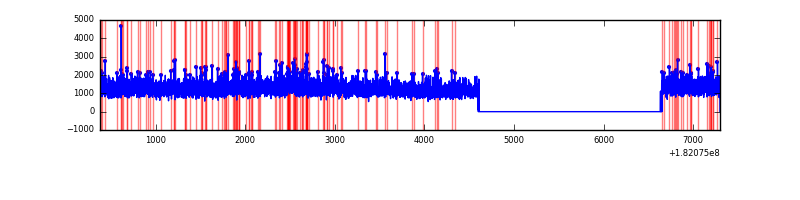 |
| B | 6921 | 4896 | 161 | 161 | 2.33% | 3.29% | 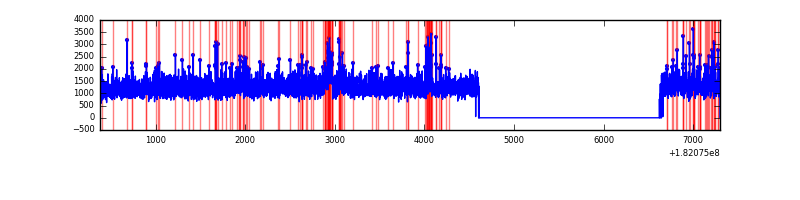 |
| C | 6921 | 4893 | 42 | 42 | 0.61% | 0.86% | 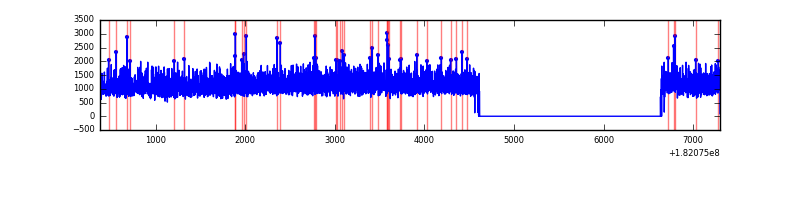 |
| D | 6921 | 4895 | 193 | 193 | 2.79% | 3.94% | 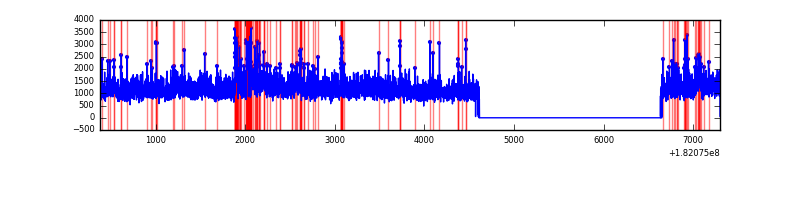 |
Top three noisy pixels from each quadrant. If the there are fewer than three noisy pixels in the level2.evt file, extra rows are filled as -1
| Pixel properties | Quadrant properties | ||||||
|---|---|---|---|---|---|---|---|
| Quadrant | DetID | PixID | Counts | Sigma | Mean | Median | Sigma |
| A | 14 | 10 | 111148 | 315.65 | 1543 | 1529 | 347.3 |
| A | 0 | 86 | 11334 | 28.23 | 1543 | 1529 | 347.3 |
| A | 13 | 239 | 8678 | 20.59 | 1543 | 1529 | 347.3 |
| B | 10 | 199 | 203573 | 550.03 | 1531 | 1537 | 367.3 |
| B | 5 | 216 | 68130 | 181.3 | 1531 | 1537 | 367.3 |
| B | 14 | 50 | 17494 | 43.44 | 1531 | 1537 | 367.3 |
| C | 8 | 31 | 108153 | 266.63 | 1399 | 1447 | 400.2 |
| C | 0 | 218 | 10495 | 22.61 | 1399 | 1447 | 400.2 |
| C | 10 | 17 | 7327 | 14.69 | 1399 | 1447 | 400.2 |
| D | 13 | 21 | 209644 | 487.4 | 1396 | 1444 | 427.2 |
| D | 10 | 229 | 161528 | 374.76 | 1396 | 1444 | 427.2 |
| D | 13 | 223 | 64960 | 148.69 | 1396 | 1444 | 427.2 |
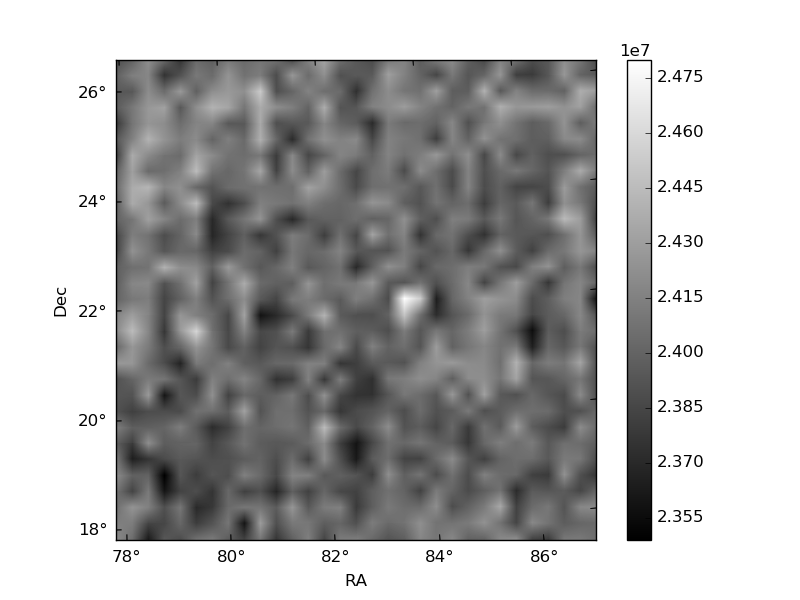
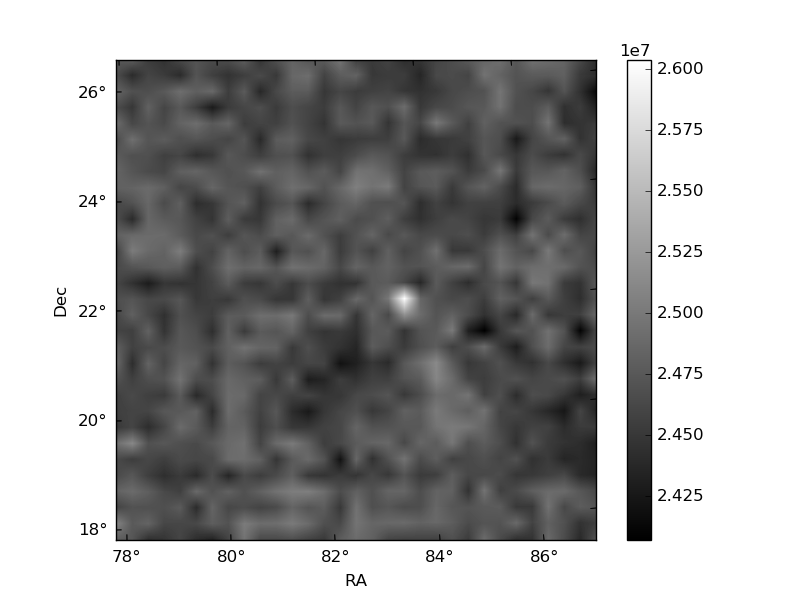
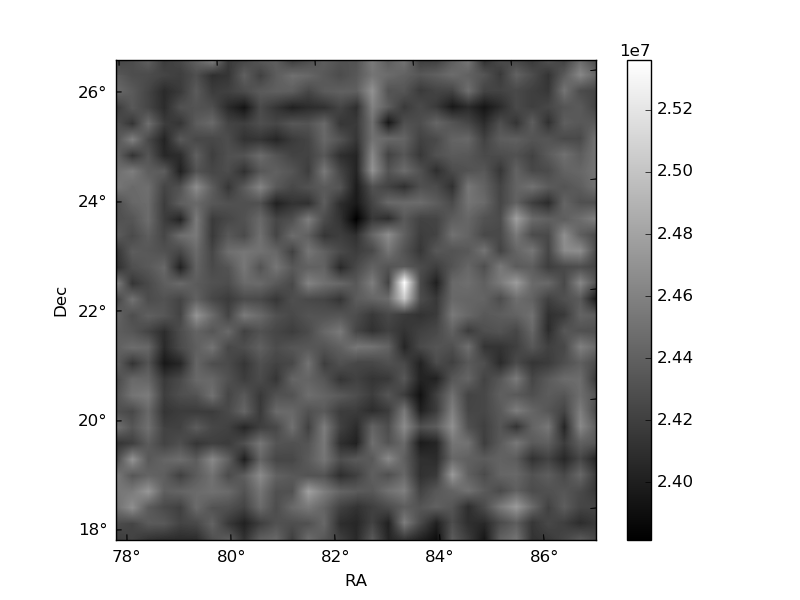
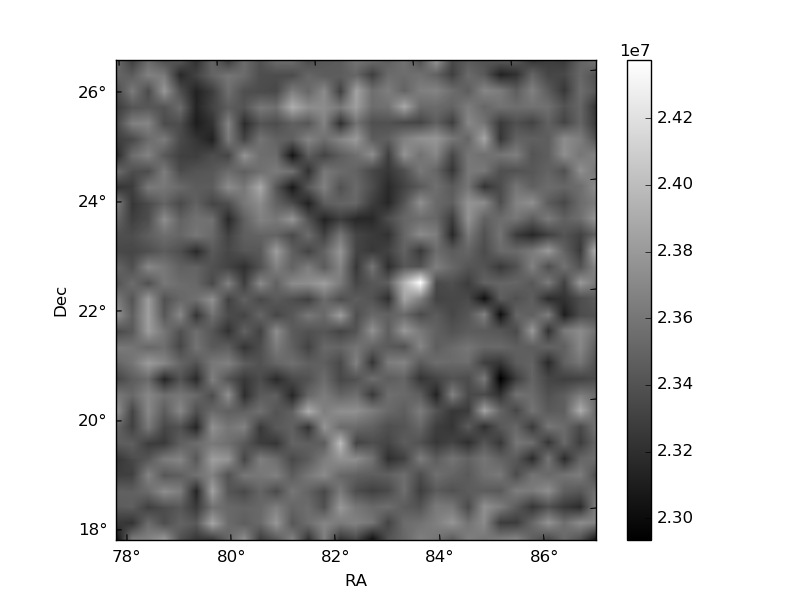
Histogram calculated using DETX and DETY for each event in the final _common_clean file
| Quadrant A |  |
 |
Quadrant B |
|---|---|---|---|
| Quadrant D | 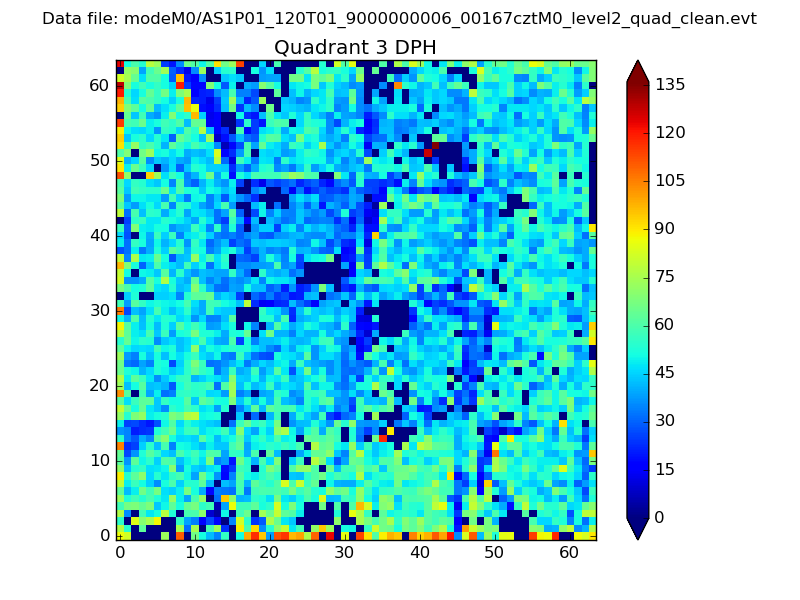 |
 |
Quadrant C |
| Plot type | Count rate plots | Images |
|---|---|---|
| Comparison with Poisson distribution Blue bars denote a histogram of data divided into 1 sec bins. Red curve is a Poisson curve with rate = median count rate of data. |
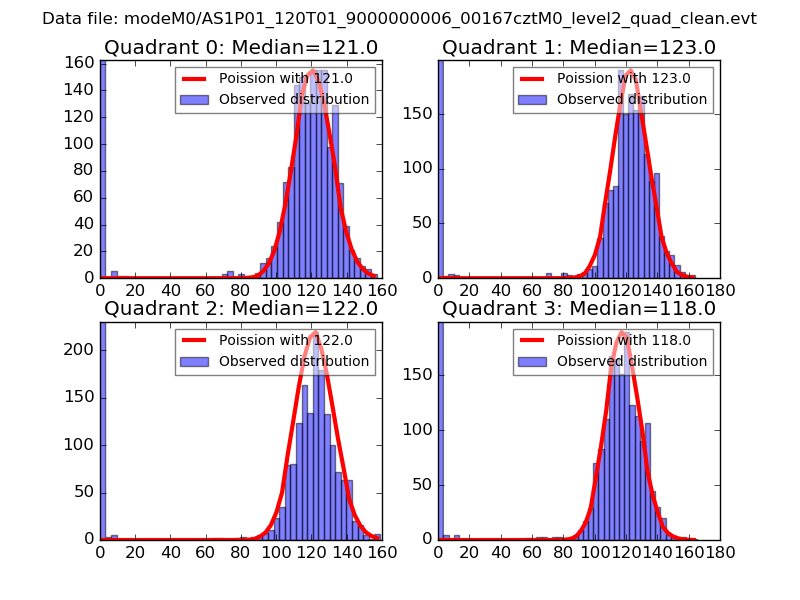 |
 |
| Quadrant-wise count rates Data is divided into 100 sec bins |
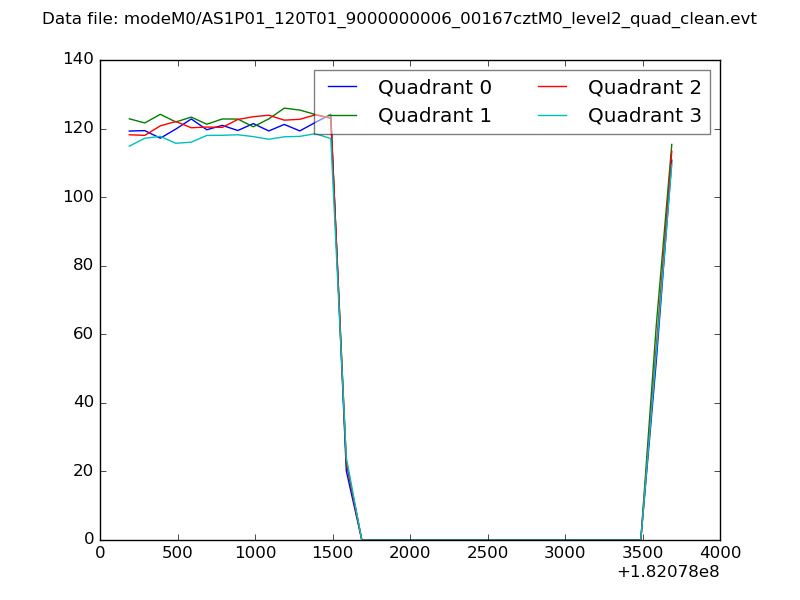 |
|
| Module-wise count rates for Quadrant A Data is divided into 100 sec bins |
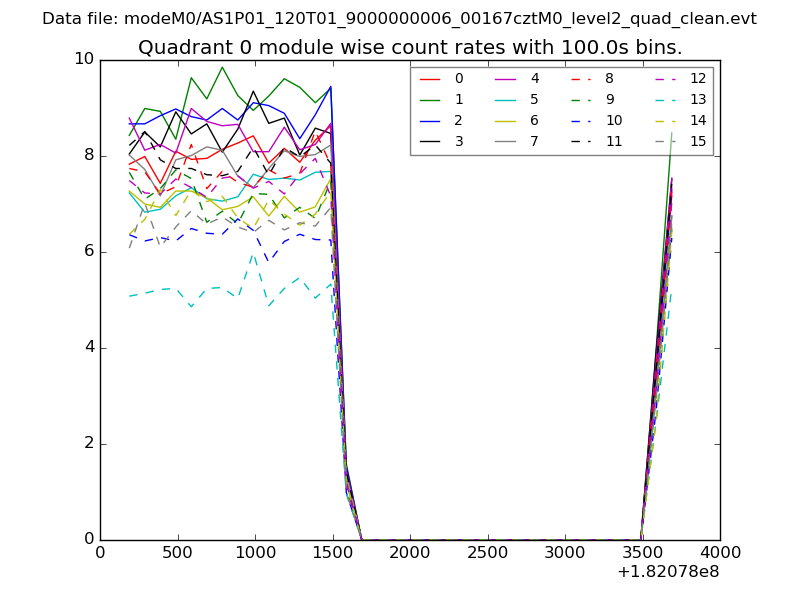 |
 |
| Module-wise count rates for Quadrant B Data is divided into 100 sec bins |
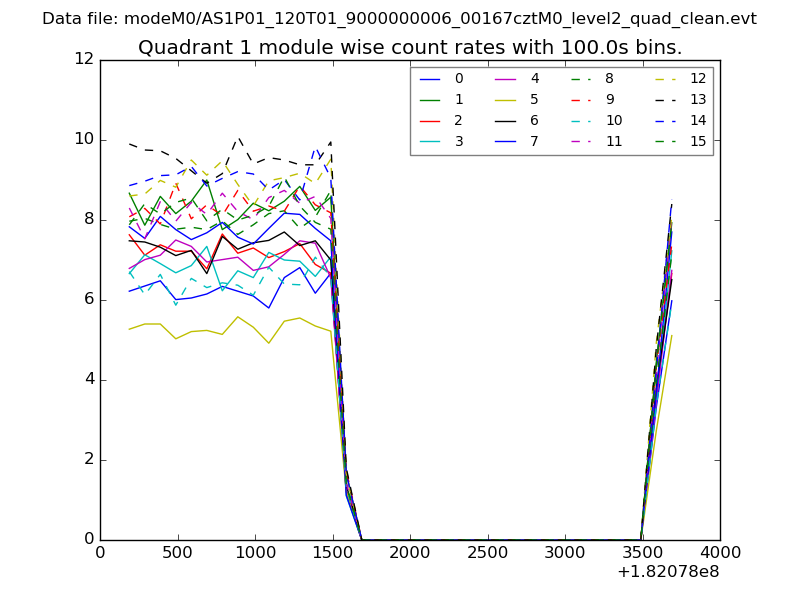 |
 |
| Module-wise count rates for Quadrant C Data is divided into 100 sec bins |
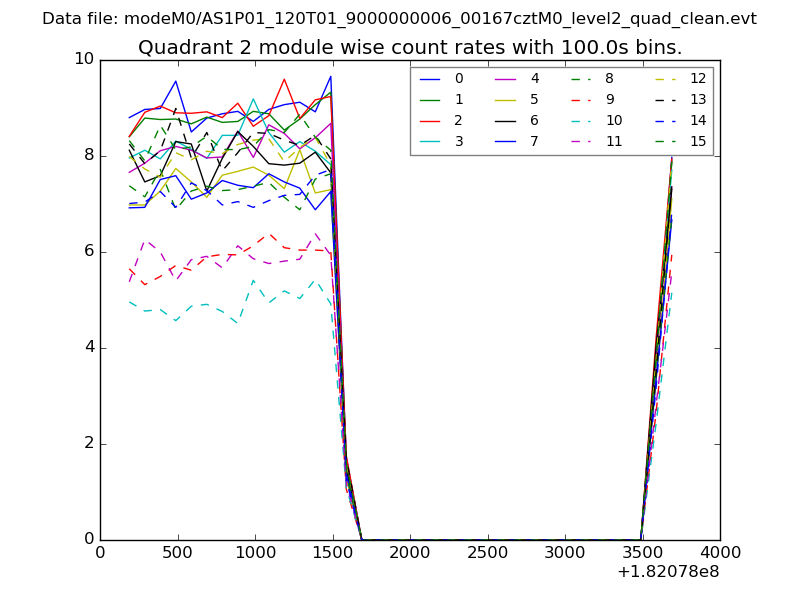 |
 |
| Module-wise count rates for Quadrant D Data is divided into 100 sec bins |
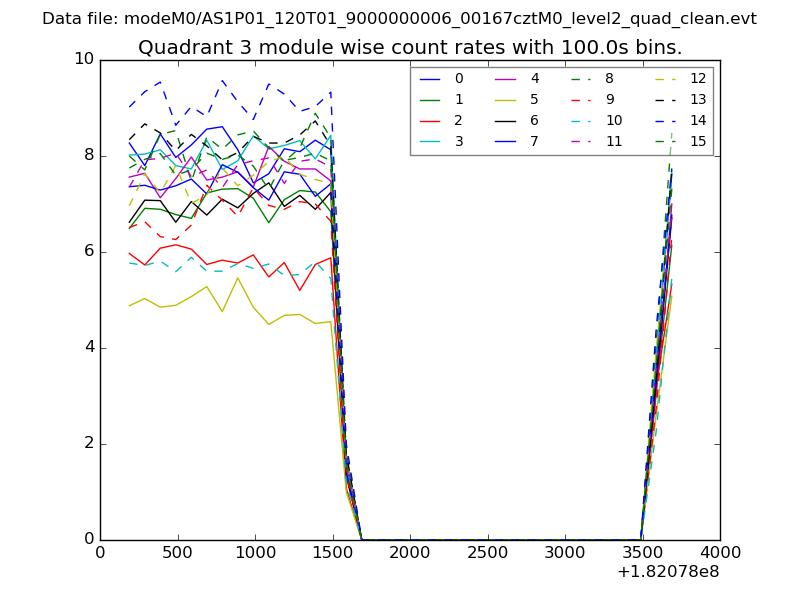 |
 |
| Parameter | Plot |
|---|---|
| CZT HV Monitor |  |
| D_VDD | 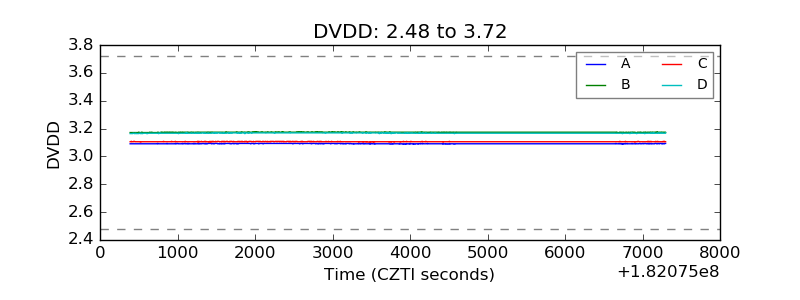 |
| Temperature 1 | 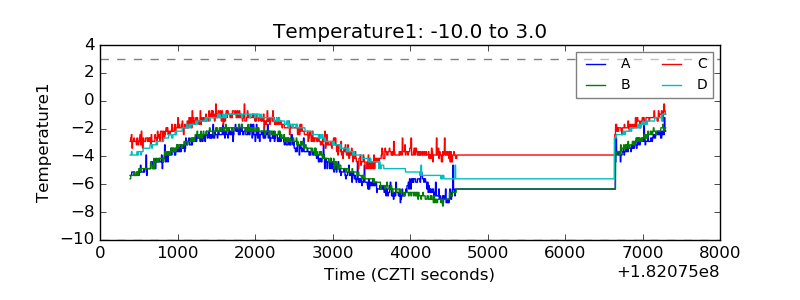 |
| Veto HV Monitor | 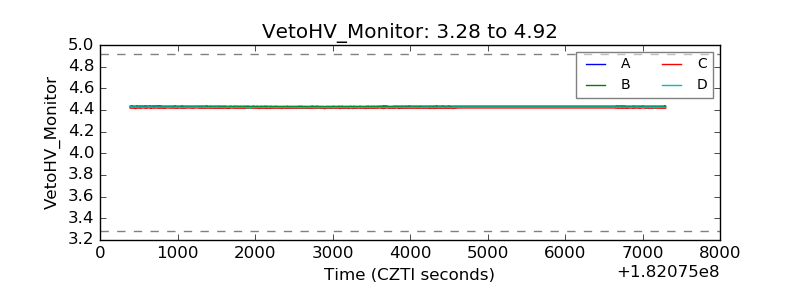 |
| Veto LLD | 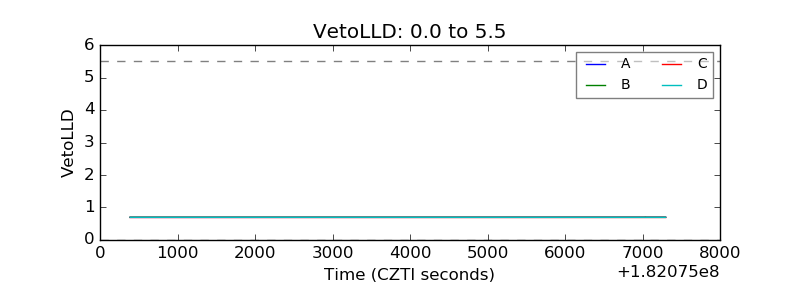 |
| Alpha Counter | 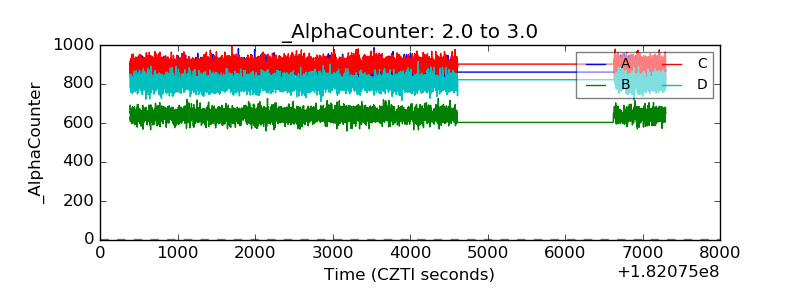 |
| _CPM_Rate | 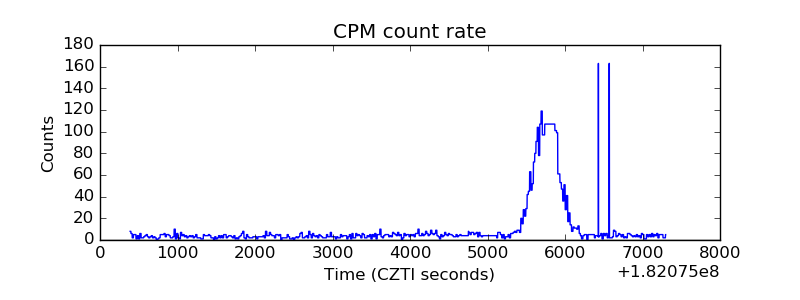 |
| CZT Counter | 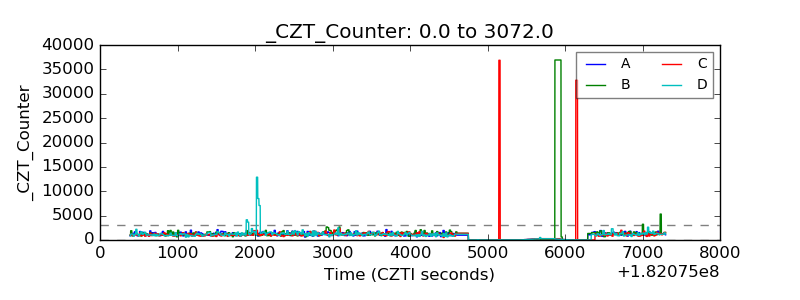 |
| +2.5 Volts monitor |  |
| +5 Volts monitor | 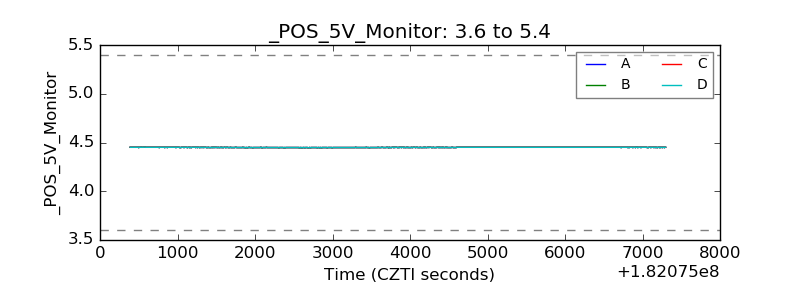 |
| _ROLL_ROT | 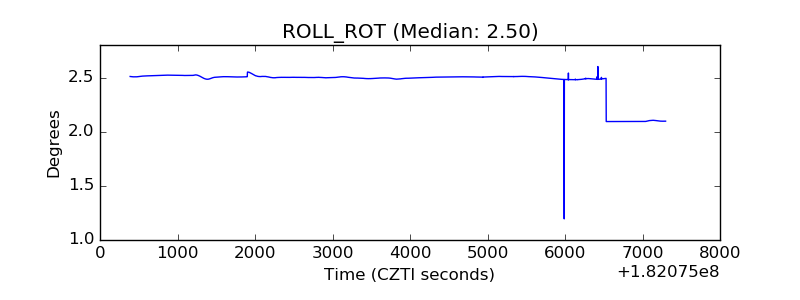 |
| _Roll_DEC | 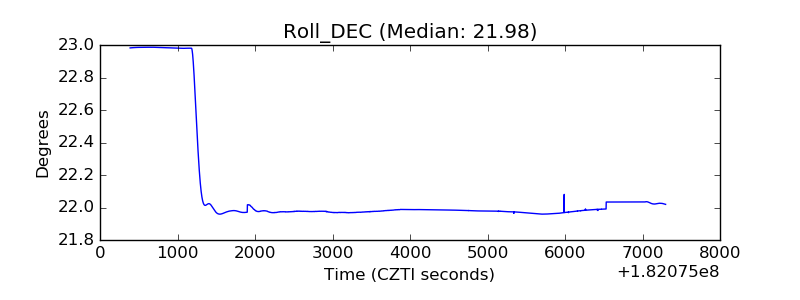 |
| _Roll_RA | 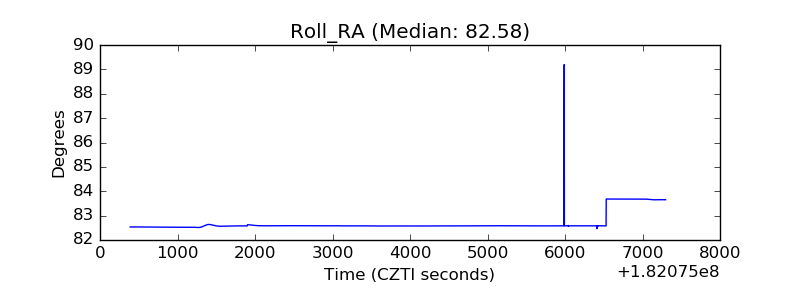 |
| Veto Counter | 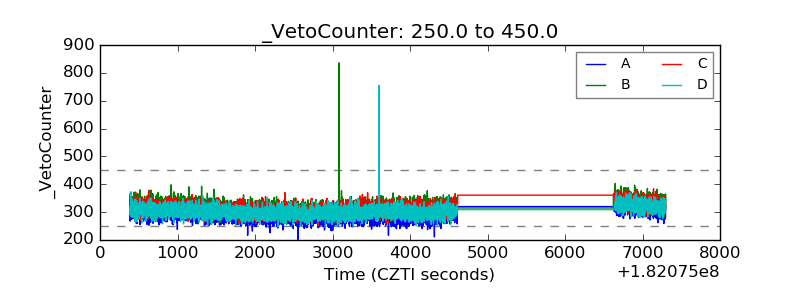 |