| Param | Original file | Final file |
|---|---|---|
| Filename | modeM0/AS1P01_134T01_9000000008_00168cztM0_level2.evt | modeM0/AS1P01_134T01_9000000008_00168cztM0_level2_quad_clean.evt |
| Size (bytes) | 785,911,680 | 39,366,720 |
| Size | 749.5 MB | 37.5 MB |
| Events in quadrant A | 5,916,926 | 215,123 |
| Events in quadrant B | 6,022,569 | 219,726 |
| Events in quadrant C | 5,461,066 | 217,662 |
| Events in quadrant D | 6,091,033 | 211,334 |
| Mode M0 | |||
|---|---|---|---|
| Quadrant | BADHDUFLAG | Total packets | Discarded packets |
| A | 0 | 20882 | 2 |
| B | 0 | 21210 | 1 |
| C | 0 | 19573 | 1 |
| D | 0 | 21440 | 1 |
| Mode SS | |||
|---|---|---|---|
| Quadrant | BADHDUFLAG | Total packets | Discarded packets |
| A | 0 | 94 | 0 |
| B | 0 | 94 | 0 |
| C | 0 | 94 | 0 |
| D | 0 | 94 | 0 |
| Mode M9 | |||
|---|---|---|---|
| Quadrant | BADHDUFLAG | Total packets | Discarded packets |
| A | 0 | 17 | 0 |
| B | 0 | 17 | 0 |
| C | 0 | 17 | 0 |
| D | 0 | 17 | 0 |
| Quadrant | Total seconds | Saturated seconds | Saturation percentage |
|---|---|---|---|
| A | 4667 | 40 | 0.857082% |
| B | 4667 | 45 | 0.964217% |
| C | 4667 | 1 | 0.021427% |
| D | 4667 | 144 | 3.085494% |
Noise dominated data is calculated using 1-second bins in cleaned event files. If a bin has >2000 counts, and if more than 50% of those come from <1% of pixels, then it is considered to be noise-dominated and hence unusable.
| Quadrant | # 1 sec bins | Bins with >0 counts | Bins with >2000 counts | High rate bins dominated by noise | Noise dominated (total time) | Noise dominated (detector-on time) | Marked lightcurve |
|---|---|---|---|---|---|---|---|
| A | 6289 | 4669 | 191 | 191 | 3.04% | 4.09% | 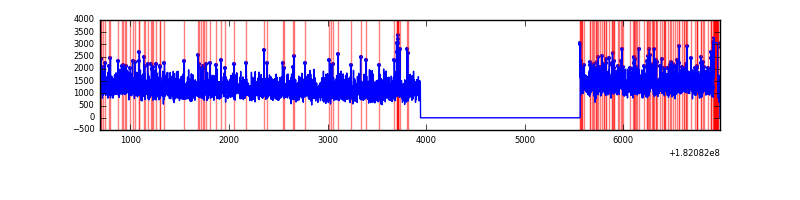 |
| B | 6289 | 4669 | 196 | 196 | 3.12% | 4.20% | 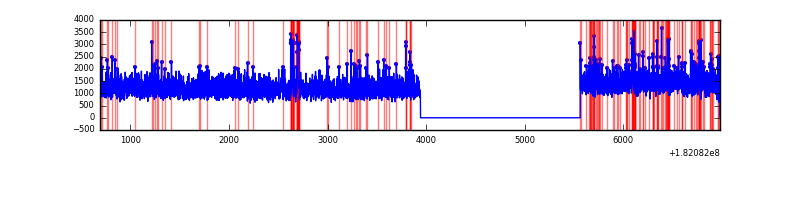 |
| C | 6289 | 4669 | 60 | 60 | 0.95% | 1.29% | 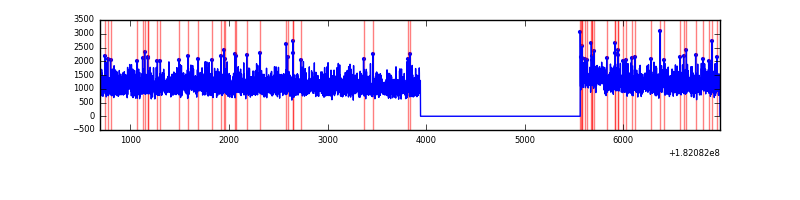 |
| D | 6289 | 4669 | 373 | 373 | 5.93% | 7.99% | 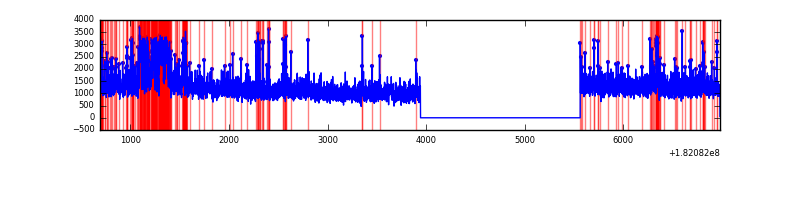 |
Top three noisy pixels from each quadrant. If the there are fewer than three noisy pixels in the level2.evt file, extra rows are filled as -1
| Pixel properties | Quadrant properties | ||||||
|---|---|---|---|---|---|---|---|
| Quadrant | DetID | PixID | Counts | Sigma | Mean | Median | Sigma |
| A | 0 | 96 | 97492 | 291.17 | 1473 | 1461 | 329.8 |
| A | 14 | 171 | 38761 | 113.09 | 1473 | 1461 | 329.8 |
| A | 14 | 10 | 16232 | 44.79 | 1473 | 1461 | 329.8 |
| B | 10 | 199 | 172657 | 495.05 | 1466 | 1477 | 345.8 |
| B | 5 | 216 | 148265 | 424.51 | 1466 | 1477 | 345.8 |
| B | 8 | 5 | 14267 | 36.99 | 1466 | 1477 | 345.8 |
| C | 8 | 31 | 44435 | 112.01 | 1356 | 1409 | 384.1 |
| C | 0 | 186 | 31449 | 78.21 | 1356 | 1409 | 384.1 |
| C | 0 | 202 | 26415 | 65.1 | 1356 | 1409 | 384.1 |
| D | 2 | 121 | 556548 | 1352.3 | 1330 | 1372 | 410.5 |
| D | 13 | 223 | 108280 | 260.41 | 1330 | 1372 | 410.5 |
| D | 13 | 89 | 84983 | 203.66 | 1330 | 1372 | 410.5 |
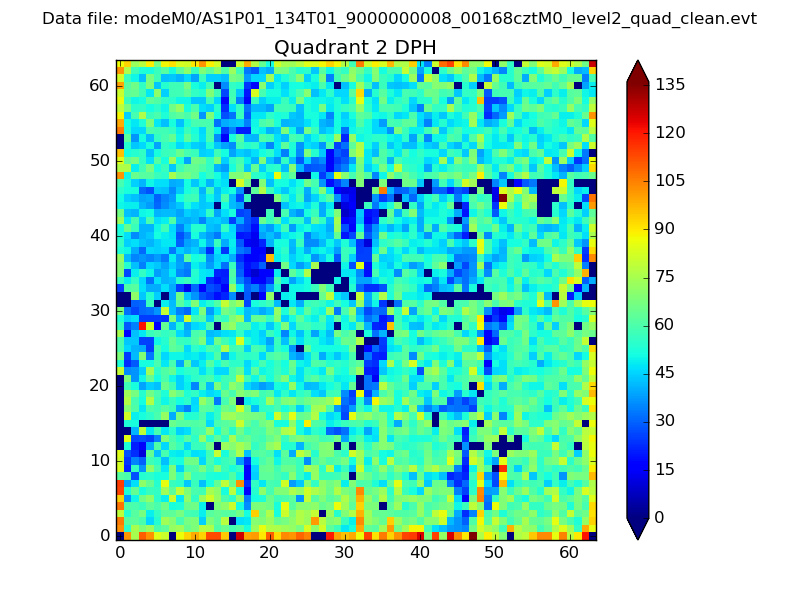
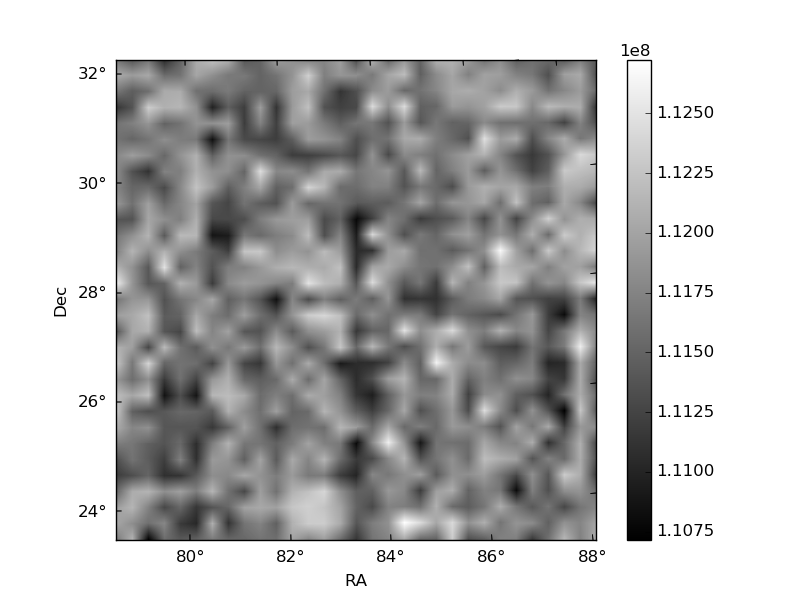
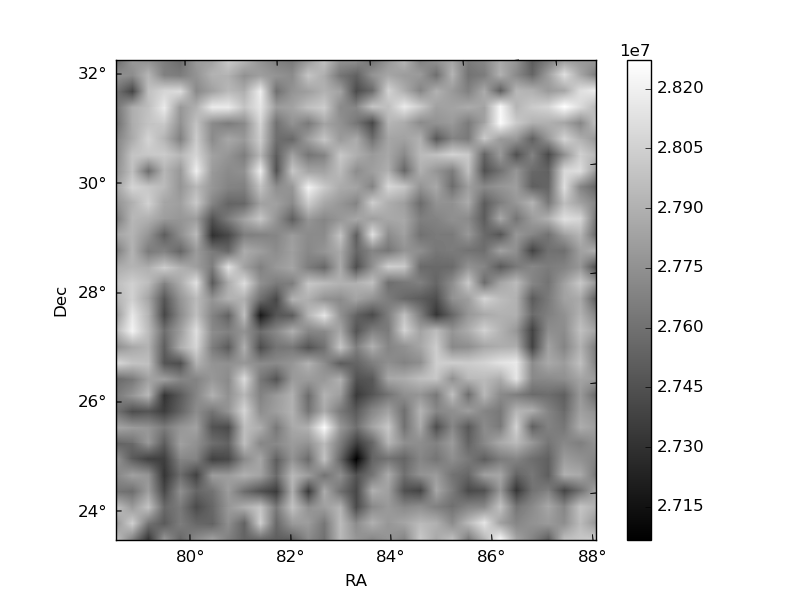
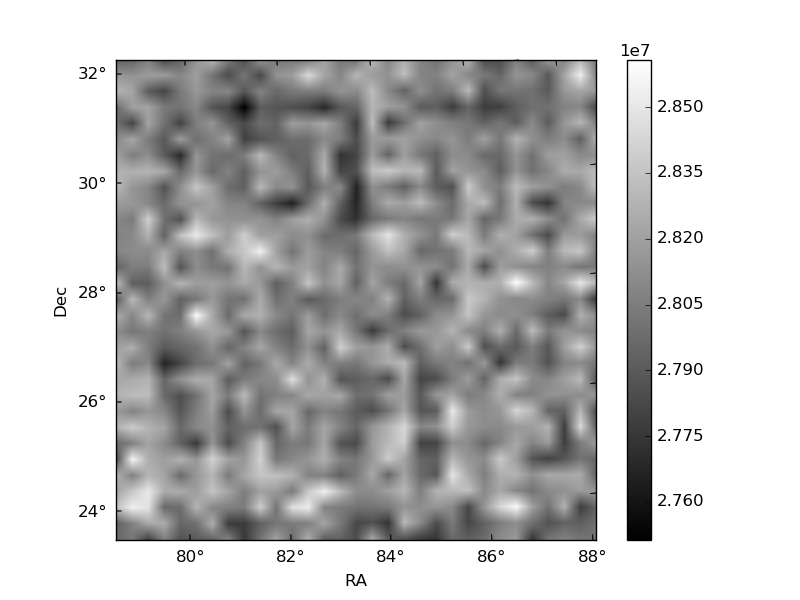
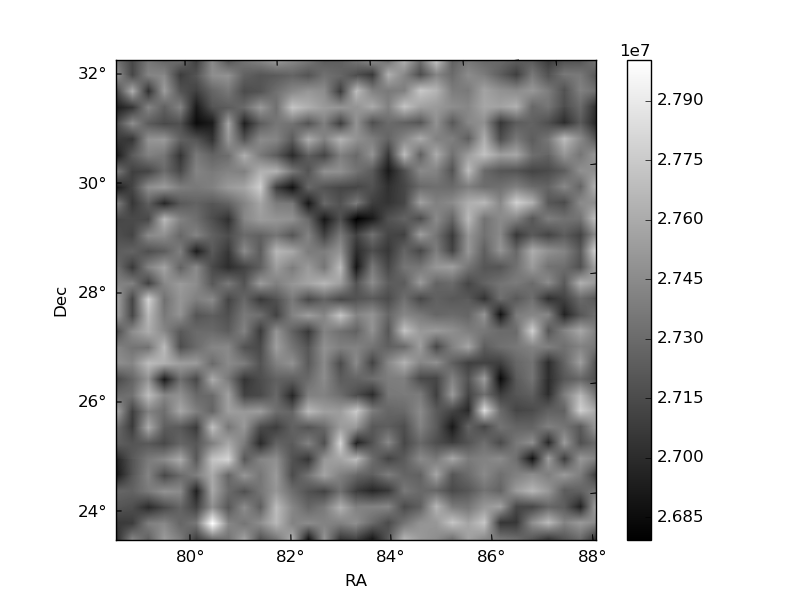
Histogram calculated using DETX and DETY for each event in the final _common_clean file
| Quadrant A | 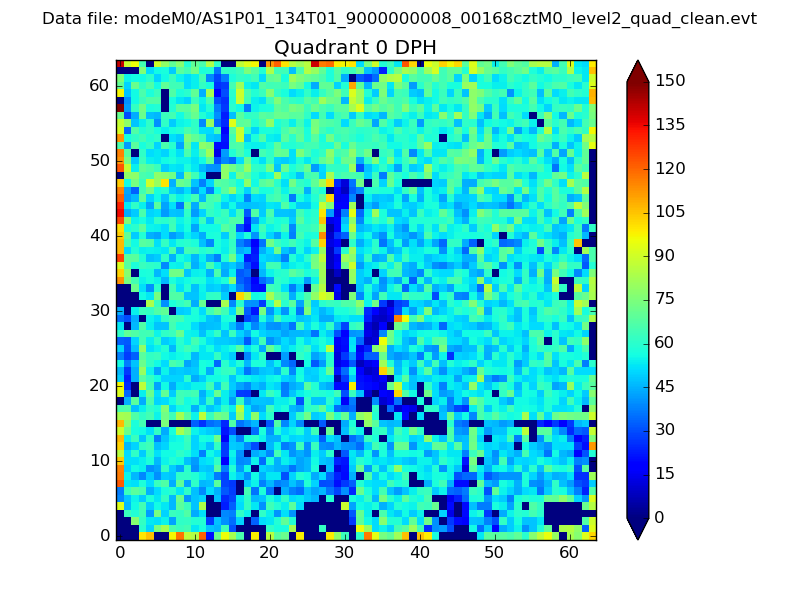 |
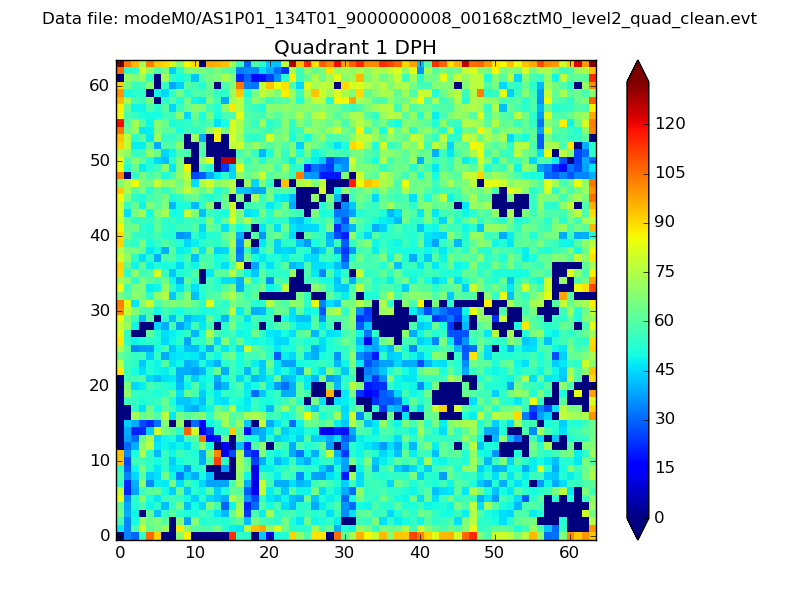 |
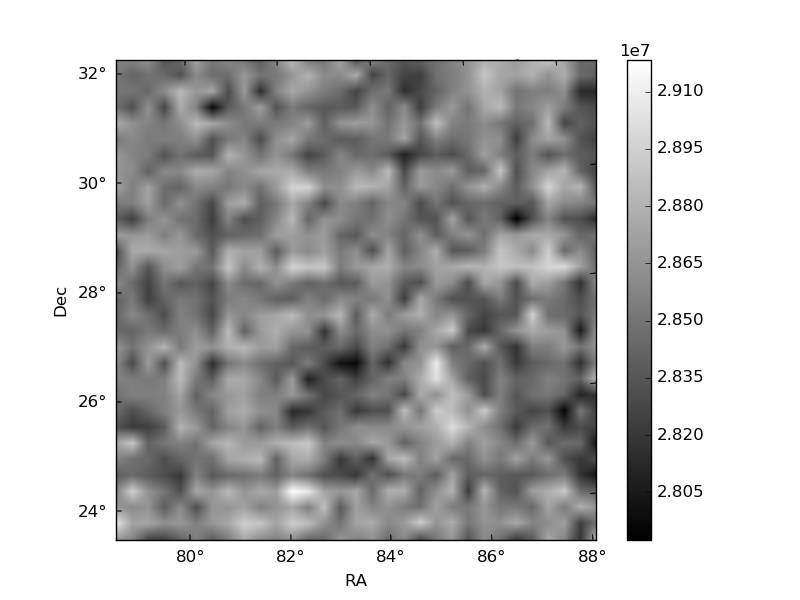
Quadrant B |
|---|---|---|---|
| Quadrant D | 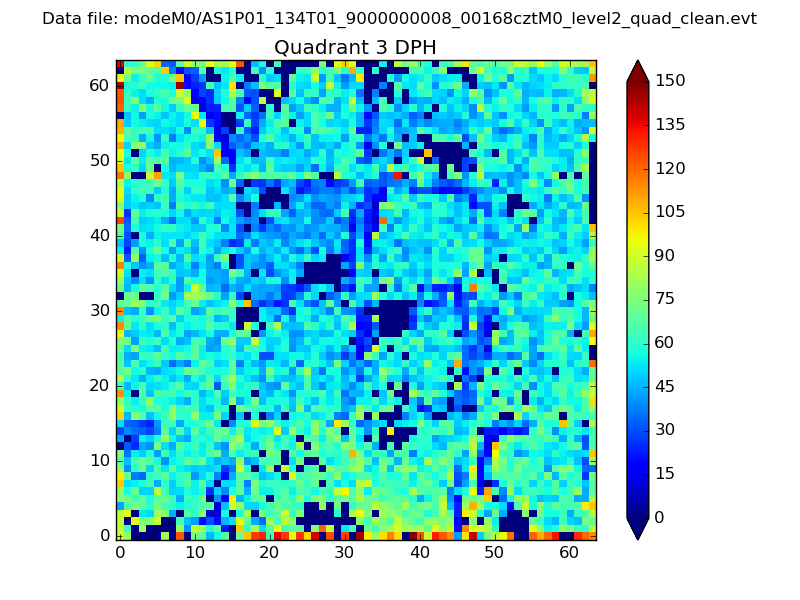 |
 |
Quadrant C |
| Plot type | Count rate plots | Images |
|---|---|---|
| Comparison with Poisson distribution Blue bars denote a histogram of data divided into 1 sec bins. Red curve is a Poisson curve with rate = median count rate of data. |
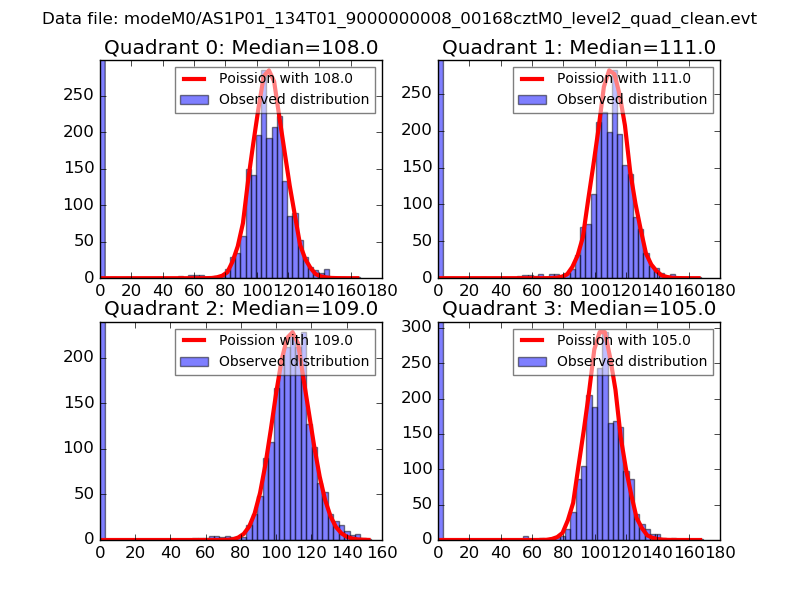 |
 |
| Quadrant-wise count rates Data is divided into 100 sec bins |
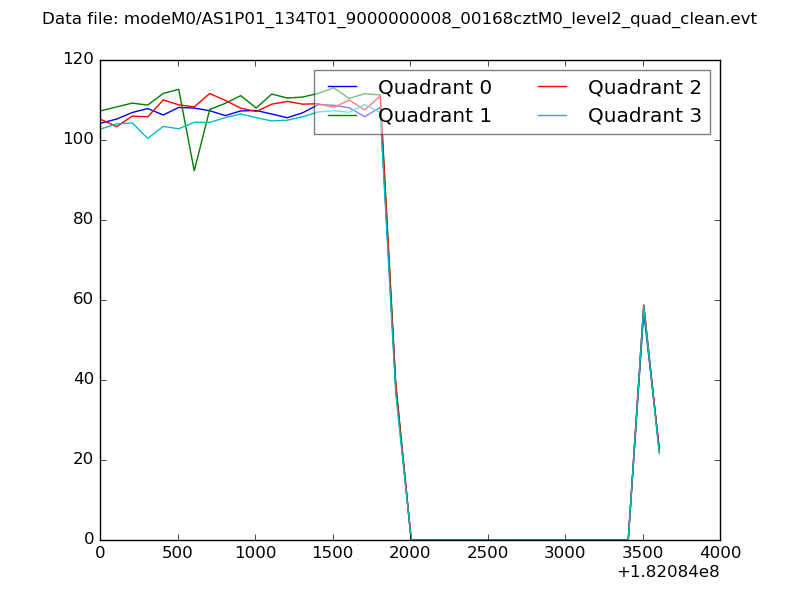 |
|
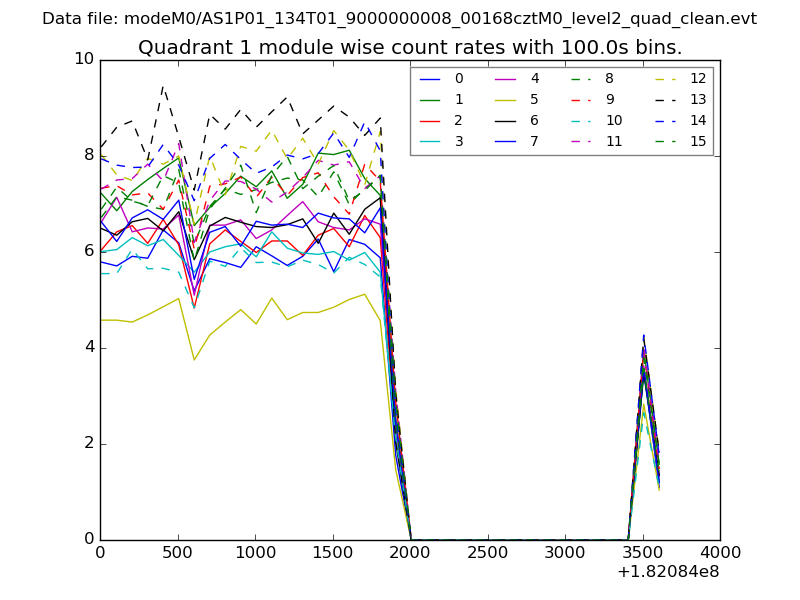
| Module-wise count rates for Quadrant A Data is divided into 100 sec bins |
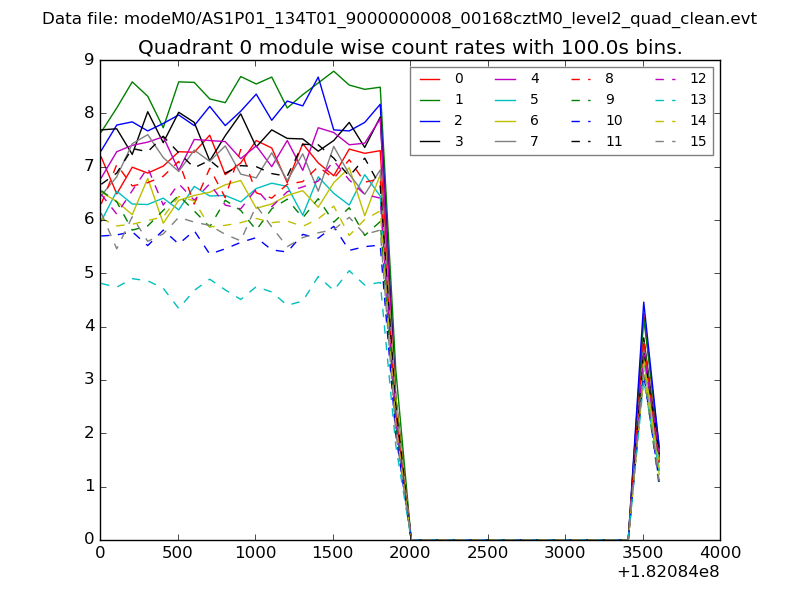 |
 |
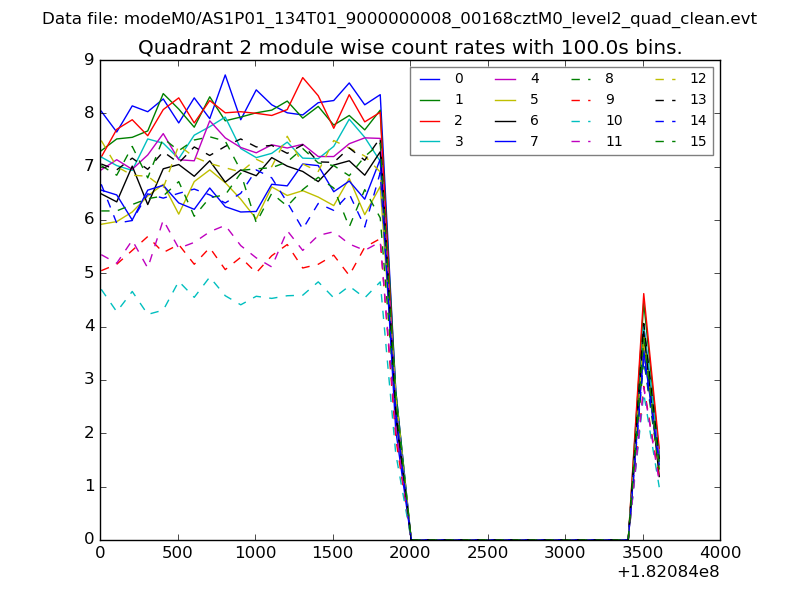
| Module-wise count rates for Quadrant B Data is divided into 100 sec bins |
 |
 |
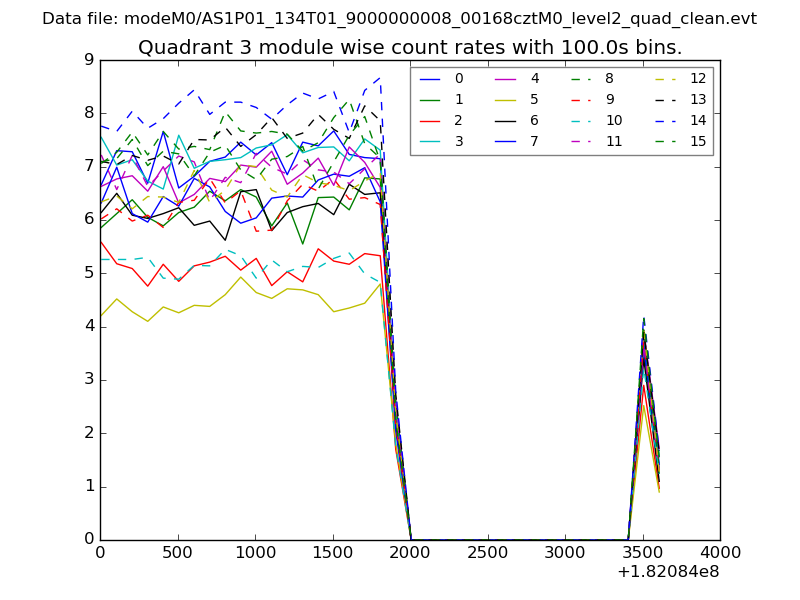
| Module-wise count rates for Quadrant C Data is divided into 100 sec bins |
 |
 |
| Module-wise count rates for Quadrant D Data is divided into 100 sec bins |
 |
 |
| Parameter | Plot |
|---|---|
| CZT HV Monitor | 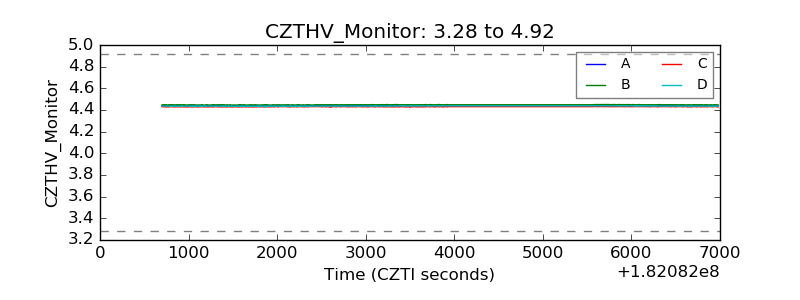 |
| D_VDD | 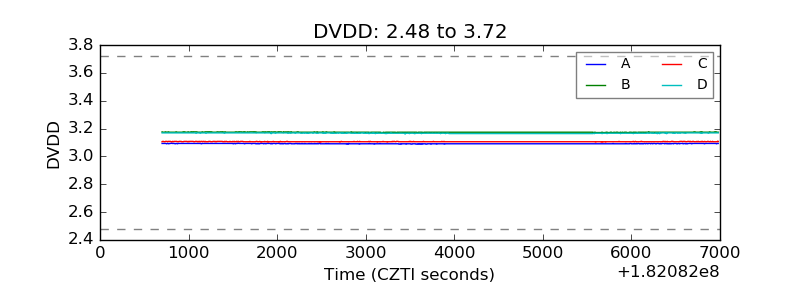 |
| Temperature 1 | 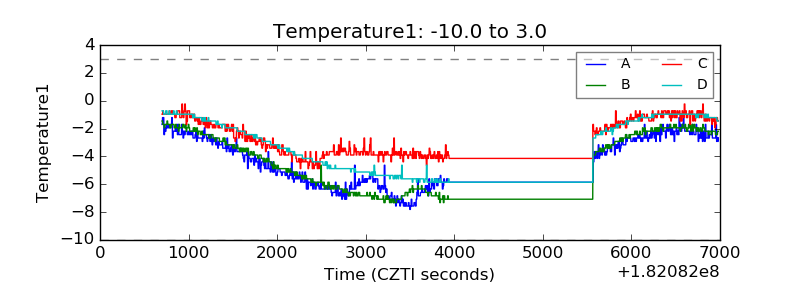 |
| Veto HV Monitor |  |
| Veto LLD | 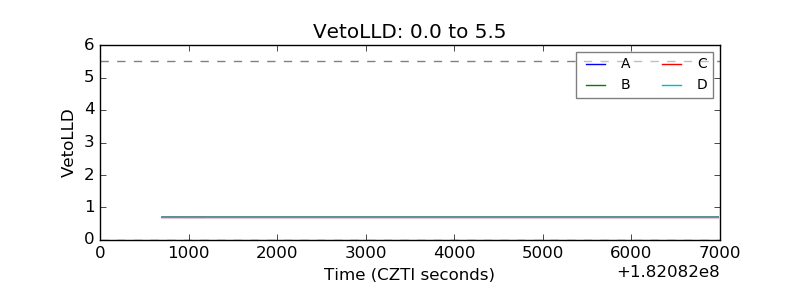 |
| Alpha Counter | 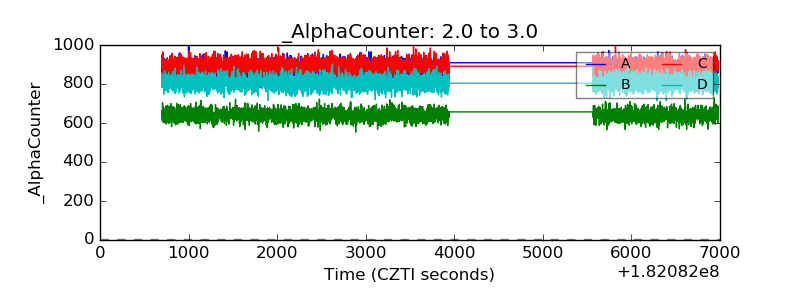 |
| _CPM_Rate | 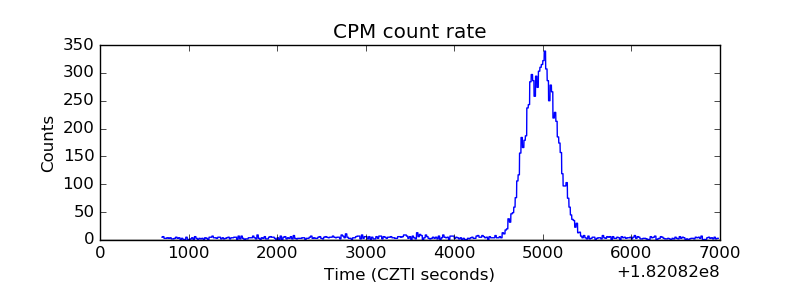 |
| CZT Counter | 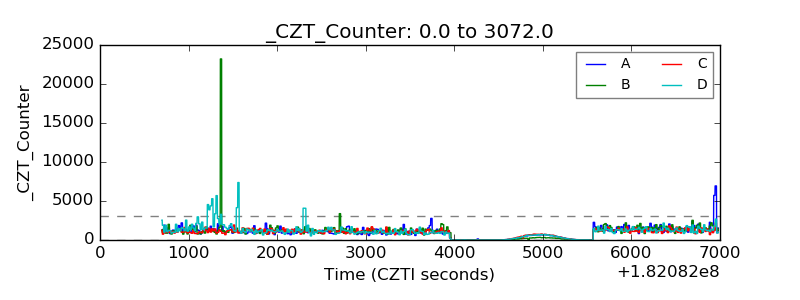 |
| +2.5 Volts monitor |  |
| +5 Volts monitor |  |
| _ROLL_ROT | 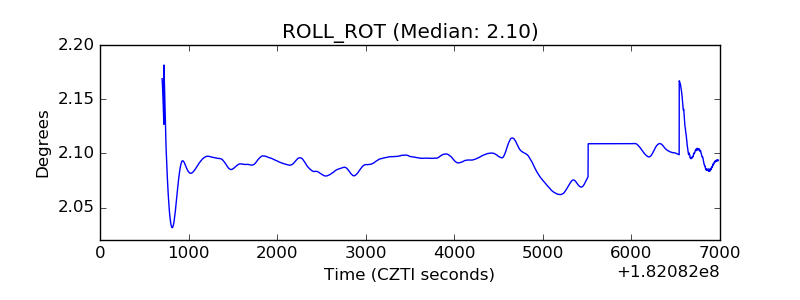 |
| _Roll_DEC | 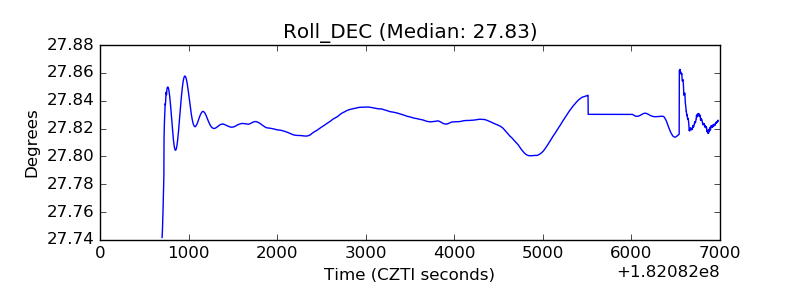 |
| _Roll_RA | 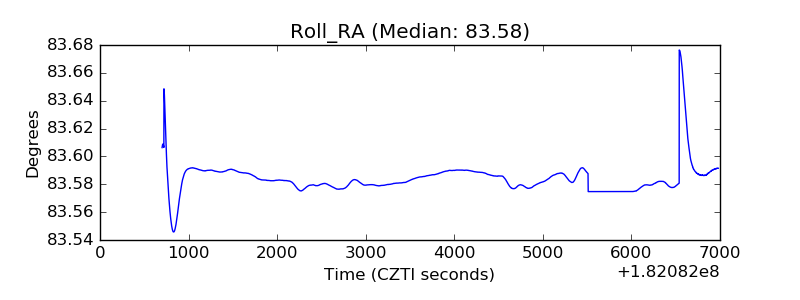 |
| Veto Counter | 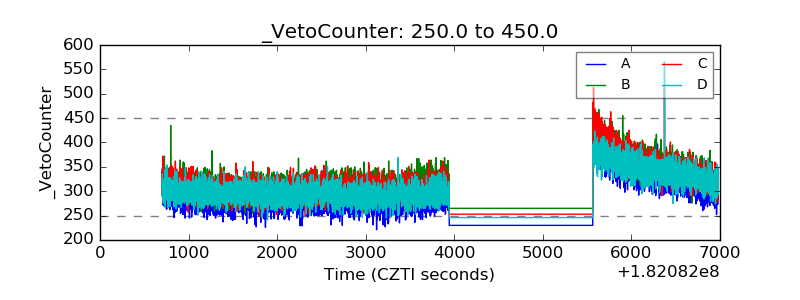 |