| Param | Original file | Final file |
|---|---|---|
| Filename | modeM0/AS1P01_134T01_9000000008_00174cztM0_level2.evt | modeM0/AS1P01_134T01_9000000008_00174cztM0_level2_quad_clean.evt |
| Size (bytes) | 675,959,040 | 46,074,240 |
| Size | 644.6 MB | 43.9 MB |
| Events in quadrant A | 5,003,396 | 273,327 |
| Events in quadrant B | 5,285,379 | 281,132 |
| Events in quadrant C | 4,707,149 | 276,237 |
| Events in quadrant D | 5,196,517 | 269,139 |
| Mode M0 | |||
|---|---|---|---|
| Quadrant | BADHDUFLAG | Total packets | Discarded packets |
| A | 0 | 17824 | 0 |
| B | 0 | 18679 | 0 |
| C | 0 | 16931 | 0 |
| D | 0 | 18414 | 0 |
| Mode SS | |||
|---|---|---|---|
| Quadrant | BADHDUFLAG | Total packets | Discarded packets |
| A | 0 | 84 | 0 |
| B | 0 | 84 | 0 |
| C | 0 | 84 | 0 |
| D | 0 | 84 | 0 |
| Quadrant | Total seconds | Saturated seconds | Saturation percentage |
|---|---|---|---|
| A | 4185 | 2 | 0.047790% |
| B | 4185 | 104 | 2.485066% |
| C | 4185 | 8 | 0.191159% |
| D | 4185 | 183 | 4.372760% |
Noise dominated data is calculated using 1-second bins in cleaned event files. If a bin has >2000 counts, and if more than 50% of those come from <1% of pixels, then it is considered to be noise-dominated and hence unusable.
| Quadrant | # 1 sec bins | Bins with >0 counts | Bins with >2000 counts | High rate bins dominated by noise | Noise dominated (total time) | Noise dominated (detector-on time) | Marked lightcurve |
|---|---|---|---|---|---|---|---|
| A | 4186 | 4186 | 117 | 117 | 2.80% | 2.80% | 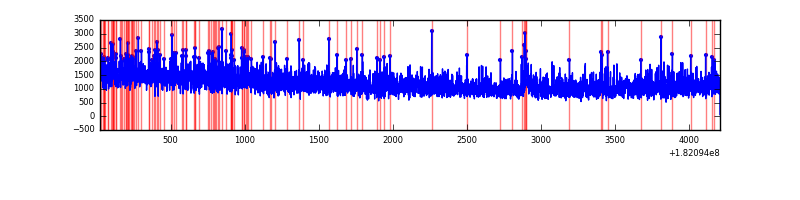 |
| B | 4186 | 4186 | 219 | 219 | 5.23% | 5.23% | 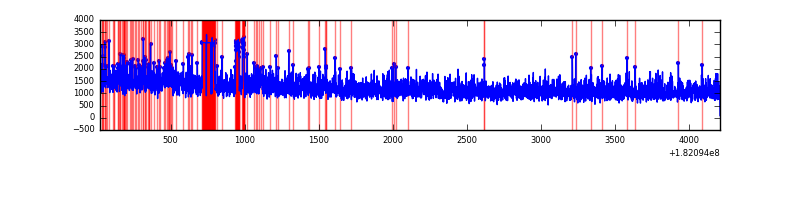 |
| C | 4186 | 4186 | 57 | 57 | 1.36% | 1.36% | 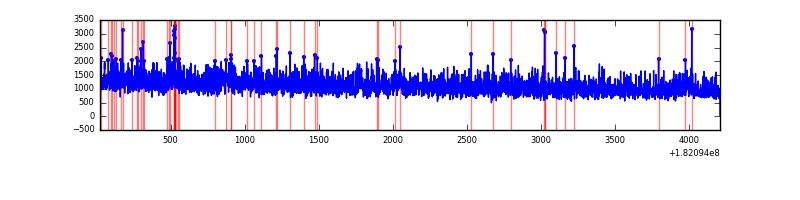 |
| D | 4186 | 4186 | 322 | 322 | 7.69% | 7.69% | 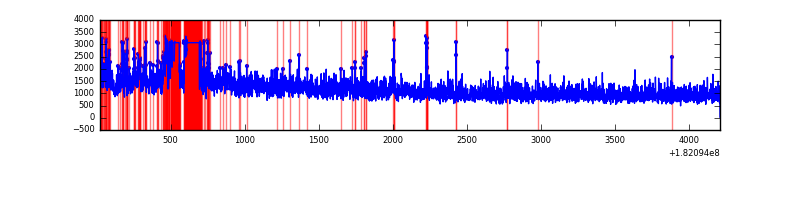 |
Top three noisy pixels from each quadrant. If the there are fewer than three noisy pixels in the level2.evt file, extra rows are filled as -1
| Pixel properties | Quadrant properties | ||||||
|---|---|---|---|---|---|---|---|
| Quadrant | DetID | PixID | Counts | Sigma | Mean | Median | Sigma |
| A | 14 | 171 | 26708 | 90.17 | 1269 | 1263 | 282.2 |
| A | 5 | 244 | 15466 | 50.33 | 1269 | 1263 | 282.2 |
| A | 14 | 10 | 11500 | 36.28 | 1269 | 1263 | 282.2 |
| B | 8 | 5 | 323670 | 1081.83 | 1271 | 1275 | 298.0 |
| B | 10 | 199 | 34576 | 111.75 | 1271 | 1275 | 298.0 |
| B | 5 | 216 | 28845 | 92.51 | 1271 | 1275 | 298.0 |
| C | 0 | 202 | 19057 | 54.0 | 1178 | 1225 | 330.2 |
| C | 0 | 186 | 18725 | 53.0 | 1178 | 1225 | 330.2 |
| C | 7 | 254 | 16003 | 44.75 | 1178 | 1225 | 330.2 |
| D | 2 | 121 | 567567 | 1654.97 | 1126 | 1165 | 342.2 |
| D | 12 | 14 | 44570 | 126.83 | 1126 | 1165 | 342.2 |
| D | 14 | 53 | 42337 | 120.3 | 1126 | 1165 | 342.2 |
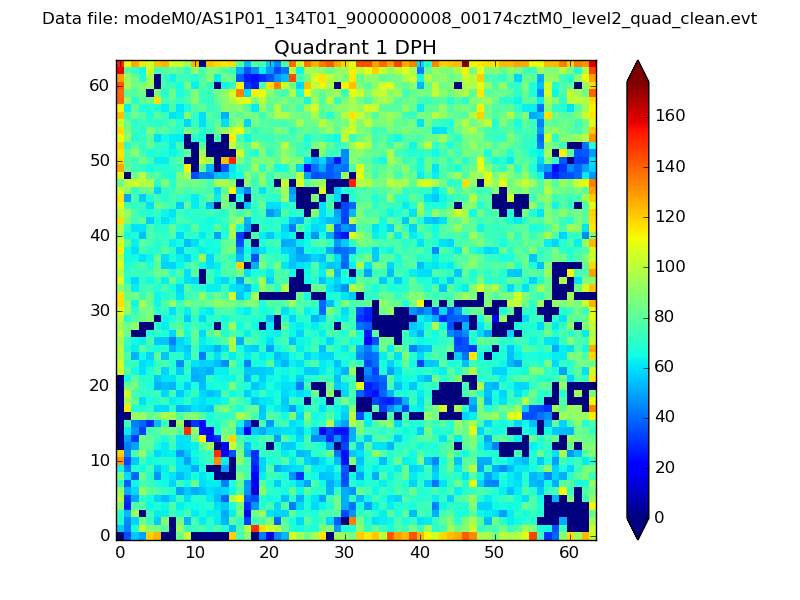
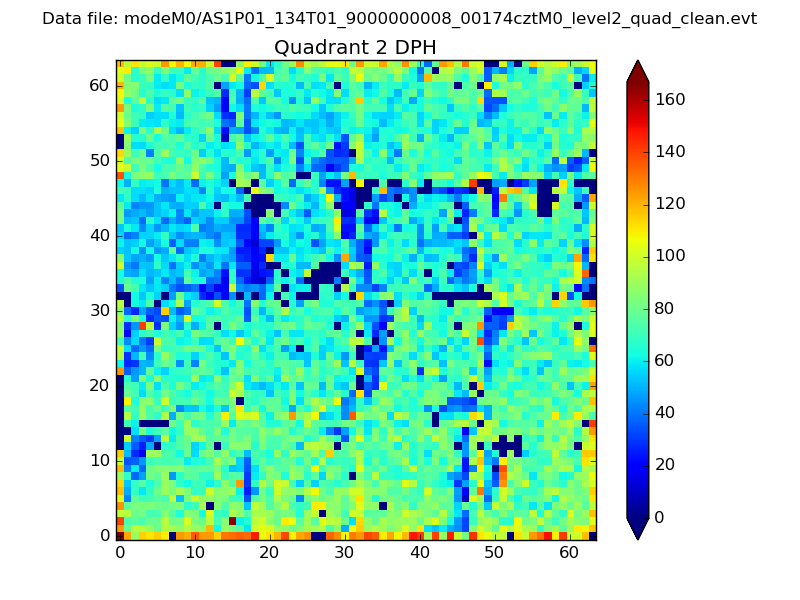
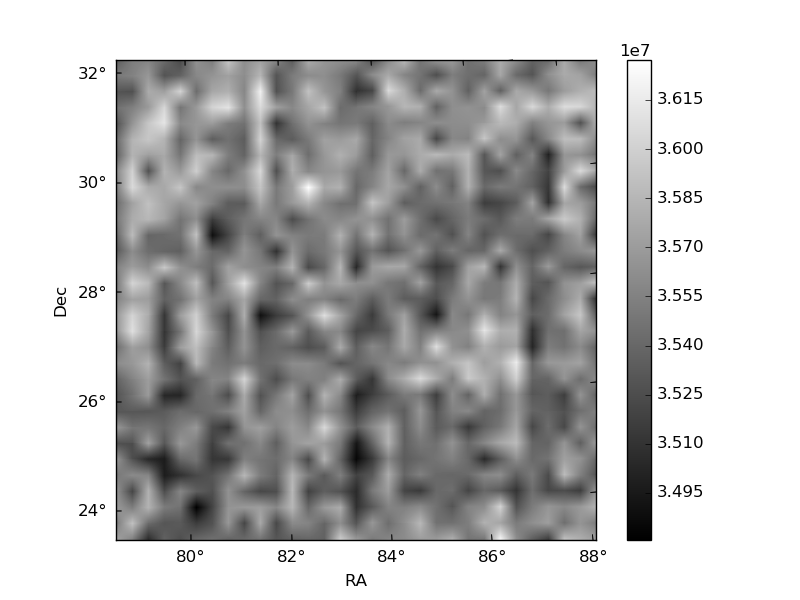
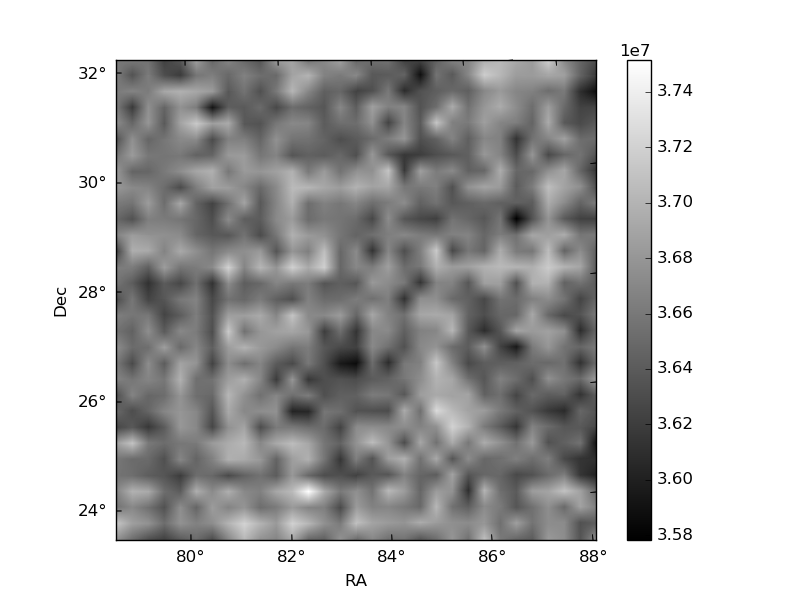
Histogram calculated using DETX and DETY for each event in the final _common_clean file
| Quadrant A |  |
 |
Quadrant B |
|---|---|---|---|
| Quadrant D | 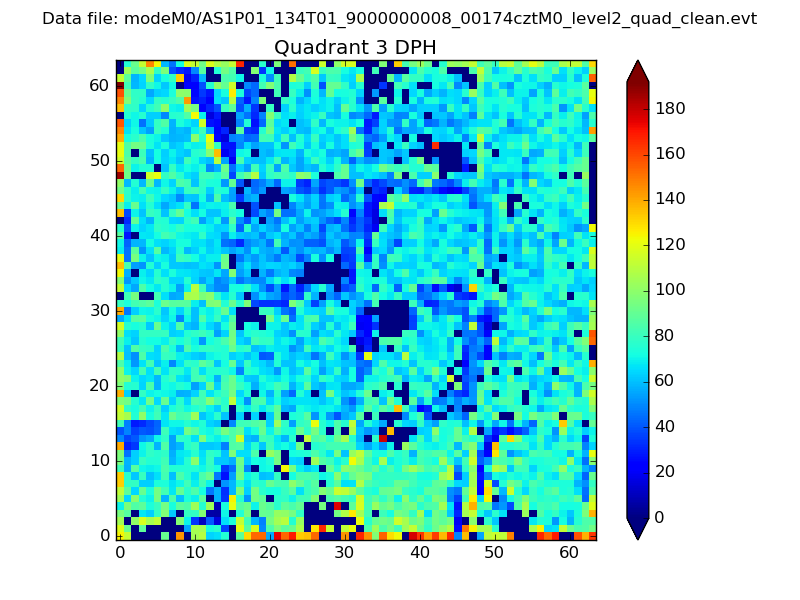 |
 |
Quadrant C |
| Plot type | Count rate plots | Images |
|---|---|---|
| Comparison with Poisson distribution Blue bars denote a histogram of data divided into 1 sec bins. Red curve is a Poisson curve with rate = median count rate of data. |
 |
 |
| Quadrant-wise count rates Data is divided into 100 sec bins |
 |
|
| Module-wise count rates for Quadrant A Data is divided into 100 sec bins |
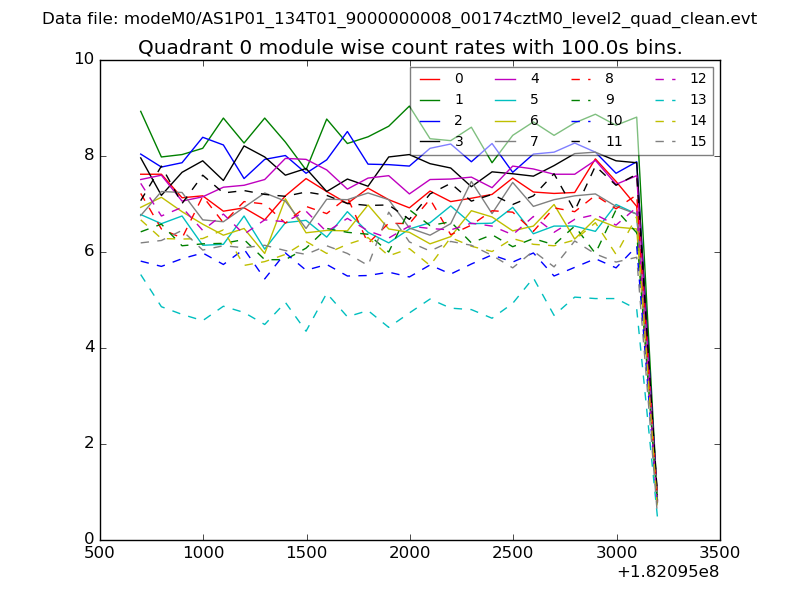 |
 |
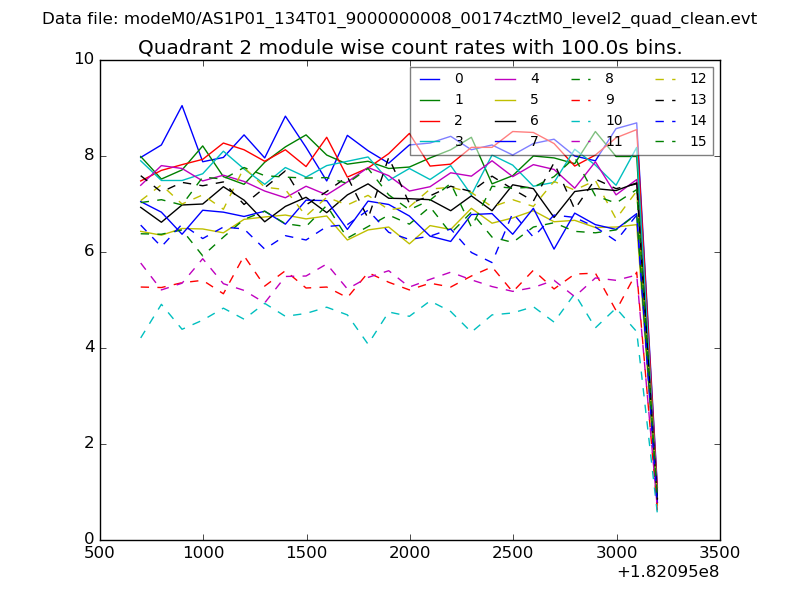
| Module-wise count rates for Quadrant B Data is divided into 100 sec bins |
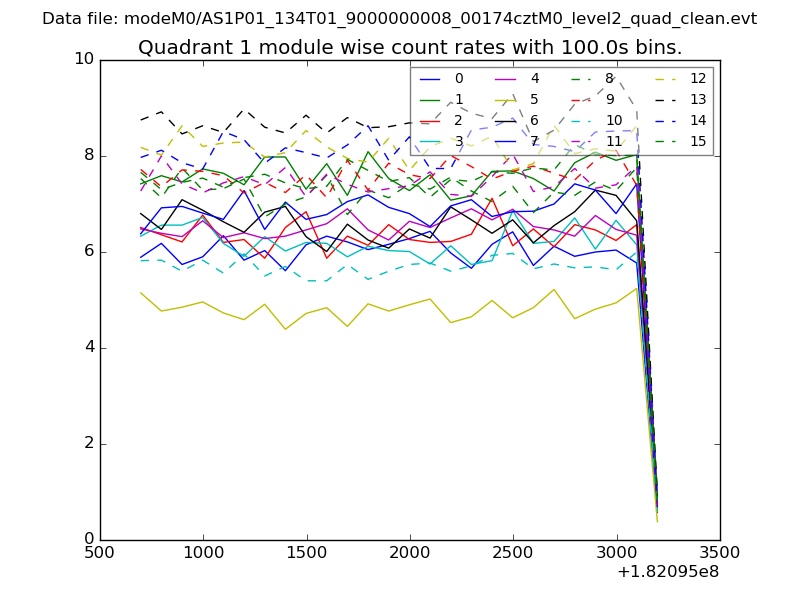 |
 |
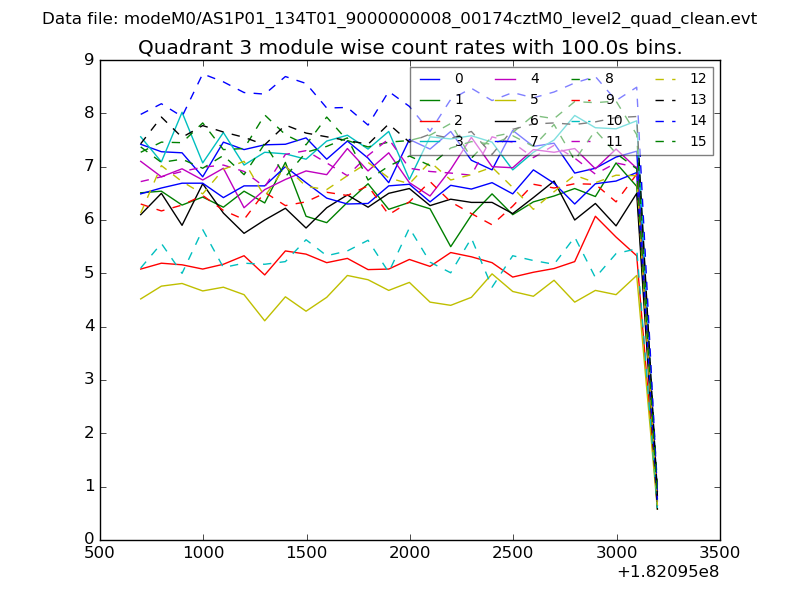
| Module-wise count rates for Quadrant C Data is divided into 100 sec bins |
 |
 |
| Module-wise count rates for Quadrant D Data is divided into 100 sec bins |
 |
 |
| Parameter | Plot |
|---|---|
| CZT HV Monitor | 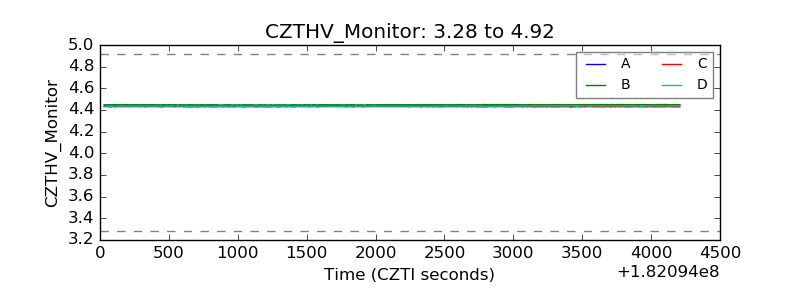 |
| D_VDD | 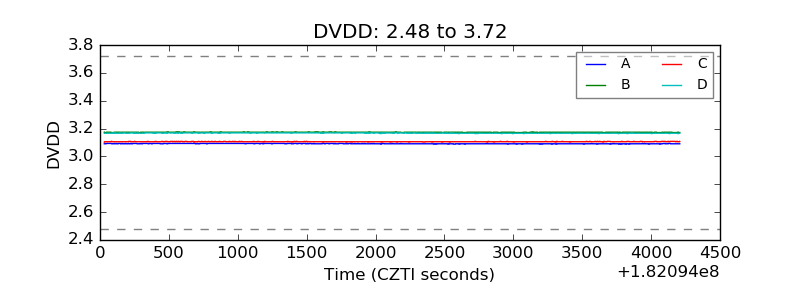 |
| Temperature 1 | 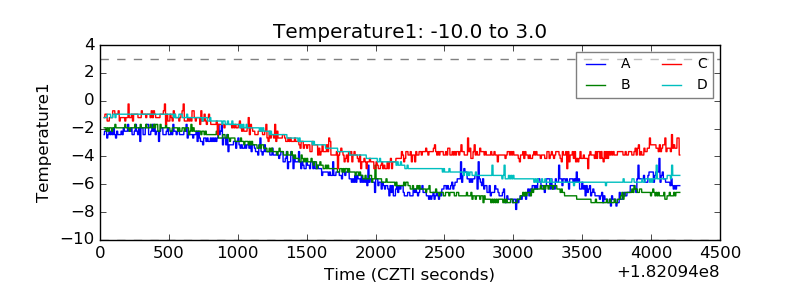 |
| Veto HV Monitor | 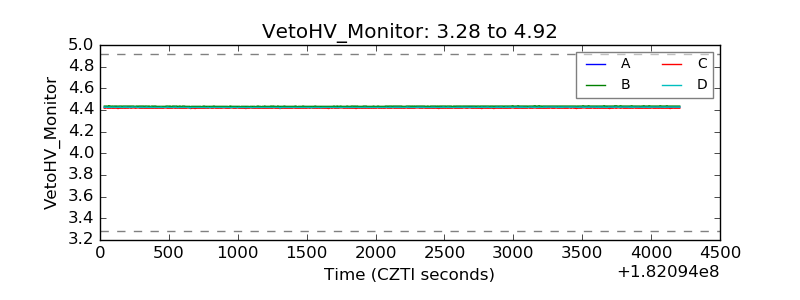 |
| Veto LLD | 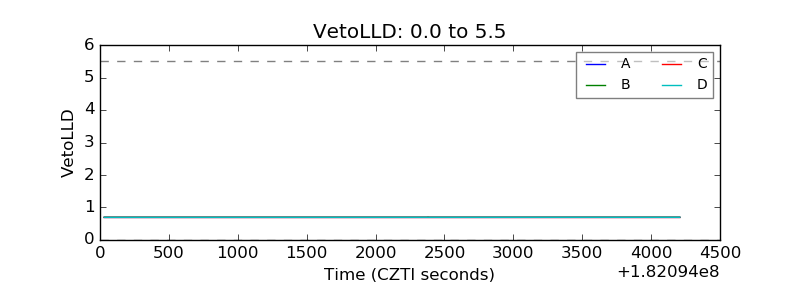 |
| Alpha Counter | 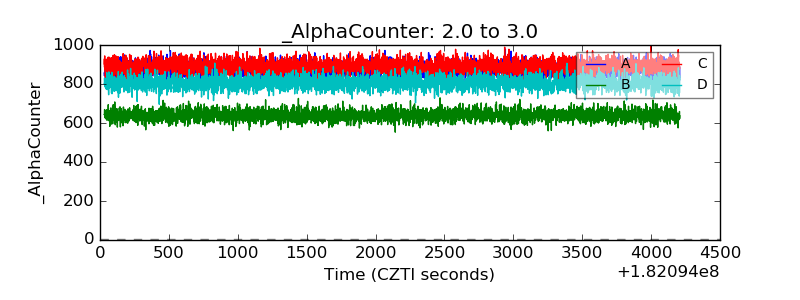 |
| _CPM_Rate |  |
| CZT Counter | 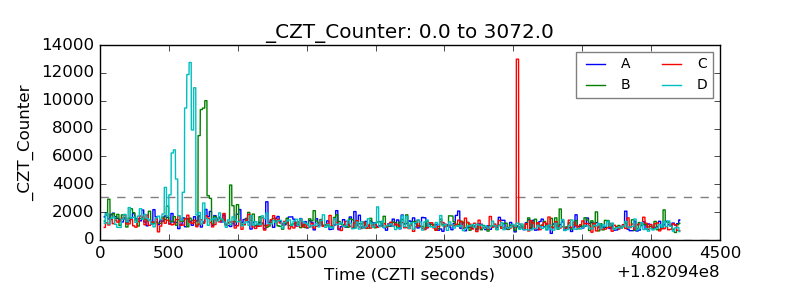 |
| +2.5 Volts monitor | 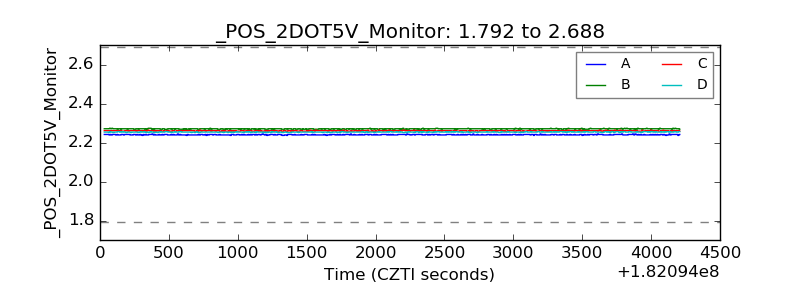 |
| +5 Volts monitor |  |
| _ROLL_ROT | 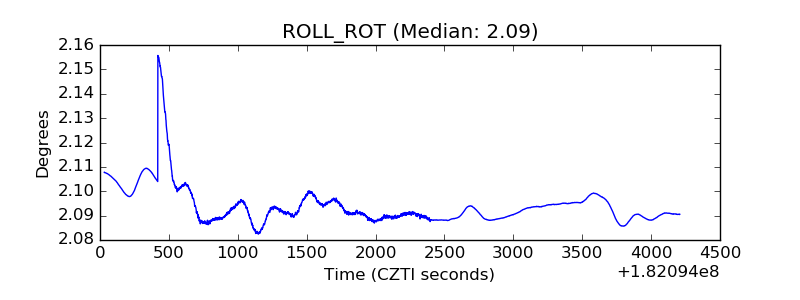 |
| _Roll_DEC | 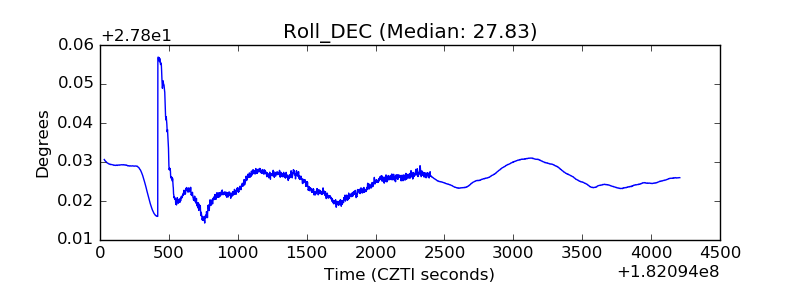 |
| _Roll_RA | 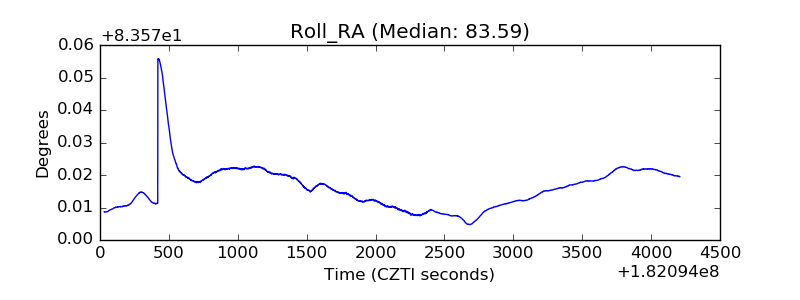 |
| Veto Counter | 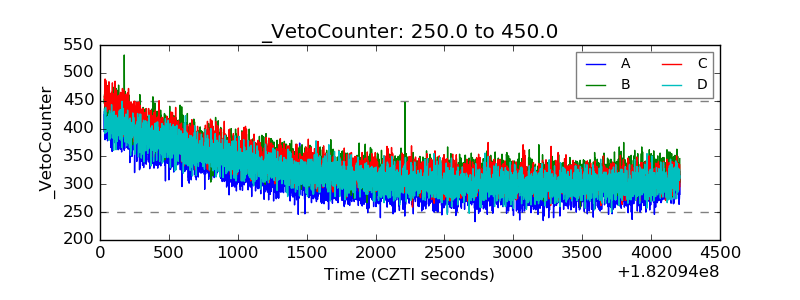 |