| Param | Original file | Final file |
|---|---|---|
| Filename | modeM0/AS1P01_134T02_9000000010cztM0_level2.fits | modeM0/AS1P01_134T02_9000000010cztM0_level2_quad_clean.evt |
| Size (bytes) | 131,690,880 | 38,822,400 |
| Size | 125.6 MB | 37.0 MB |
| Events in quadrant A | 800,174 | 17,252 |
| Events in quadrant B | 615,182 | 17,932 |
| Events in quadrant C | 816,022 | 17,250 |
| Events in quadrant D | 647,406 | 14,206 |
| Mode SS | |||
|---|---|---|---|
| Quadrant | BADHDUFLAG | Total packets | Discarded packets |
| A | 0 | 328 | 0 |
| B | 0 | 328 | 0 |
| C | 0 | 328 | 0 |
| D | 0 | 328 | 0 |
| Mode M9 | |||
|---|---|---|---|
| Quadrant | BADHDUFLAG | Total packets | Discarded packets |
| A | 0 | 63 | 0 |
| B | 0 | 63 | 0 |
| C | 0 | 63 | 0 |
| D | 0 | 63 | 0 |
| Mode M0 | |||
|---|---|---|---|
| Quadrant | BADHDUFLAG | Total packets | Discarded packets |
| A | 0 | 68725 | 0 |
| B | 0 | 102873 | 0 |
| C | 0 | 65211 | 0 |
| D | 0 | 80355 | 0 |
| Quadrant | Total seconds | Saturated seconds | Saturation percentage |
|---|---|---|---|
| A | 16041 | 24 | 0.149617% |
| B | 16037 | 4561 | 28.440481% |
| C | 16038 | 26 | 0.162115% |
| D | 16040 | 1436 | 8.952618% |
Noise dominated data is calculated using 1-second bins in cleaned event files. If a bin has >2000 counts, and if more than 50% of those come from <1% of pixels, then it is considered to be noise-dominated and hence unusable.
| Quadrant | # 1 sec bins | Bins with >0 counts | Bins with >2000 counts | High rate bins dominated by noise | Noise dominated (total time) | Noise dominated (detector-on time) | Marked lightcurve |
|---|---|---|---|---|---|---|---|
| A | 20871 | 16035 | 0 | 0 | 0.00% | 0.00% | 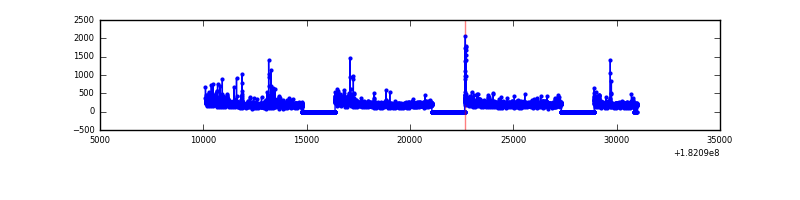 |
| B | 20875 | 15167 | 0 | 0 | 0.00% | 0.00% |  |
| C | 20873 | 16034 | 0 | 0 | 0.00% | 0.00% |  |
| D | 20870 | 15971 | 0 | 0 | 0.00% | 0.00% | 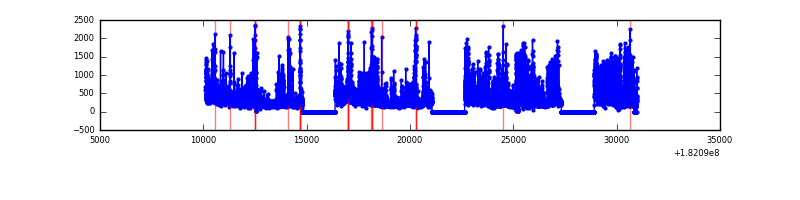 |
Top three noisy pixels from each quadrant. If the there are fewer than three noisy pixels in the level2.evt file, extra rows are filled as -1
| Pixel properties | Quadrant properties | ||||||
|---|---|---|---|---|---|---|---|
| Quadrant | DetID | PixID | Counts | Sigma | Mean | Median | Sigma |
| A | 7 | 110 | 773 | 11.45 | 208 | 196 | 50.4 |
| A | 0 | 29 | 629 | 8.6 | 208 | 196 | 50.4 |
| A | 14 | 30 | 560 | 7.23 | 208 | 196 | 50.4 |
| B | 2 | 9 | 537 | 12.01 | 163 | 156 | 31.7 |
| B | 5 | 225 | 407 | 7.91 | 163 | 156 | 31.7 |
| B | 3 | 17 | 398 | 7.63 | 163 | 156 | 31.7 |
| C | 3 | 203 | 727 | 9.45 | 216 | 200 | 55.7 |
| C | 3 | 202 | 612 | 7.39 | 216 | 200 | 55.7 |
| C | 12 | 241 | 553 | 6.33 | 216 | 200 | 55.7 |
| D | 6 | 231 | 512 | 7.28 | 186 | 172 | 46.7 |
| D | 11 | 82 | 496 | 6.94 | 186 | 172 | 46.7 |
| D | 6 | 44 | 483 | 6.66 | 186 | 172 | 46.7 |
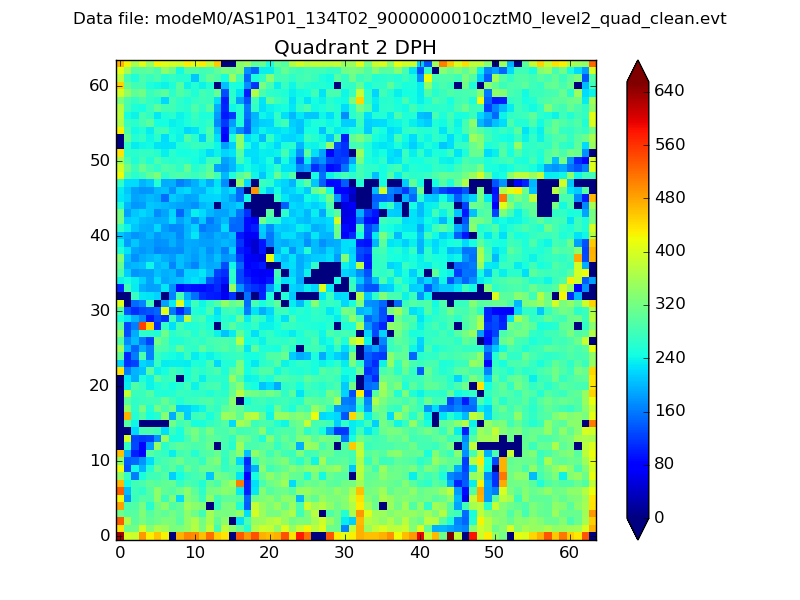
Histogram calculated using DETX and DETY for each event in the final _common_clean file
| Quadrant A |  |
 |
Quadrant B |
|---|---|---|---|
| Quadrant D |  |
 |
Quadrant C |
| Plot type | Count rate plots | Images |
|---|---|---|
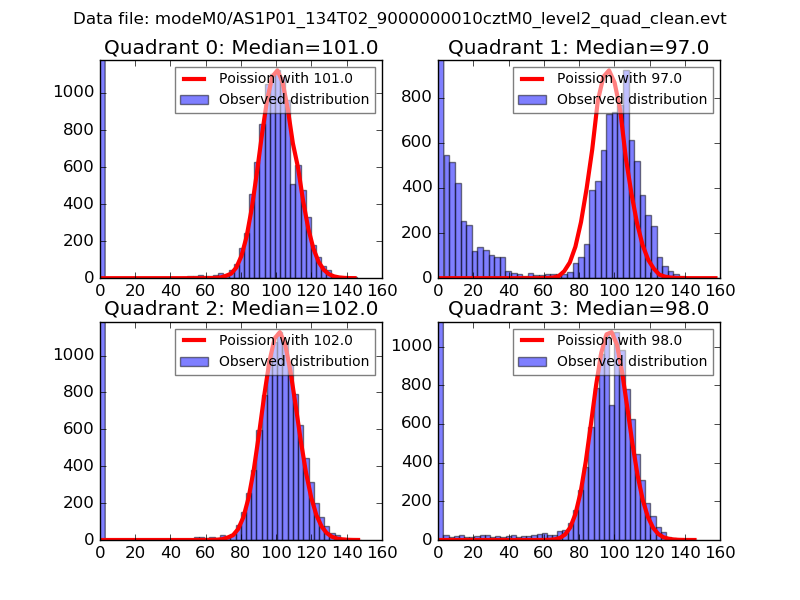
| Comparison with Poisson distribution Blue bars denote a histogram of data divided into 1 sec bins. Red curve is a Poisson curve with rate = median count rate of data. |
 |
 |
| Quadrant-wise count rates Data is divided into 100 sec bins |
 |
|
| Module-wise count rates for Quadrant A Data is divided into 100 sec bins |
 |
 |
| Module-wise count rates for Quadrant B Data is divided into 100 sec bins |
 |
 |
| Module-wise count rates for Quadrant C Data is divided into 100 sec bins |
 |
 |
| Module-wise count rates for Quadrant D Data is divided into 100 sec bins |
 |
 |
| Parameter | Plot |
|---|---|
| CZT HV Monitor |  |
| D_VDD |  |
| Temperature 1 |  |
| Veto HV Monitor |  |
| Veto LLD |  |
| Alpha Counter |  |
| _CPM_Rate |  |
| CZT Counter |  |
| +2.5 Volts monitor |  |
| +5 Volts monitor |  |
| _ROLL_ROT |  |
| _Roll_DEC |  |
| _Roll_RA |  |
| Veto Counter |  |