| Param | Original file | Final file |
|---|---|---|
| Filename | modeM0/AS1P01_134T02_9000000010_00174cztM0_level2.evt | modeM0/AS1P01_134T02_9000000010_00174cztM0_level2_quad_clean.evt |
| Size (bytes) | 2,899,379,520 | 153,057,600 |
| Size | 2.7 GB | 146.0 MB |
| Events in quadrant A | 18,407,193 | 960,495 |
| Events in quadrant B | 29,636,925 | 759,632 |
| Events in quadrant C | 17,208,322 | 982,996 |
| Events in quadrant D | 21,559,175 | 885,069 |
| Mode SS | |||
|---|---|---|---|
| Quadrant | BADHDUFLAG | Total packets | Discarded packets |
| A | 0 | 308 | 0 |
| B | 0 | 308 | 0 |
| C | 0 | 308 | 0 |
| D | 0 | 308 | 0 |
| Mode M9 | |||
|---|---|---|---|
| Quadrant | BADHDUFLAG | Total packets | Discarded packets |
| A | 0 | 63 | 0 |
| B | 0 | 63 | 0 |
| C | 0 | 63 | 0 |
| D | 0 | 63 | 0 |
| Mode M0 | |||
|---|---|---|---|
| Quadrant | BADHDUFLAG | Total packets | Discarded packets |
| A | 0 | 65439 | 5 |
| B | 0 | 99476 | 4 |
| C | 0 | 61909 | 4 |
| D | 0 | 74929 | 4 |
| Quadrant | Total seconds | Saturated seconds | Saturation percentage |
|---|---|---|---|
| A | 15154 | 24 | 0.158374% |
| B | 15154 | 4561 | 30.097664% |
| C | 15154 | 26 | 0.171572% |
| D | 15154 | 1151 | 7.595354% |
Noise dominated data is calculated using 1-second bins in cleaned event files. If a bin has >2000 counts, and if more than 50% of those come from <1% of pixels, then it is considered to be noise-dominated and hence unusable.
| Quadrant | # 1 sec bins | Bins with >0 counts | Bins with >2000 counts | High rate bins dominated by noise | Noise dominated (total time) | Noise dominated (detector-on time) | Marked lightcurve |
|---|---|---|---|---|---|---|---|
| A | 19927 | 15156 | 508 | 508 | 2.55% | 3.35% | 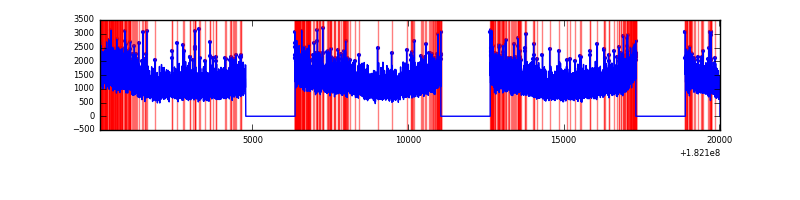 |
| B | 19926 | 15156 | 5869 | 5869 | 29.45% | 38.72% | 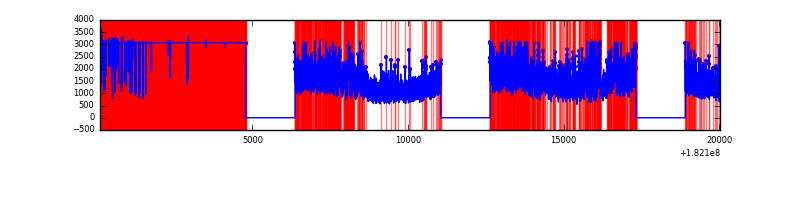 |
| C | 19926 | 15157 | 290 | 290 | 1.46% | 1.91% | 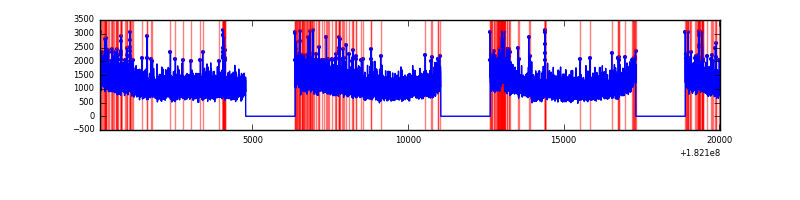 |
| D | 19926 | 15157 | 2305 | 2305 | 11.57% | 15.21% | 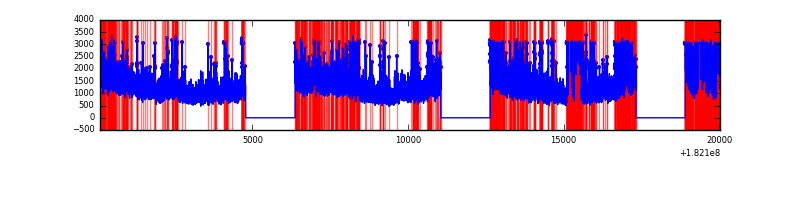 |
Top three noisy pixels from each quadrant. If the there are fewer than three noisy pixels in the level2.evt file, extra rows are filled as -1
| Pixel properties | Quadrant properties | ||||||
|---|---|---|---|---|---|---|---|
| Quadrant | DetID | PixID | Counts | Sigma | Mean | Median | Sigma |
| A | 14 | 10 | 169953 | 165.78 | 4644 | 4610 | 997.4 |
| A | 14 | 171 | 115346 | 111.03 | 4644 | 4610 | 997.4 |
| A | 0 | 96 | 32169 | 27.63 | 4644 | 4610 | 997.4 |
| B | 8 | 233 | 8801145 | 10294.7 | 3683 | 3704 | 854.6 |
| B | 5 | 216 | 6101867 | 7136.02 | 3683 | 3704 | 854.6 |
| B | 10 | 199 | 479836 | 557.17 | 3683 | 3704 | 854.6 |
| C | 0 | 202 | 143083 | 116.74 | 4268 | 4425 | 1187.8 |
| C | 12 | 48 | 112021 | 90.58 | 4268 | 4425 | 1187.8 |
| C | 8 | 31 | 39605 | 29.62 | 4268 | 4425 | 1187.8 |
| D | 2 | 121 | 2225798 | 1815.0 | 4075 | 4204 | 1224.0 |
| D | 13 | 89 | 2169347 | 1768.88 | 4075 | 4204 | 1224.0 |
| D | 12 | 14 | 363982 | 293.93 | 4075 | 4204 | 1224.0 |
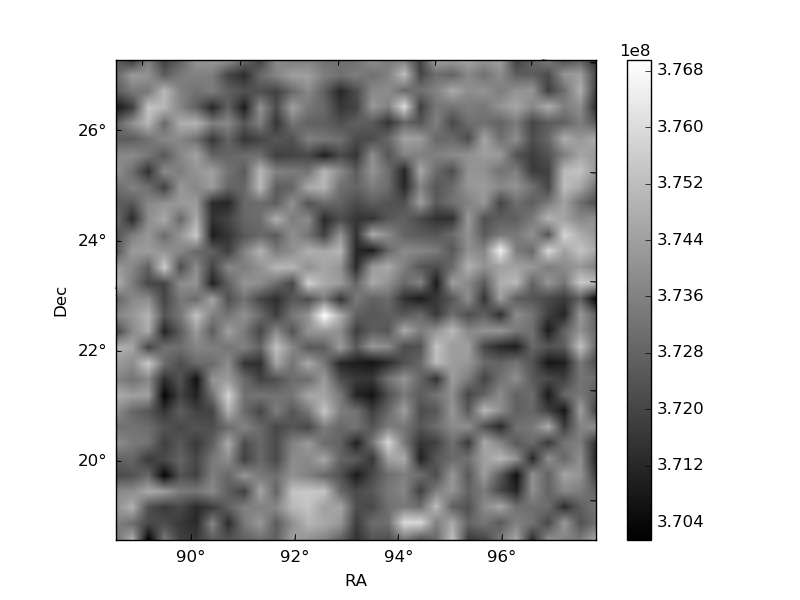
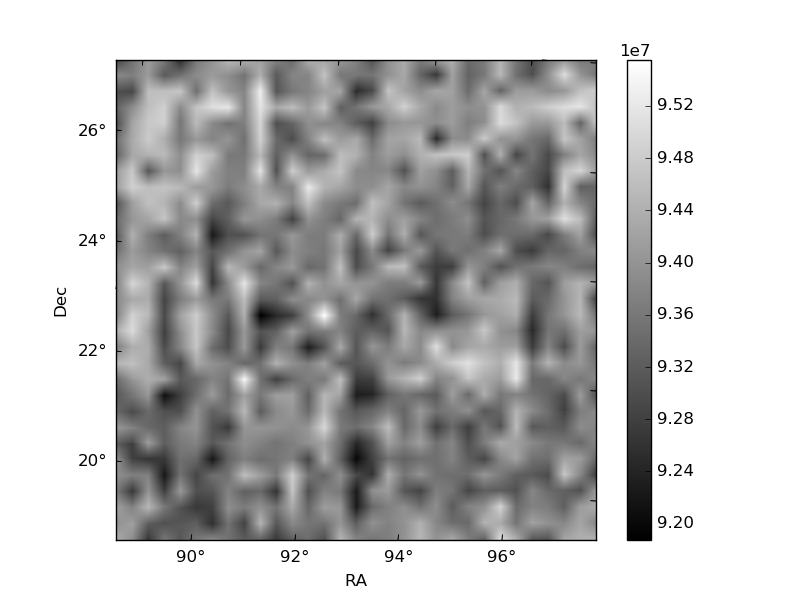
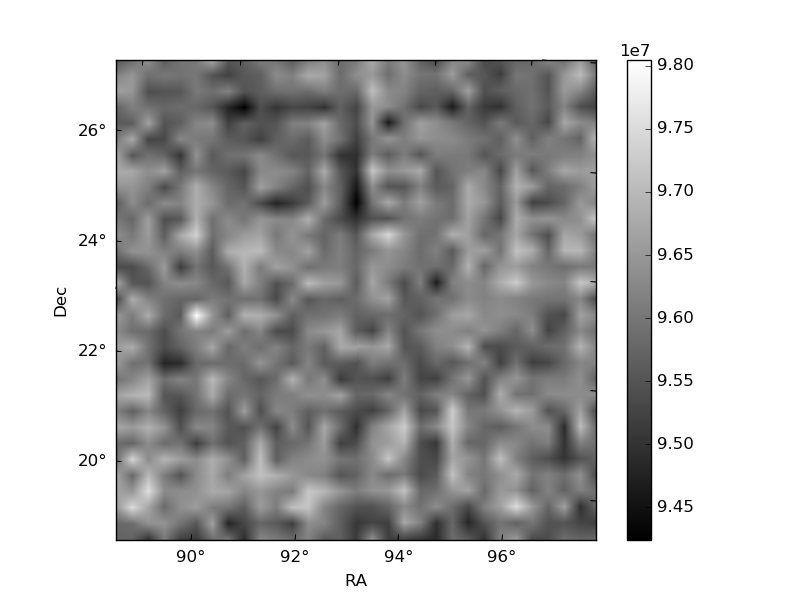
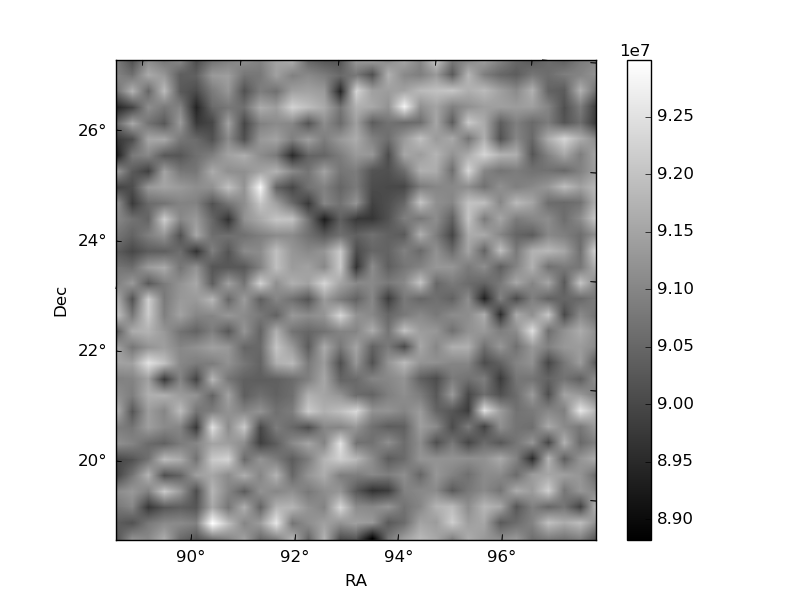
Histogram calculated using DETX and DETY for each event in the final _common_clean file
| Quadrant A | 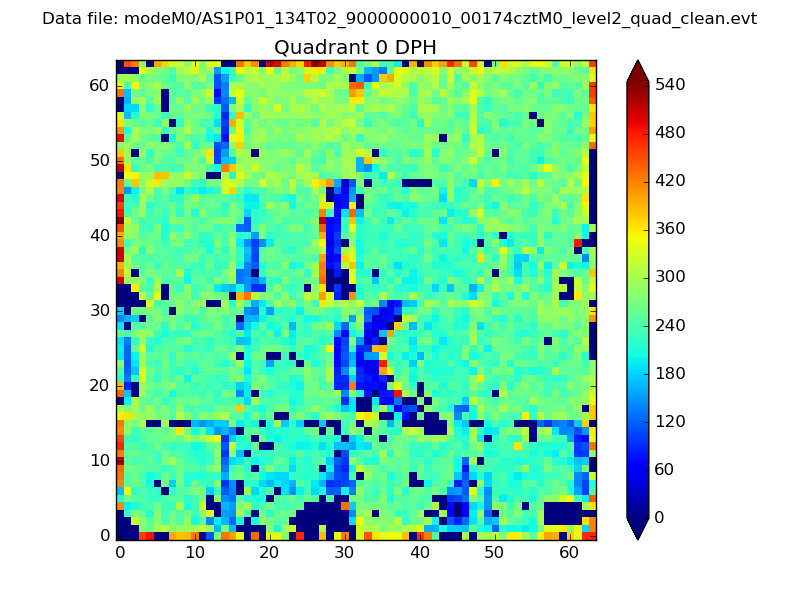 |
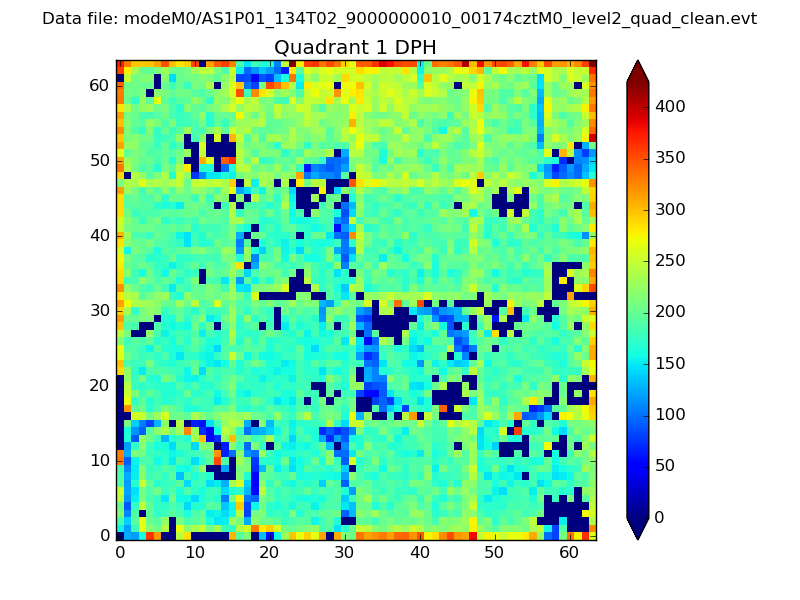 |
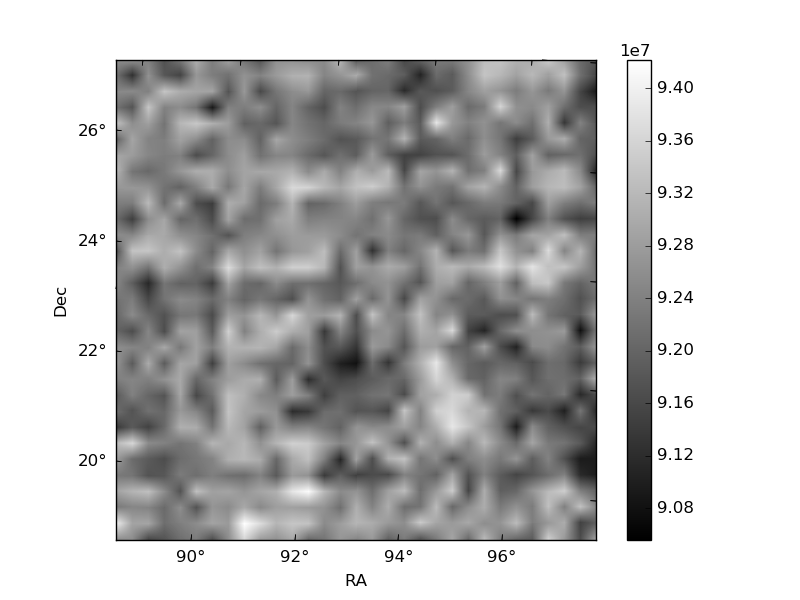
Quadrant B |
|---|---|---|---|
| Quadrant D | 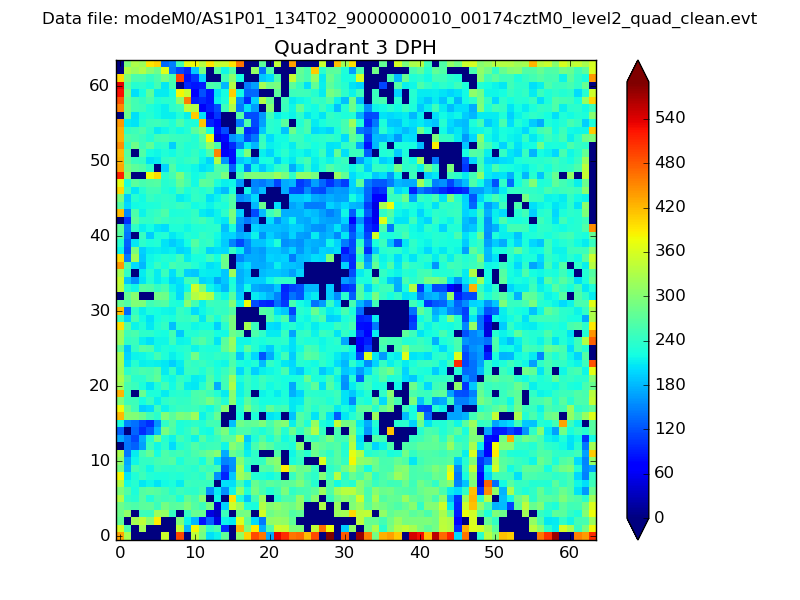 |
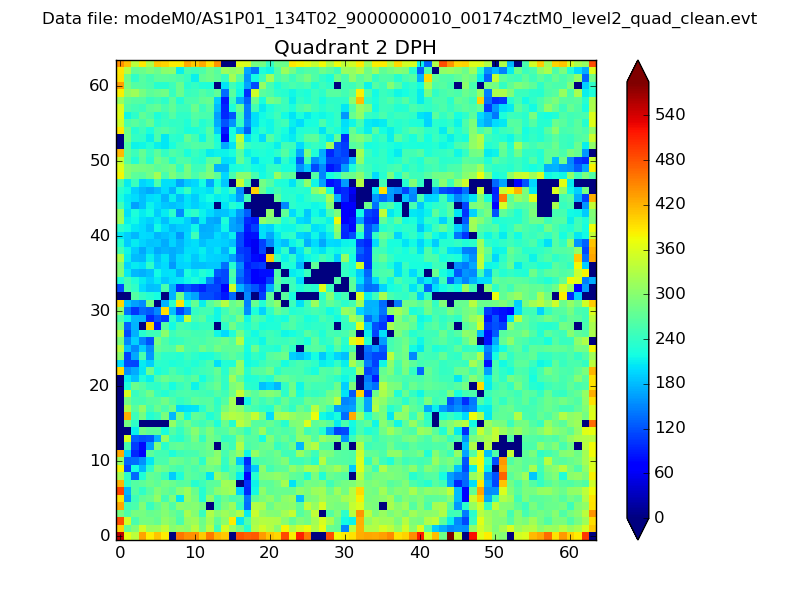 |
Quadrant C |
| Plot type | Count rate plots | Images |
|---|---|---|
| Comparison with Poisson distribution Blue bars denote a histogram of data divided into 1 sec bins. Red curve is a Poisson curve with rate = median count rate of data. |
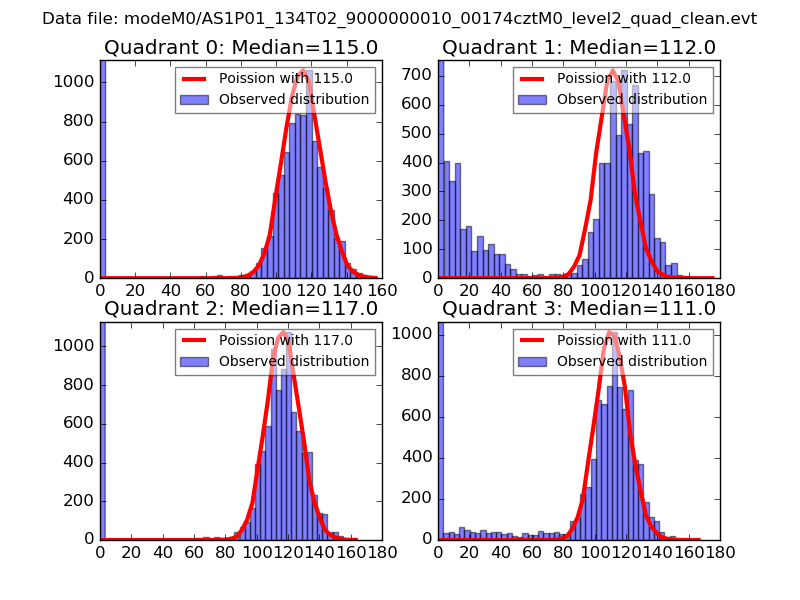 |
 |
| Quadrant-wise count rates Data is divided into 100 sec bins |
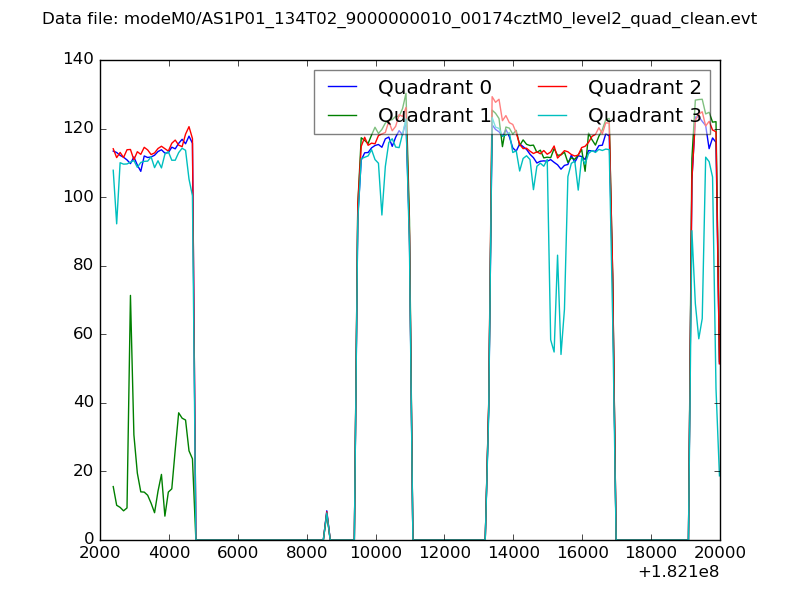 |
|
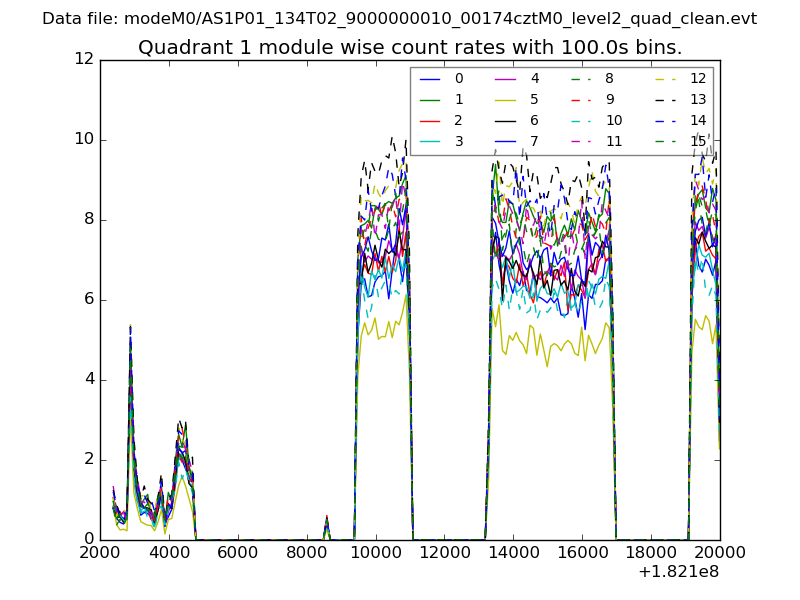
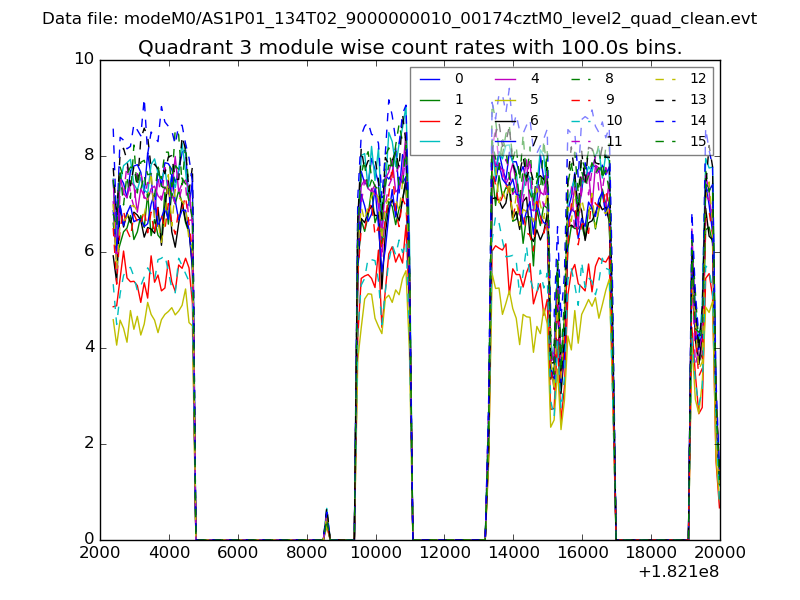
| Module-wise count rates for Quadrant A Data is divided into 100 sec bins |
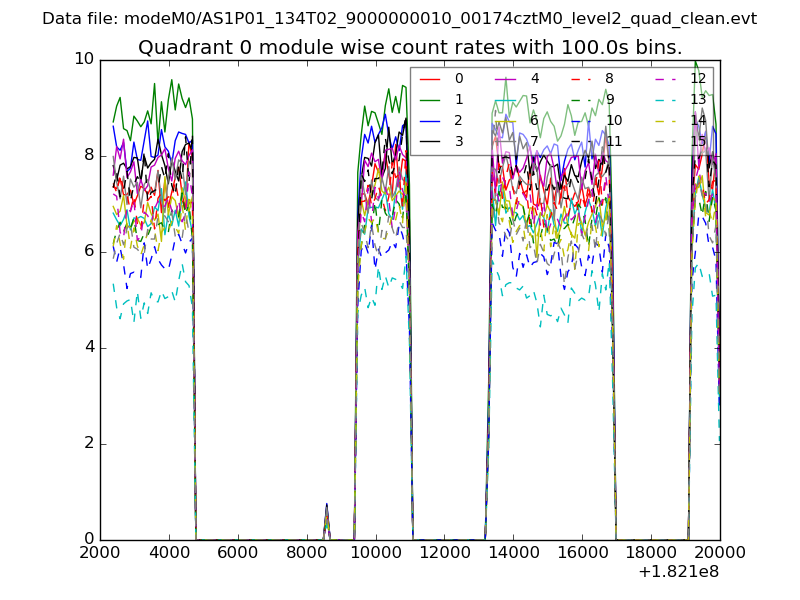 |
 |
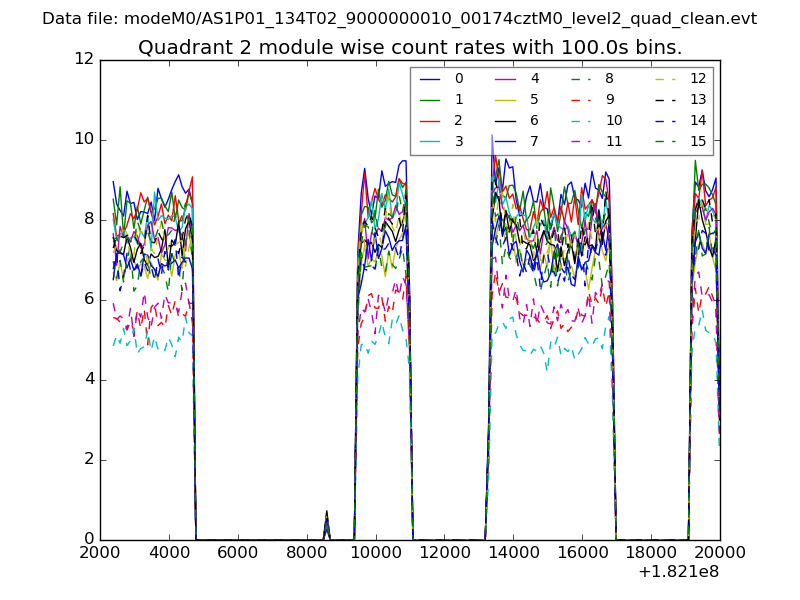
| Module-wise count rates for Quadrant B Data is divided into 100 sec bins |
 |
 |
| Module-wise count rates for Quadrant C Data is divided into 100 sec bins |
 |
 |
| Module-wise count rates for Quadrant D Data is divided into 100 sec bins |
 |
 |
| Parameter | Plot |
|---|---|
| CZT HV Monitor | 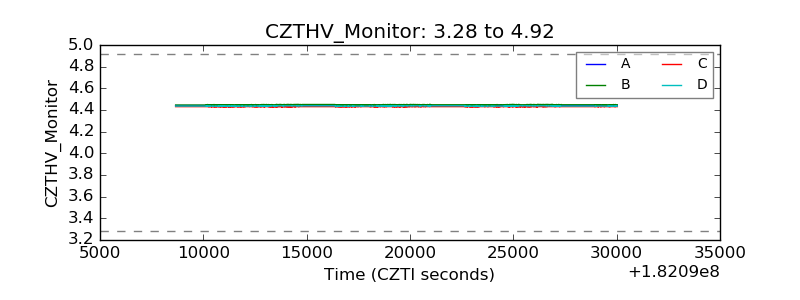 |
| D_VDD | 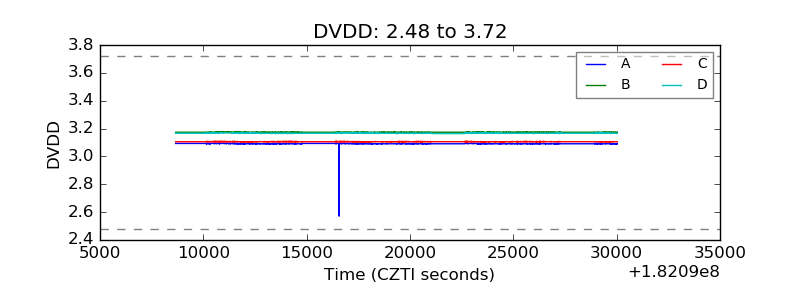 |
| Temperature 1 | 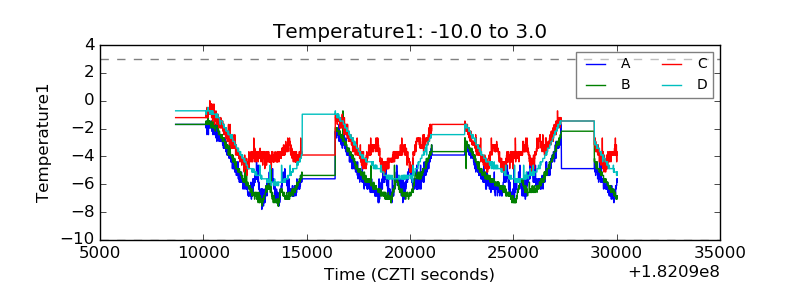 |
| Veto HV Monitor | 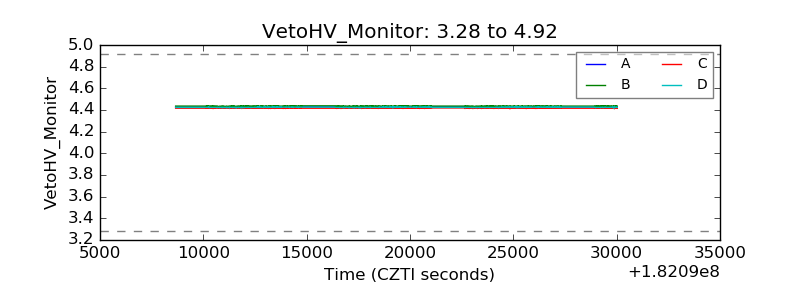 |
| Veto LLD | 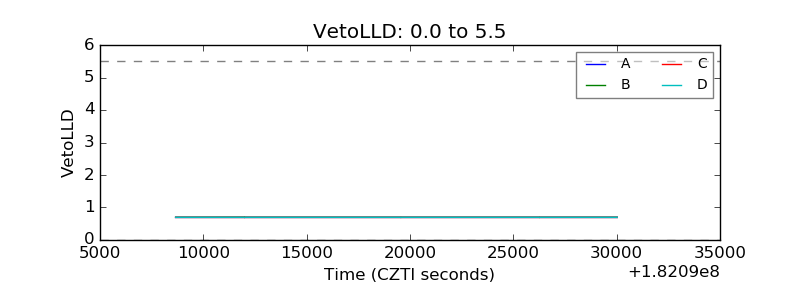 |
| Alpha Counter | 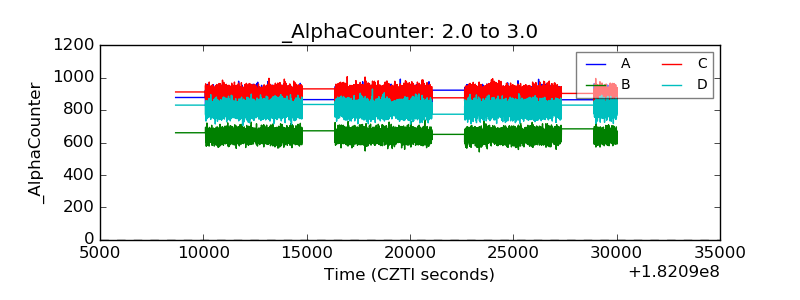 |
| _CPM_Rate | 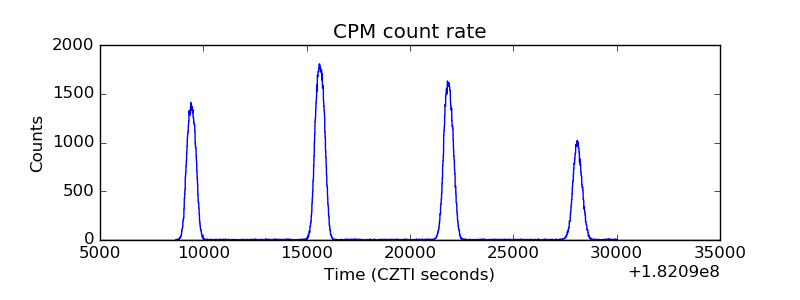 |
| CZT Counter | 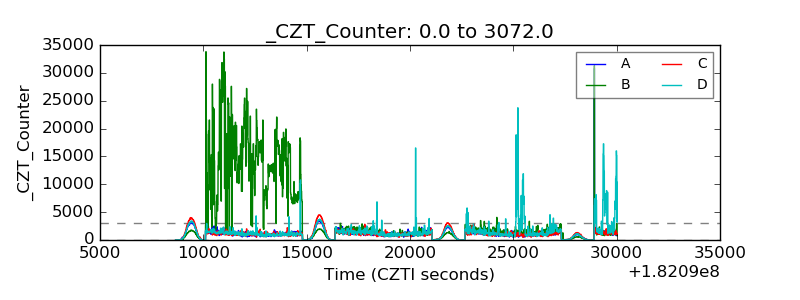 |
| +2.5 Volts monitor |  |
| +5 Volts monitor |  |
| _ROLL_ROT | 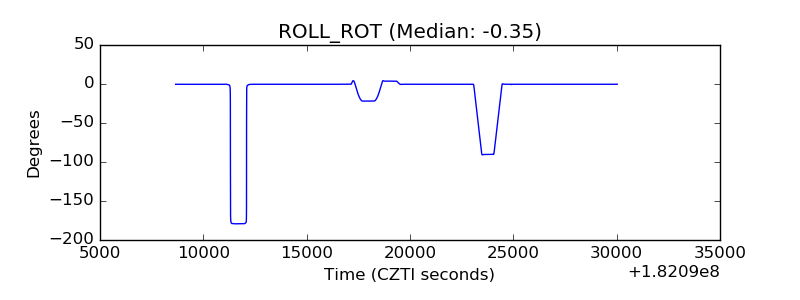 |
| _Roll_DEC | 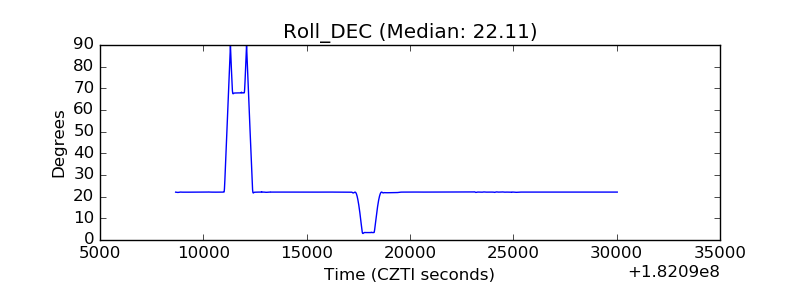 |
| _Roll_RA | 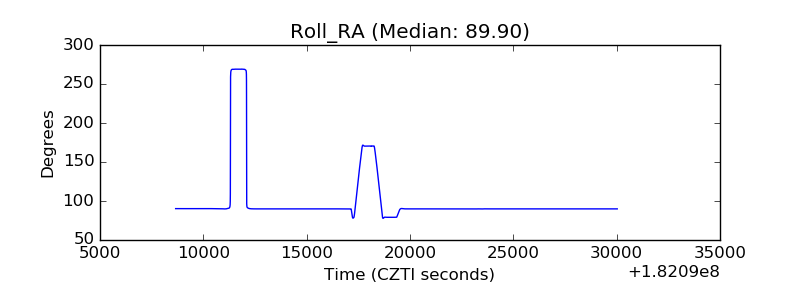 |
| Veto Counter | 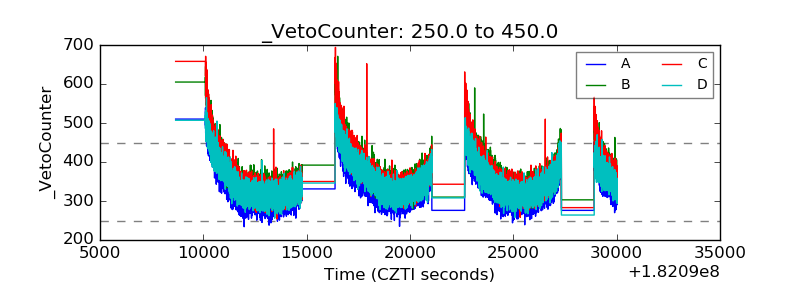 |