| Param | Original file | Final file |
|---|---|---|
| Filename | modeM0/AS1P01_134T02_9000000010_00175cztM0_level2.evt | modeM0/AS1P01_134T02_9000000010_00175cztM0_level2_quad_clean.evt |
| Size (bytes) | 256,063,680 | 23,742,720 |
| Size | 244.2 MB | 22.6 MB |
| Events in quadrant A | 1,559,275 | 161,641 |
| Events in quadrant B | 1,629,075 | 168,473 |
| Events in quadrant C | 1,572,364 | 163,587 |
| Events in quadrant D | 2,896,227 | 117,909 |
| Mode SS | |||
|---|---|---|---|
| Quadrant | BADHDUFLAG | Total packets | Discarded packets |
| A | 0 | 30 | 0 |
| B | 0 | 31 | 1 |
| C | 0 | 31 | 1 |
| D | 0 | 31 | 1 |
| Mode M9 | |||
|---|---|---|---|
| Quadrant | BADHDUFLAG | Total packets | Discarded packets |
| A | 1 | 229350969736 | 1 |
| B | 1 | -1 | -1 |
| C | 1 | -1 | -1 |
| D | 1 | -1 | -1 |
| Mode M0 | |||
|---|---|---|---|
| Quadrant | BADHDUFLAG | Total packets | Discarded packets |
| A | 0 | 6284 | 630 |
| B | 0 | 6488 | 638 |
| C | 0 | 6322 | 643 |
| D | 0 | 10814 | 1117 |
| Quadrant | Total seconds | Saturated seconds | Saturation percentage |
|---|---|---|---|
| A | 1430 | 4 | 0.279720% |
| B | 1428 | 0 | 0.000000% |
| C | 1427 | 2 | 0.140154% |
| D | 1424 | 537 | 37.710674% |
Noise dominated data is calculated using 1-second bins in cleaned event files. If a bin has >2000 counts, and if more than 50% of those come from <1% of pixels, then it is considered to be noise-dominated and hence unusable.
| Quadrant | # 1 sec bins | Bins with >0 counts | Bins with >2000 counts | High rate bins dominated by noise | Noise dominated (total time) | Noise dominated (detector-on time) | Marked lightcurve |
|---|---|---|---|---|---|---|---|
| A | 1574 | 1431 | 19 | 19 | 1.21% | 1.33% |  |
| B | 1575 | 1432 | 16 | 16 | 1.02% | 1.12% | 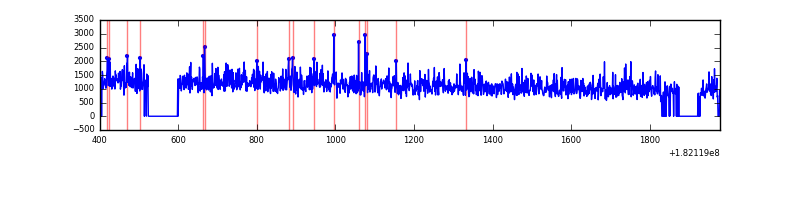 |
| C | 1574 | 1429 | 22 | 22 | 1.40% | 1.54% | 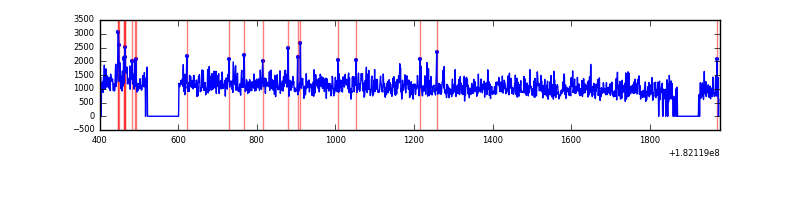 |
| D | 1568 | 1425 | 693 | 693 | 44.20% | 48.63% | 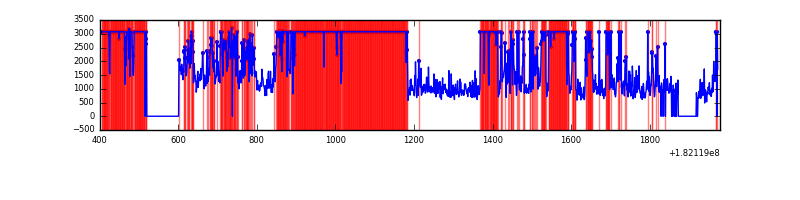 |
Top three noisy pixels from each quadrant. If the there are fewer than three noisy pixels in the level2.evt file, extra rows are filled as -1
| Pixel properties | Quadrant properties | ||||||
|---|---|---|---|---|---|---|---|
| Quadrant | DetID | PixID | Counts | Sigma | Mean | Median | Sigma |
| A | 14 | 10 | 21258 | 235.66 | 392 | 389 | 88.6 |
| A | 0 | 96 | 10849 | 118.12 | 392 | 389 | 88.6 |
| A | 0 | 86 | 5664 | 59.57 | 392 | 389 | 88.6 |
| B | 0 | 212 | 11733 | 115.11 | 418 | 421 | 98.3 |
| B | 5 | 216 | 8292 | 80.1 | 418 | 421 | 98.3 |
| B | 2 | 253 | 4332 | 39.8 | 418 | 421 | 98.3 |
| C | 12 | 48 | 14775 | 131.39 | 387 | 404 | 109.4 |
| C | 10 | 38 | 7710 | 66.8 | 387 | 404 | 109.4 |
| C | 0 | 218 | 5691 | 48.34 | 387 | 404 | 109.4 |
| D | 2 | 121 | 1759730 | 20417.06 | 278 | 285 | 86.2 |
| D | 13 | 89 | 20573 | 235.43 | 278 | 285 | 86.2 |
| D | 12 | 14 | 8873 | 99.66 | 278 | 285 | 86.2 |
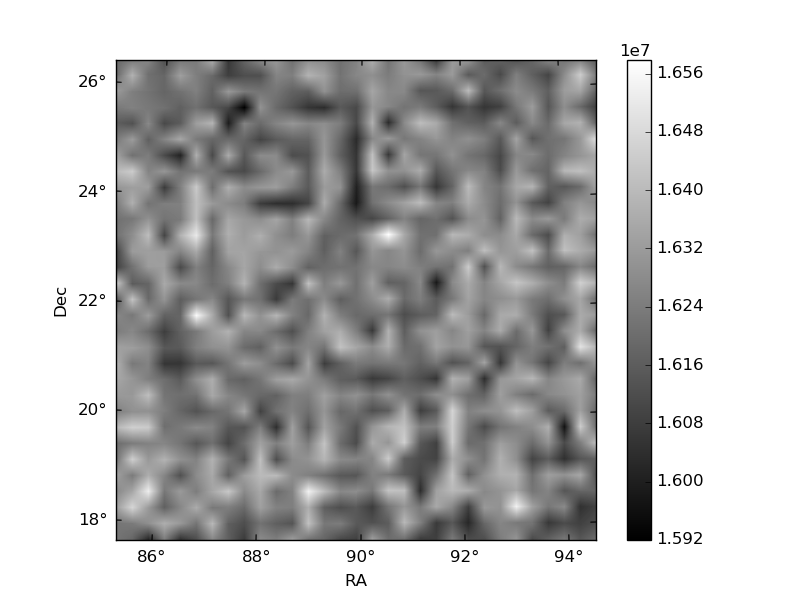
Histogram calculated using DETX and DETY for each event in the final _common_clean file
| Quadrant A | 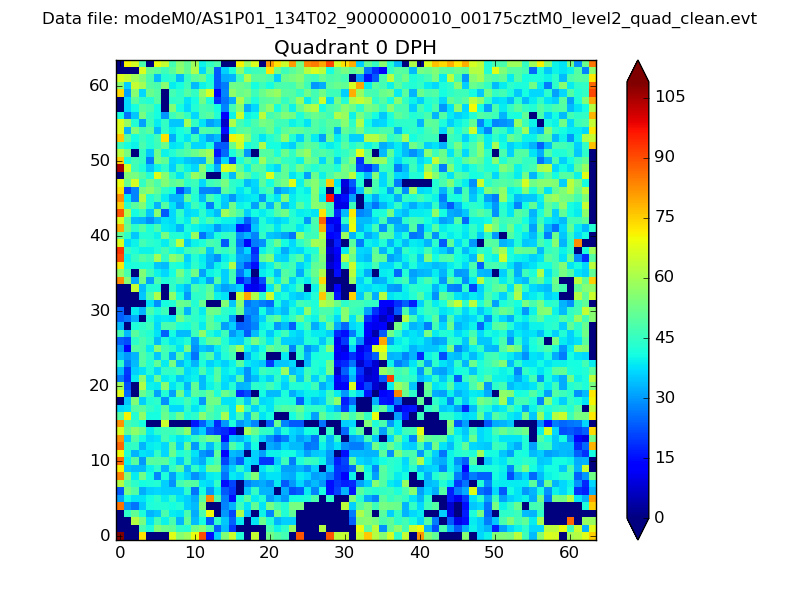 |
 |
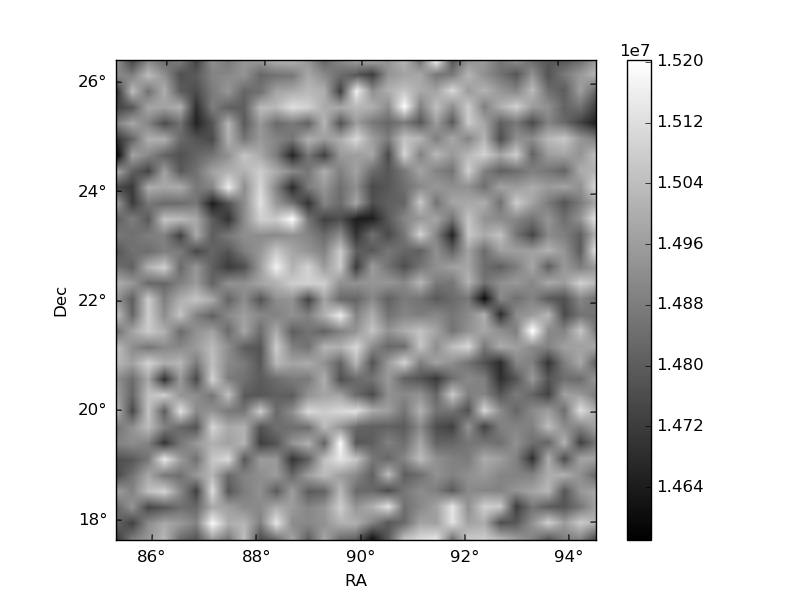
Quadrant B |
|---|---|---|---|
| Quadrant D | 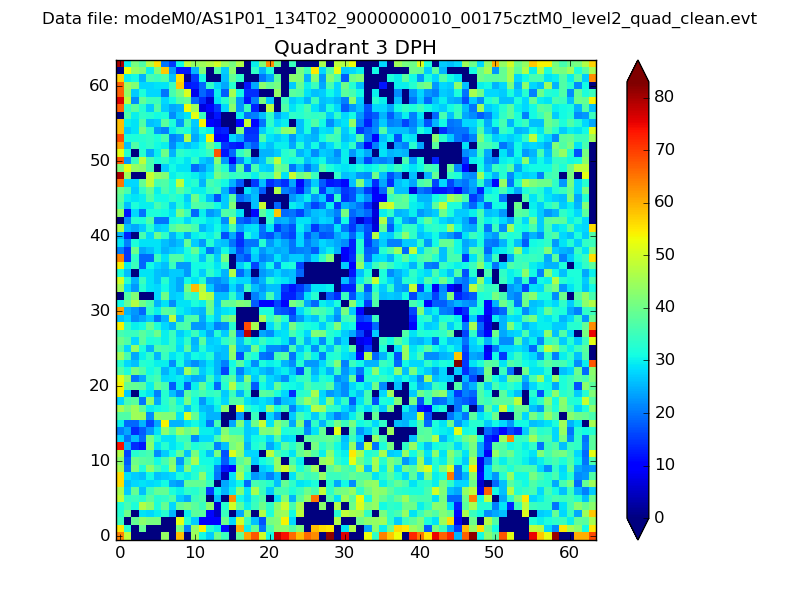 |
 |
Quadrant C |
| Plot type | Count rate plots | Images |
|---|---|---|
| Comparison with Poisson distribution Blue bars denote a histogram of data divided into 1 sec bins. Red curve is a Poisson curve with rate = median count rate of data. |
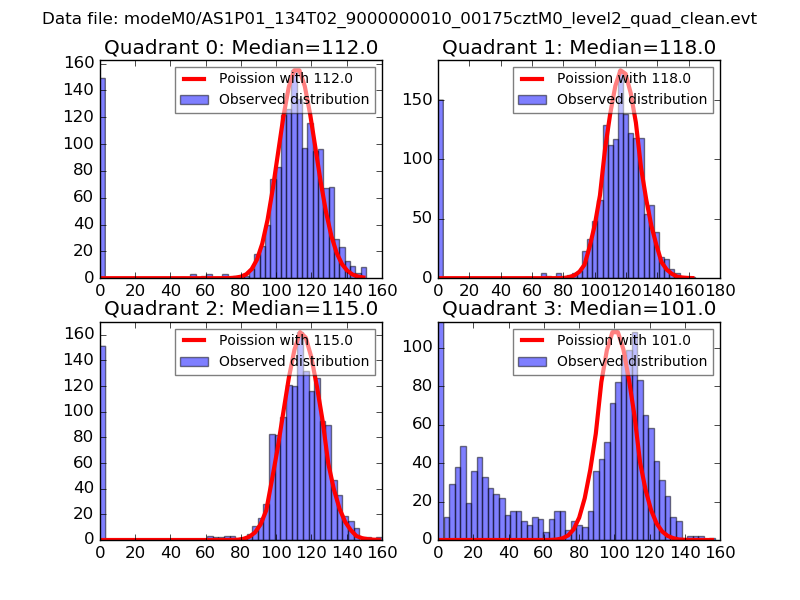 |
 |
| Quadrant-wise count rates Data is divided into 100 sec bins |
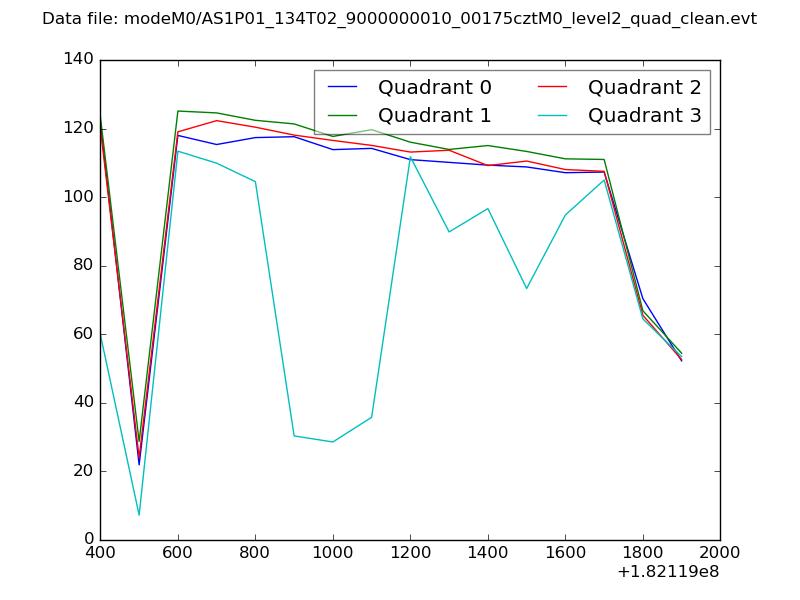 |
|
| Module-wise count rates for Quadrant A Data is divided into 100 sec bins |
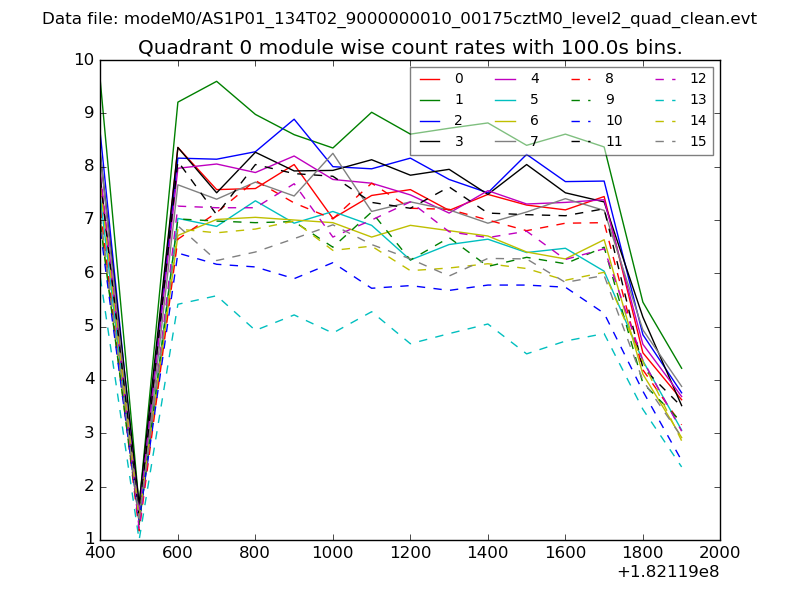 |
 |
| Module-wise count rates for Quadrant B Data is divided into 100 sec bins |
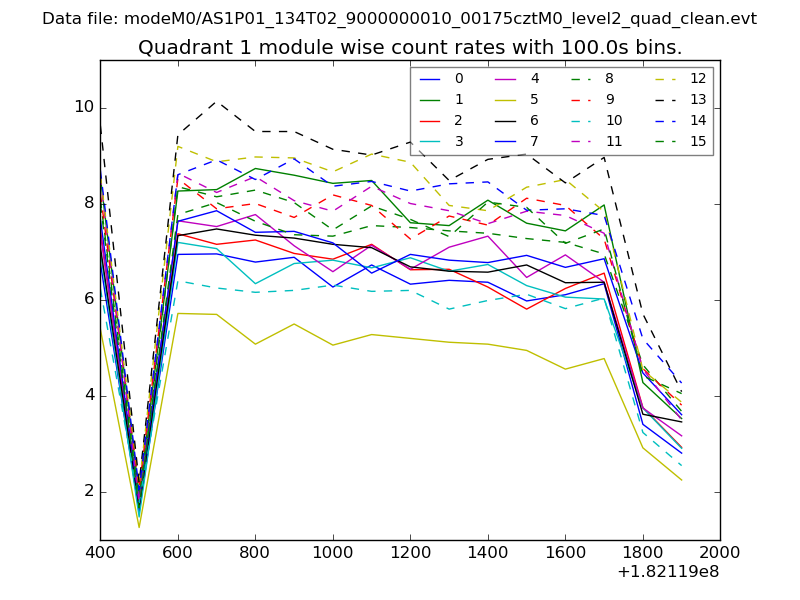 |
 |
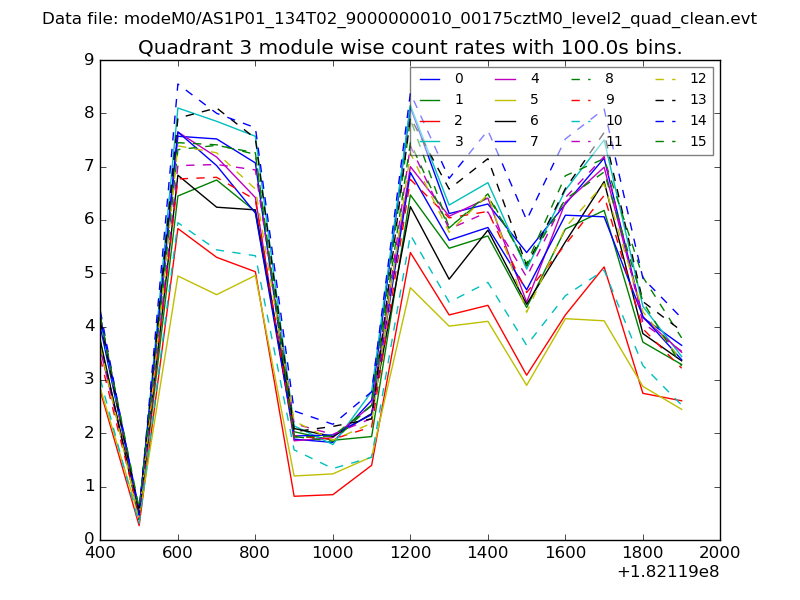
| Module-wise count rates for Quadrant C Data is divided into 100 sec bins |
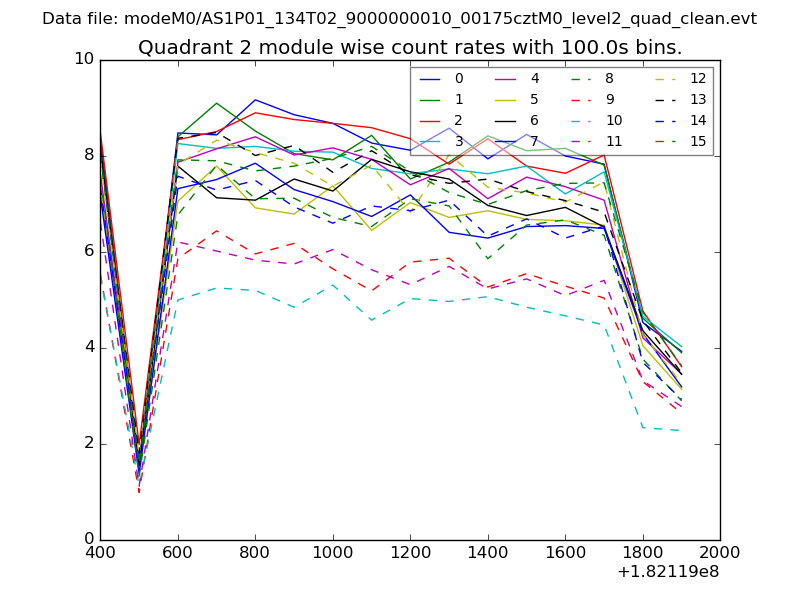 |
 |
| Module-wise count rates for Quadrant D Data is divided into 100 sec bins |
 |
 |
| Parameter | Plot |
|---|---|
| CZT HV Monitor | 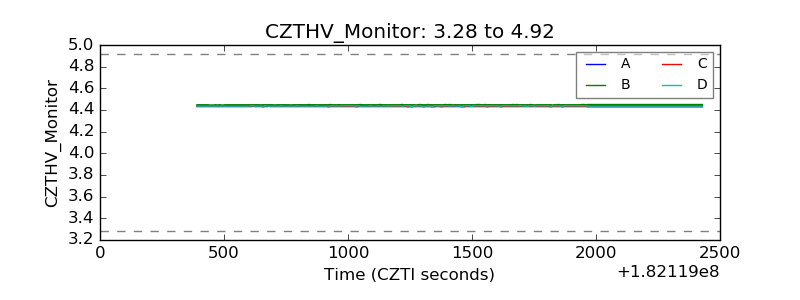 |
| D_VDD | 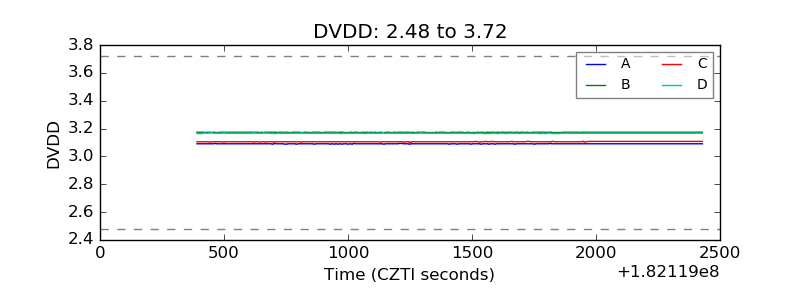 |
| Temperature 1 | 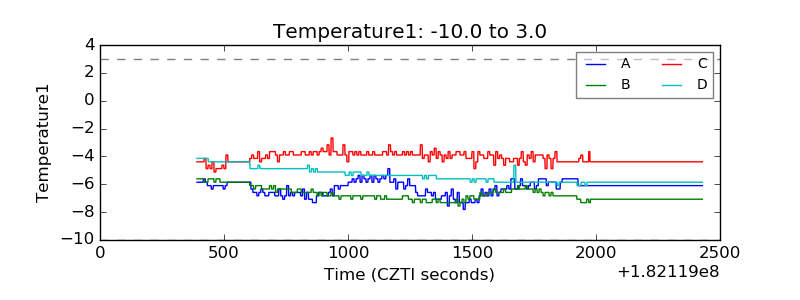 |
| Veto HV Monitor | 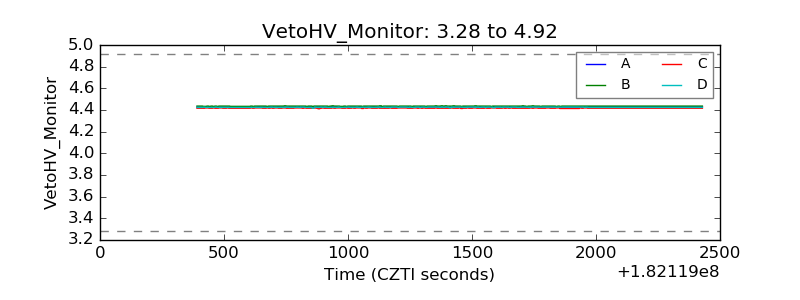 |
| Veto LLD | 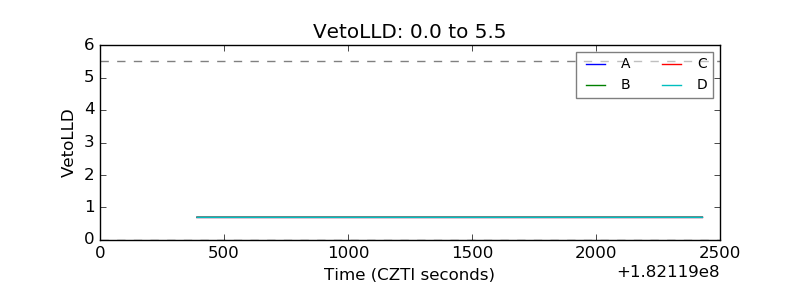 |
| Alpha Counter | 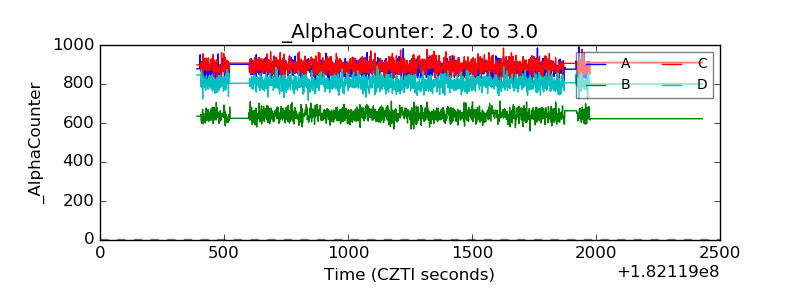 |
| _CPM_Rate | 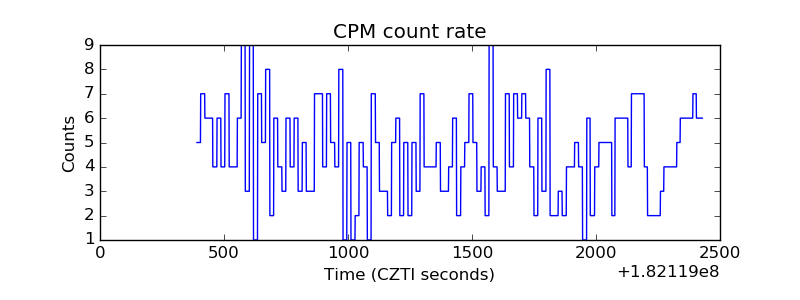 |
| CZT Counter | 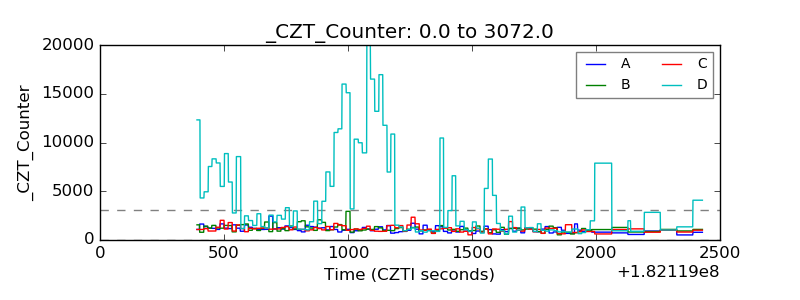 |
| +2.5 Volts monitor |  |
| +5 Volts monitor |  |
| _ROLL_ROT | 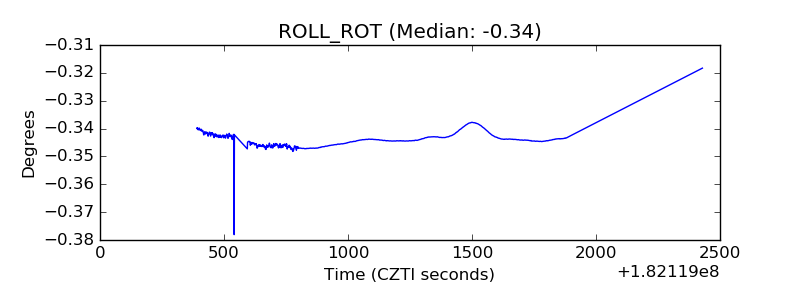 |
| _Roll_DEC | 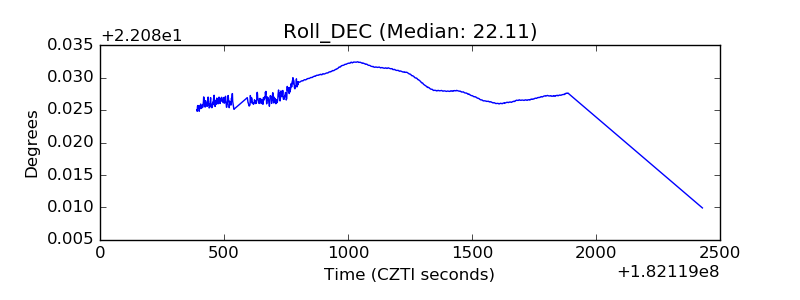 |
| _Roll_RA | 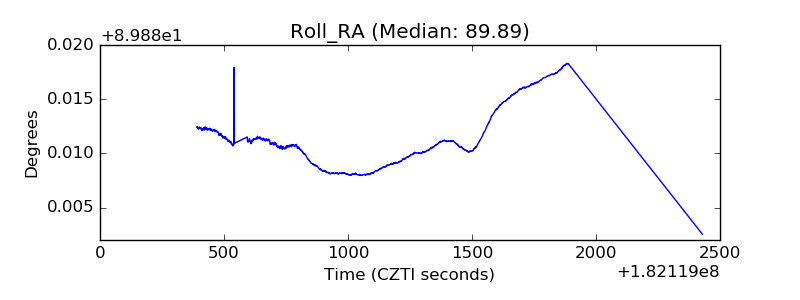 |
| Veto Counter | 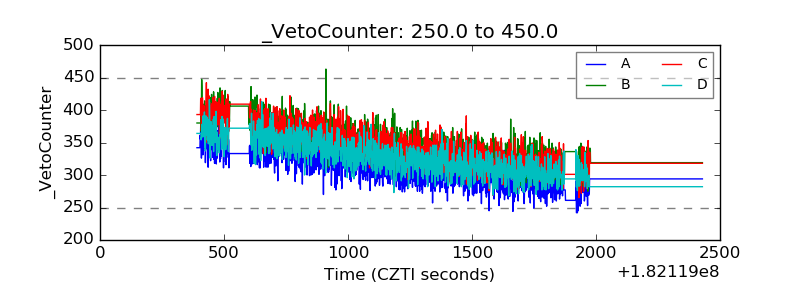 |