| Param | Original file | Final file |
|---|---|---|
| Filename | modeM0/AS1P01_134T04_9000000012_00175cztM0_level2.evt | modeM0/AS1P01_134T04_9000000012_00175cztM0_level2_quad_clean.evt |
| Size (bytes) | 518,760,000 | 30,885,120 |
| Size | 494.7 MB | 29.5 MB |
| Events in quadrant A | 3,523,223 | 191,577 |
| Events in quadrant B | 3,470,711 | 196,589 |
| Events in quadrant C | 3,243,173 | 194,227 |
| Events in quadrant D | 5,289,192 | 155,588 |
| Mode M9 | |||
|---|---|---|---|
| Quadrant | BADHDUFLAG | Total packets | Discarded packets |
| A | 0 | 16 | 0 |
| B | 0 | 16 | 0 |
| C | 0 | 16 | 0 |
| D | 0 | 16 | 0 |
| Mode SS | |||
|---|---|---|---|
| Quadrant | BADHDUFLAG | Total packets | Discarded packets |
| A | 0 | 58 | 2 |
| B | 0 | 58 | 2 |
| C | 0 | 58 | 2 |
| D | 0 | 58 | 2 |
| Mode M0 | |||
|---|---|---|---|
| Quadrant | BADHDUFLAG | Total packets | Discarded packets |
| A | 0 | 12680 | 252 |
| B | 0 | 12537 | 256 |
| C | 0 | 11812 | 224 |
| D | 0 | 18174 | 405 |
| Quadrant | Total seconds | Saturated seconds | Saturation percentage |
|---|---|---|---|
| A | 2764 | 10 | 0.361795% |
| B | 2761 | 9 | 0.325969% |
| C | 2763 | 3 | 0.108578% |
| D | 2761 | 643 | 23.288664% |
Noise dominated data is calculated using 1-second bins in cleaned event files. If a bin has >2000 counts, and if more than 50% of those come from <1% of pixels, then it is considered to be noise-dominated and hence unusable.
| Quadrant | # 1 sec bins | Bins with >0 counts | Bins with >2000 counts | High rate bins dominated by noise | Noise dominated (total time) | Noise dominated (detector-on time) | Marked lightcurve |
|---|---|---|---|---|---|---|---|
| A | 4411 | 2767 | 126 | 126 | 2.86% | 4.55% | 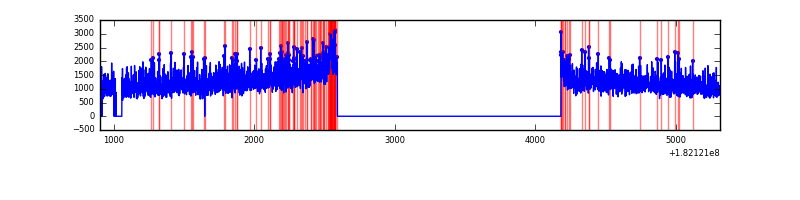 |
| B | 4407 | 2765 | 89 | 89 | 2.02% | 3.22% | 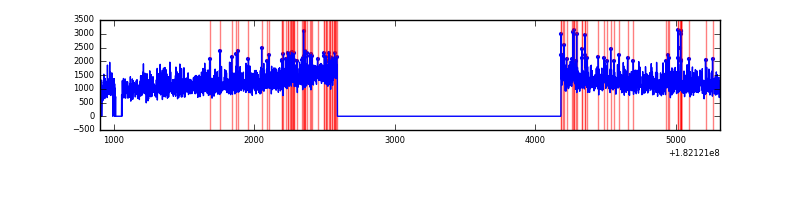 |
| C | 4412 | 2768 | 36 | 36 | 0.82% | 1.30% | 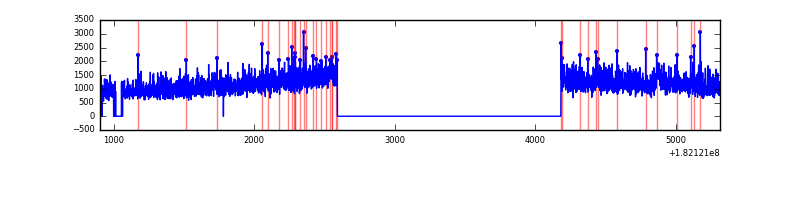 |
| D | 4408 | 2767 | 1043 | 1043 | 23.66% | 37.69% | 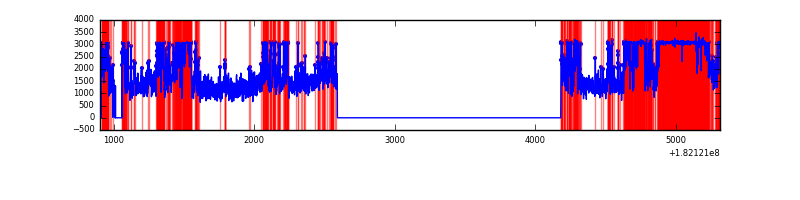 |
Top three noisy pixels from each quadrant. If the there are fewer than three noisy pixels in the level2.evt file, extra rows are filled as -1
| Pixel properties | Quadrant properties | ||||||
|---|---|---|---|---|---|---|---|
| Quadrant | DetID | PixID | Counts | Sigma | Mean | Median | Sigma |
| A | 14 | 10 | 46685 | 236.24 | 880 | 876 | 193.9 |
| A | 15 | 184 | 39190 | 197.59 | 880 | 876 | 193.9 |
| A | 14 | 171 | 14427 | 69.88 | 880 | 876 | 193.9 |
| B | 5 | 216 | 69286 | 330.21 | 875 | 881 | 207.2 |
| B | 10 | 199 | 29358 | 137.46 | 875 | 881 | 207.2 |
| B | 15 | 64 | 4626 | 18.08 | 875 | 881 | 207.2 |
| C | 12 | 48 | 29654 | 128.09 | 797 | 827 | 225.0 |
| C | 0 | 188 | 25667 | 110.38 | 797 | 827 | 225.0 |
| C | 0 | 202 | 20356 | 86.78 | 797 | 827 | 225.0 |
| D | 2 | 121 | 2259621 | 10269.36 | 723 | 746 | 220.0 |
| D | 13 | 89 | 154252 | 697.87 | 723 | 746 | 220.0 |
| D | 12 | 14 | 24065 | 106.01 | 723 | 746 | 220.0 |
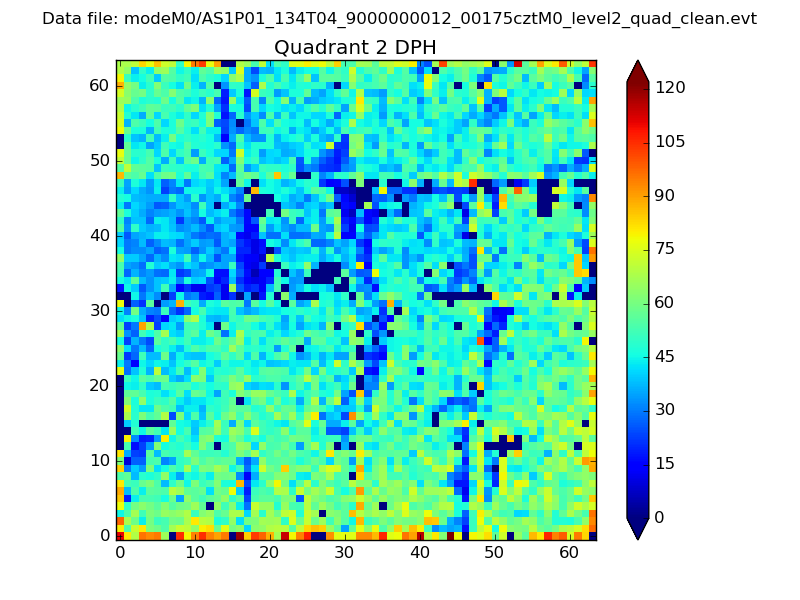
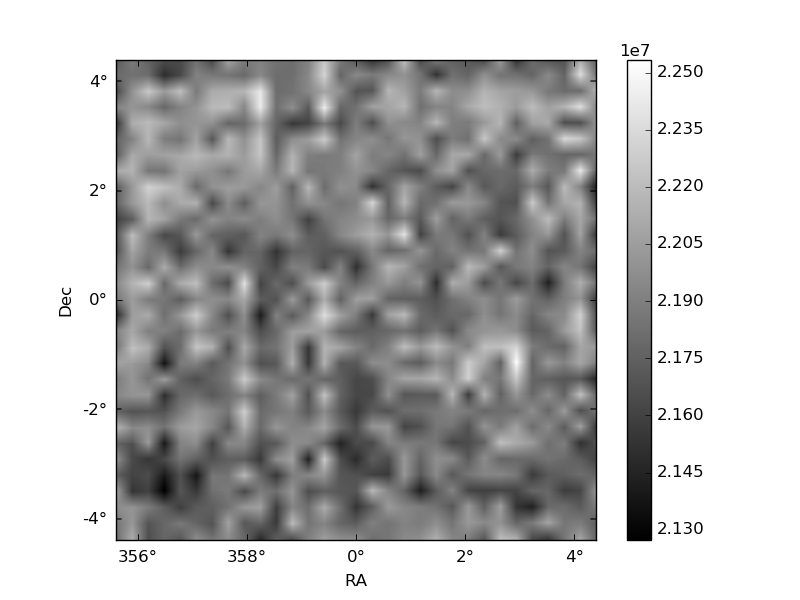
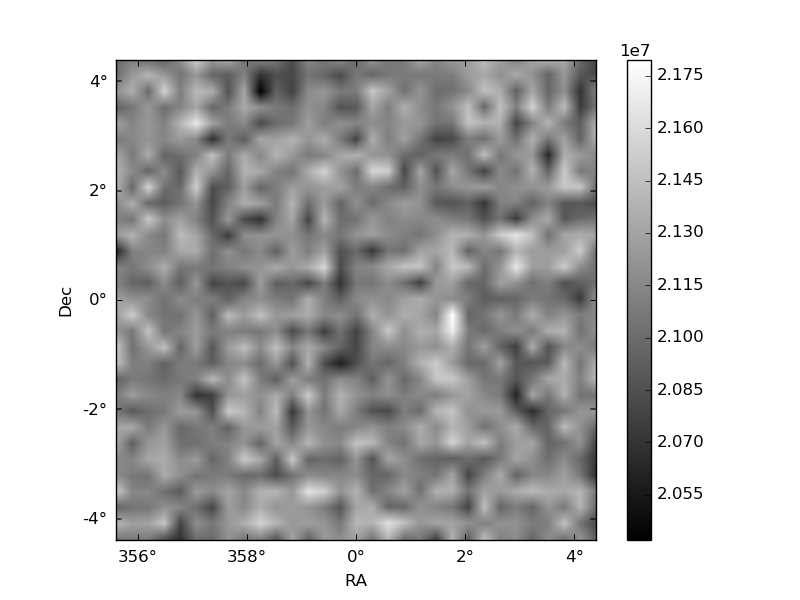
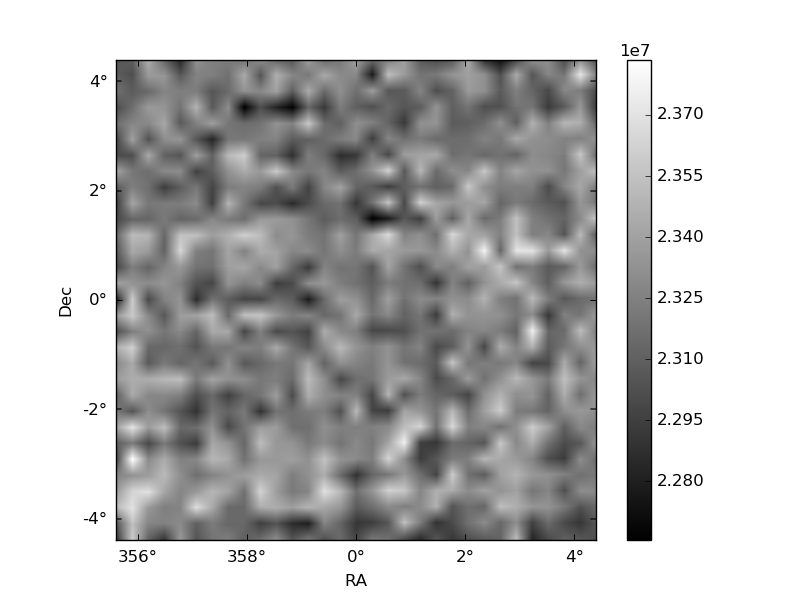
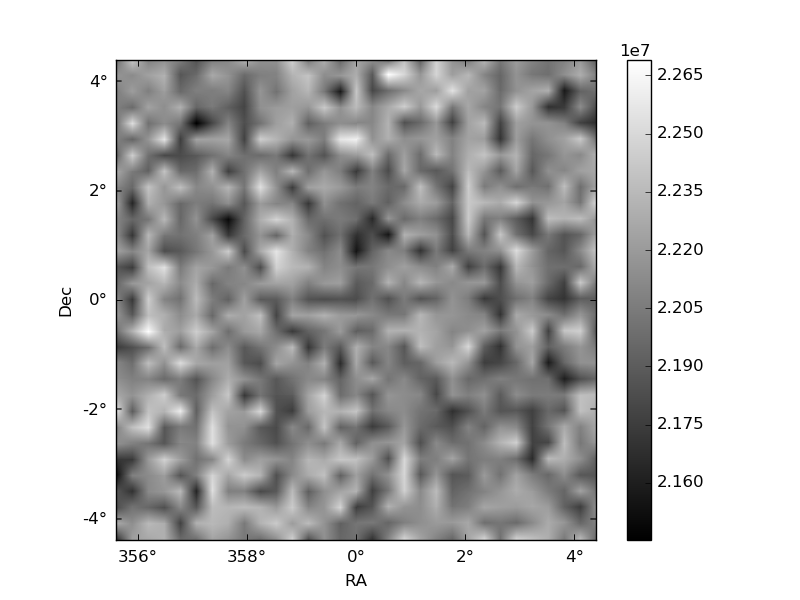
Histogram calculated using DETX and DETY for each event in the final _common_clean file
| Quadrant A | 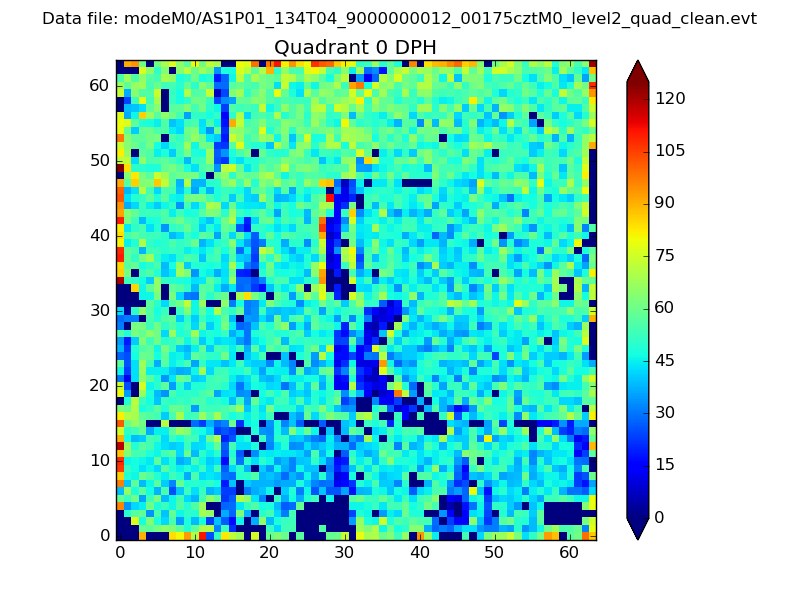 |
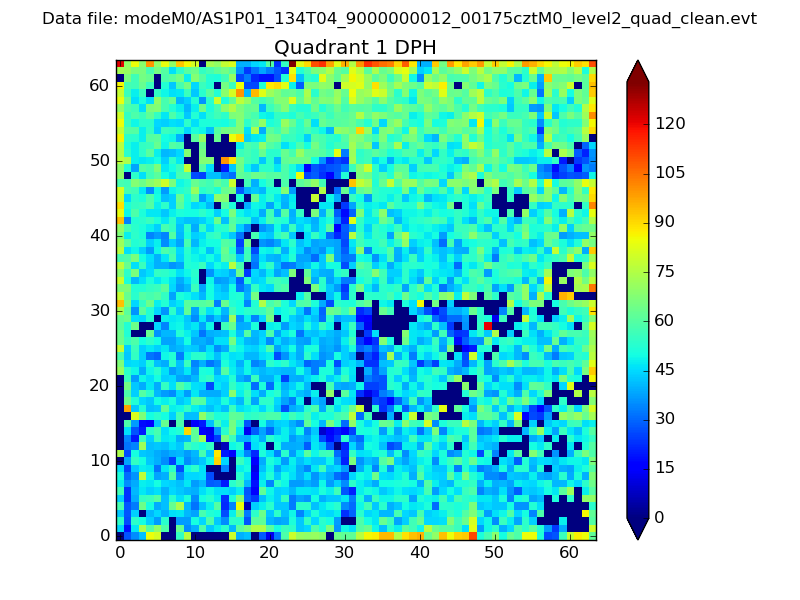 |
Quadrant B |
|---|---|---|---|
| Quadrant D | 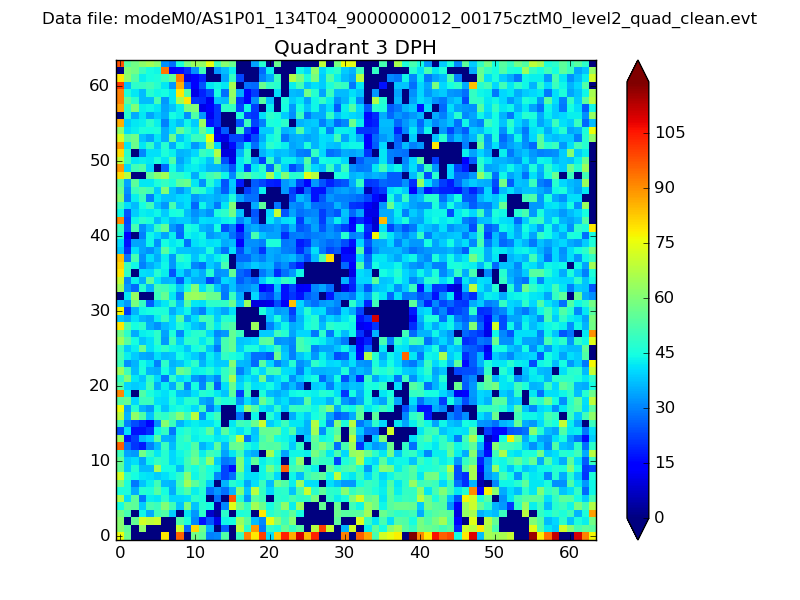 |
 |
Quadrant C |
| Plot type | Count rate plots | Images |
|---|---|---|
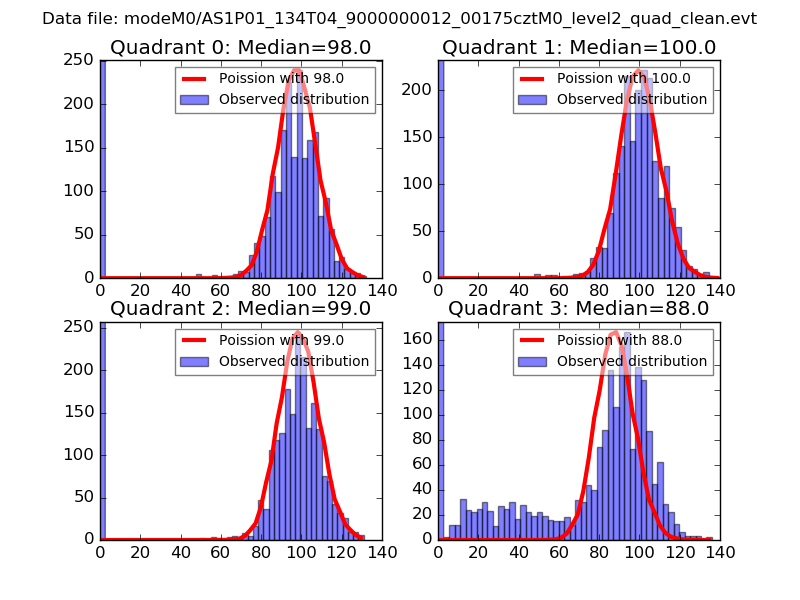
| Comparison with Poisson distribution Blue bars denote a histogram of data divided into 1 sec bins. Red curve is a Poisson curve with rate = median count rate of data. |
 |
 |
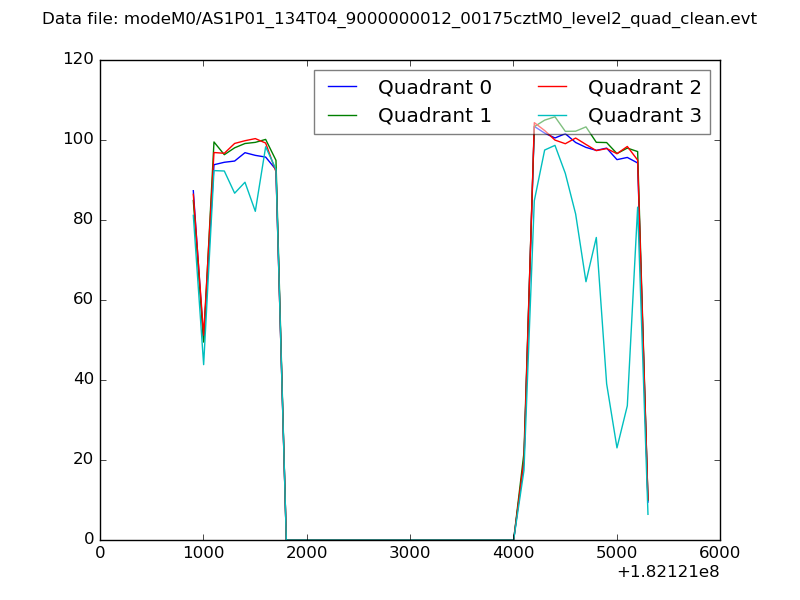
| Quadrant-wise count rates Data is divided into 100 sec bins |
 |
|
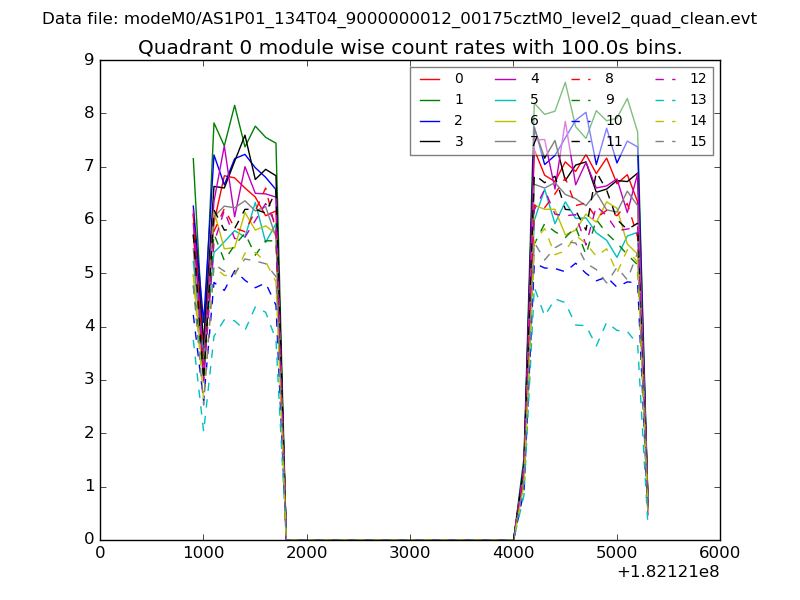
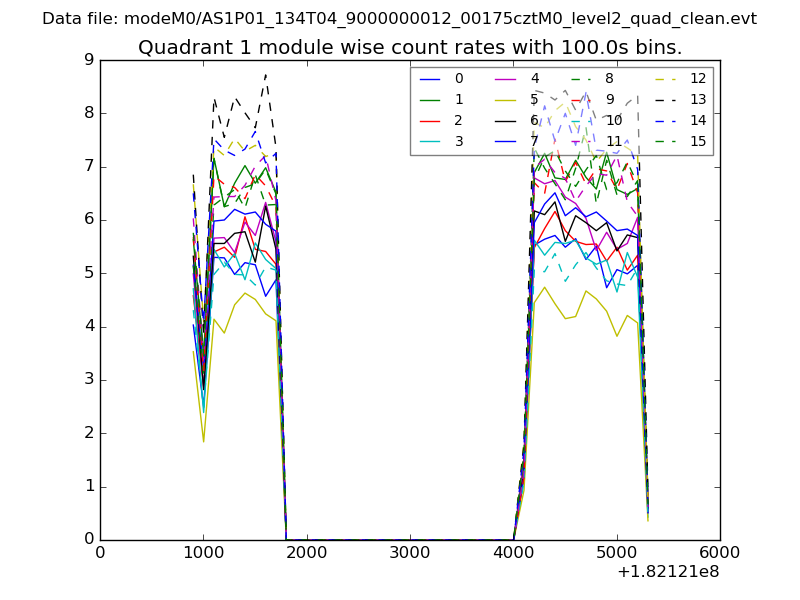
| Module-wise count rates for Quadrant A Data is divided into 100 sec bins |
 |
 |
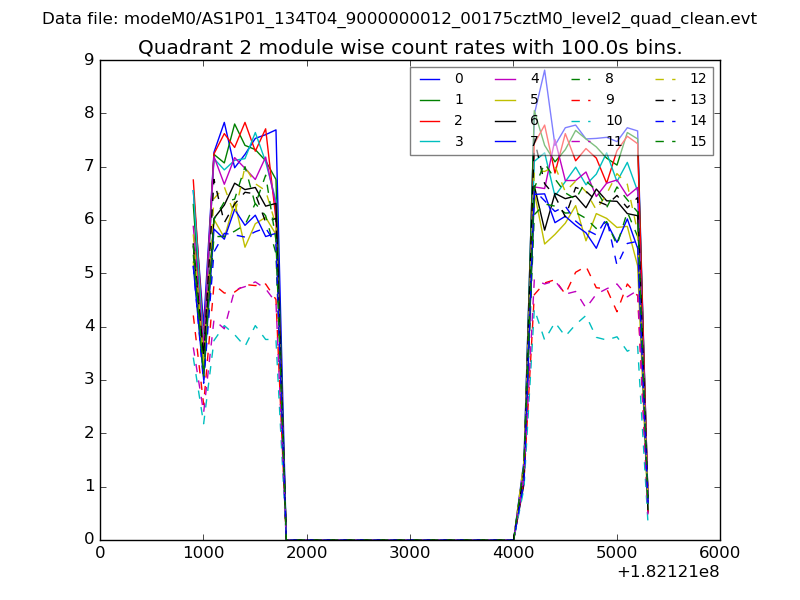
| Module-wise count rates for Quadrant B Data is divided into 100 sec bins |
 |
 |
| Module-wise count rates for Quadrant C Data is divided into 100 sec bins |
 |
 |
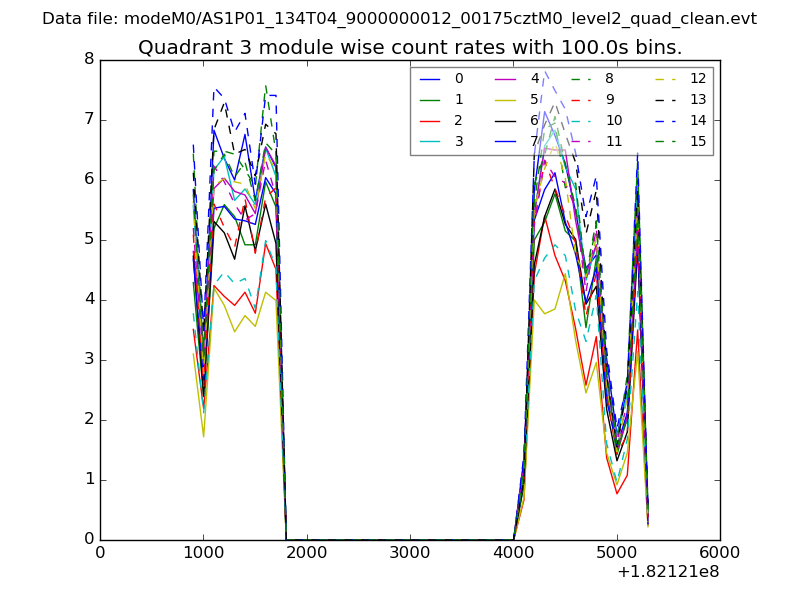
| Module-wise count rates for Quadrant D Data is divided into 100 sec bins |
 |
 |
| Parameter | Plot |
|---|---|
| CZT HV Monitor | 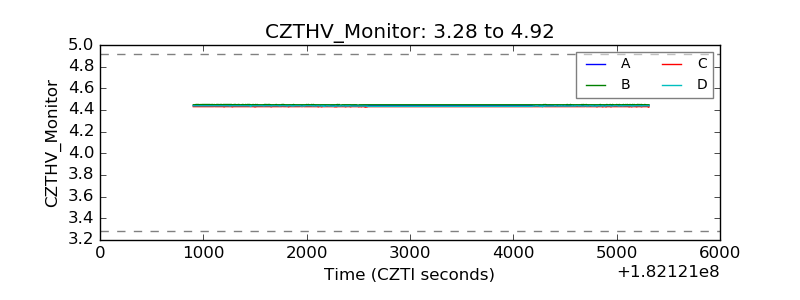 |
| D_VDD | 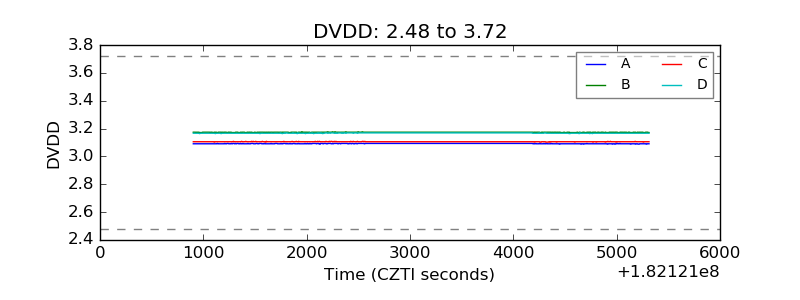 |
| Temperature 1 | 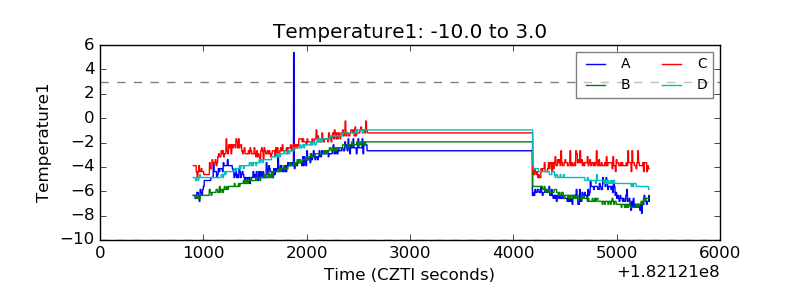 |
| Veto HV Monitor | 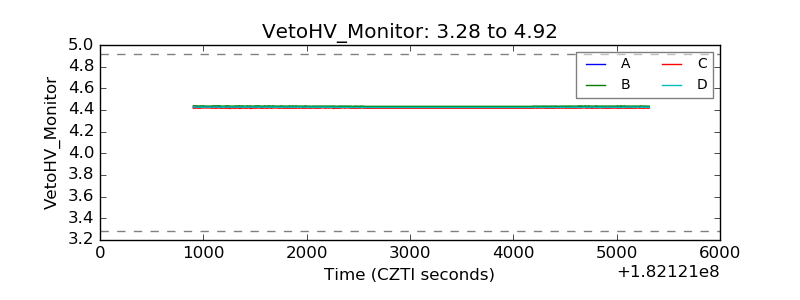 |
| Veto LLD | 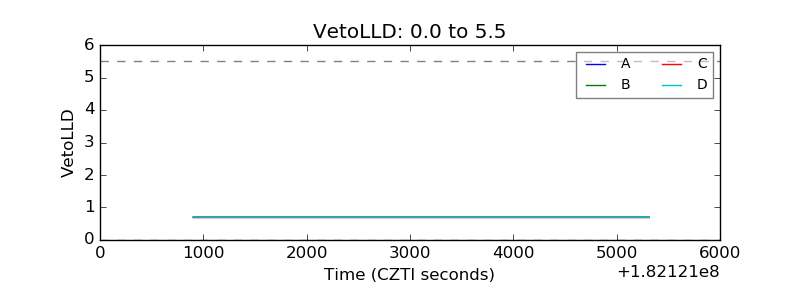 |
| Alpha Counter | 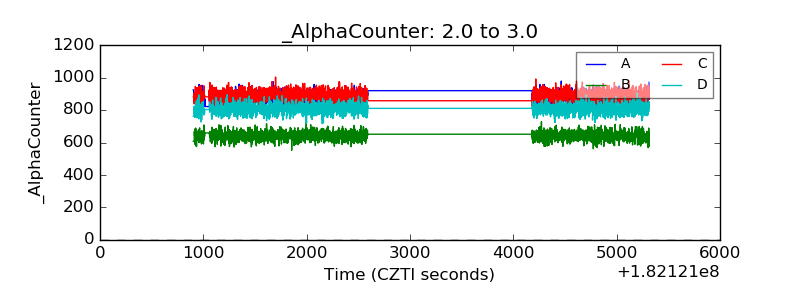 |
| _CPM_Rate | 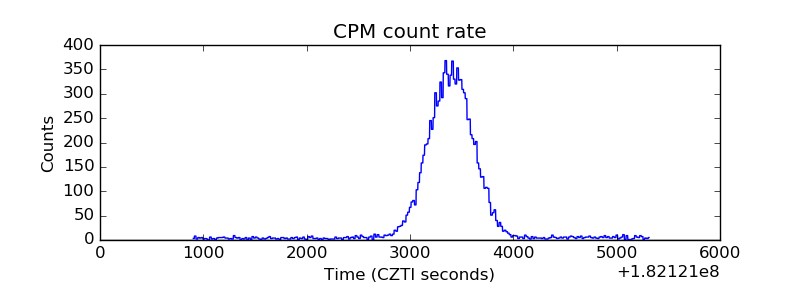 |
| CZT Counter | 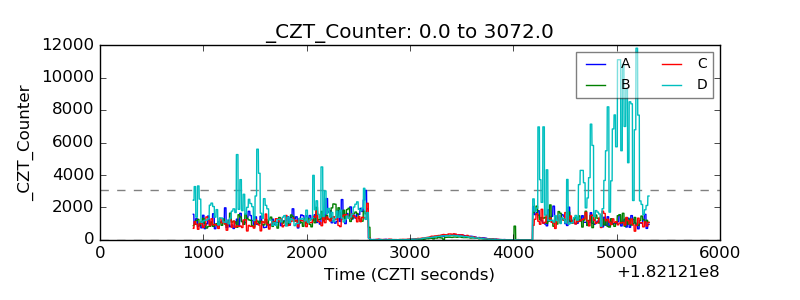 |
| +2.5 Volts monitor | 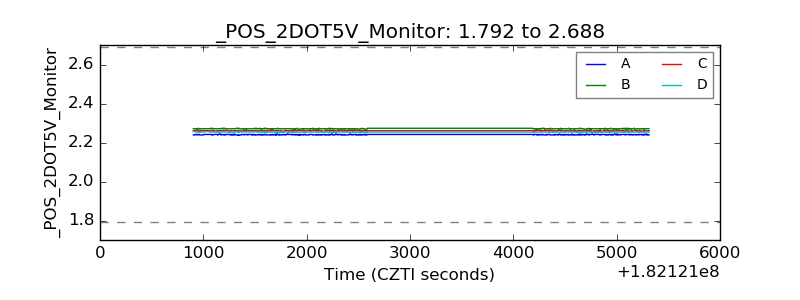 |
| +5 Volts monitor |  |
| _ROLL_ROT | 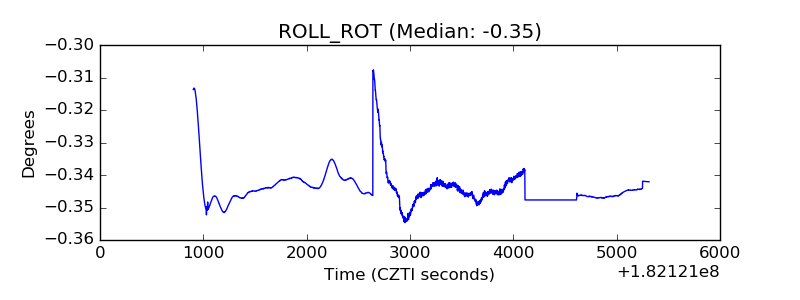 |
| _Roll_DEC | 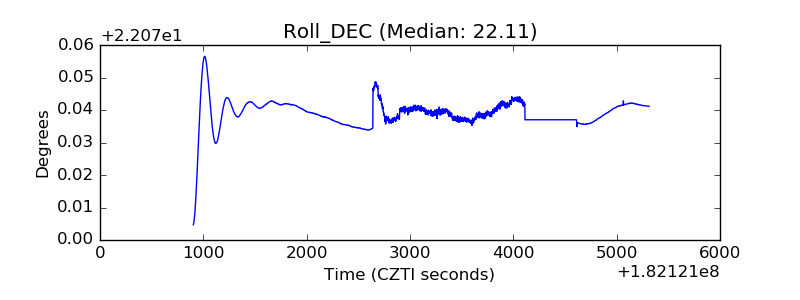 |
| _Roll_RA | 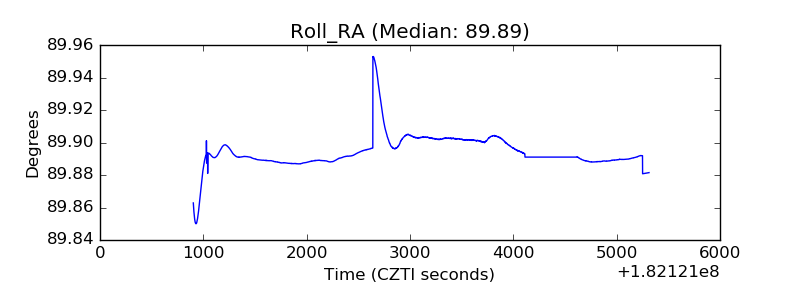 |
| Veto Counter | 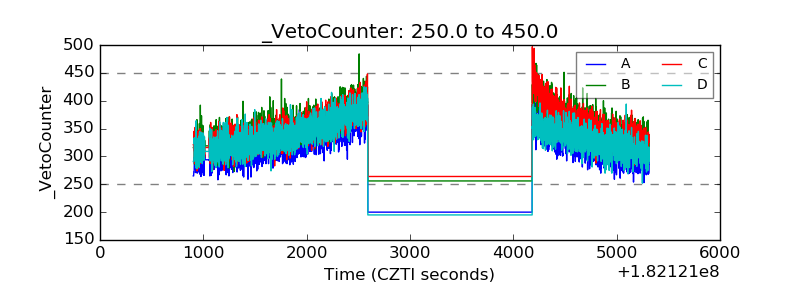 |