| Param | Original file | Final file |
|---|---|---|
| Filename | modeM0/AS1P01_134T04_9000000012_00177cztM0_level2.evt | modeM0/AS1P01_134T04_9000000012_00177cztM0_level2_quad_clean.evt |
| Size (bytes) | 933,932,160 | 62,418,240 |
| Size | 890.7 MB | 59.5 MB |
| Events in quadrant A | 6,723,672 | 370,544 |
| Events in quadrant B | 6,802,196 | 378,772 |
| Events in quadrant C | 6,173,734 | 376,563 |
| Events in quadrant D | 8,202,442 | 362,283 |
| Mode M9 | |||
|---|---|---|---|
| Quadrant | BADHDUFLAG | Total packets | Discarded packets |
| A | 0 | 16 | 0 |
| B | 0 | 16 | 0 |
| C | 0 | 16 | 0 |
| D | 0 | 16 | 0 |
| Mode SS | |||
|---|---|---|---|
| Quadrant | BADHDUFLAG | Total packets | Discarded packets |
| A | 0 | 116 | 0 |
| B | 0 | 116 | 0 |
| C | 0 | 116 | 0 |
| D | 0 | 116 | 0 |
| Mode M0 | |||
|---|---|---|---|
| Quadrant | BADHDUFLAG | Total packets | Discarded packets |
| A | 0 | 24082 | 2 |
| B | 0 | 24276 | 1 |
| C | 0 | 22455 | 1 |
| D | 0 | 28445 | 1 |
| Quadrant | Total seconds | Saturated seconds | Saturation percentage |
|---|---|---|---|
| A | 5761 | 10 | 0.173581% |
| B | 5761 | 31 | 0.538101% |
| C | 5761 | 23 | 0.399236% |
| D | 5761 | 240 | 4.165943% |
Noise dominated data is calculated using 1-second bins in cleaned event files. If a bin has >2000 counts, and if more than 50% of those come from <1% of pixels, then it is considered to be noise-dominated and hence unusable.
| Quadrant | # 1 sec bins | Bins with >0 counts | Bins with >2000 counts | High rate bins dominated by noise | Noise dominated (total time) | Noise dominated (detector-on time) | Marked lightcurve |
|---|---|---|---|---|---|---|---|
| A | 7352 | 5763 | 157 | 157 | 2.14% | 2.72% | 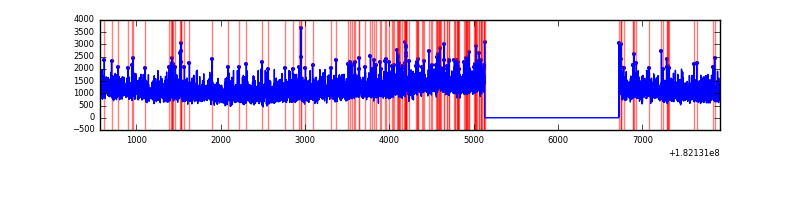 |
| B | 7352 | 5763 | 167 | 167 | 2.27% | 2.90% | 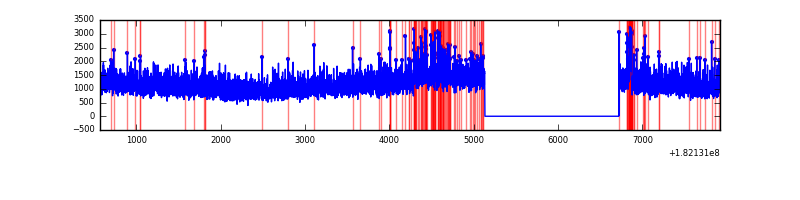 |
| C | 7352 | 5763 | 95 | 95 | 1.29% | 1.65% | 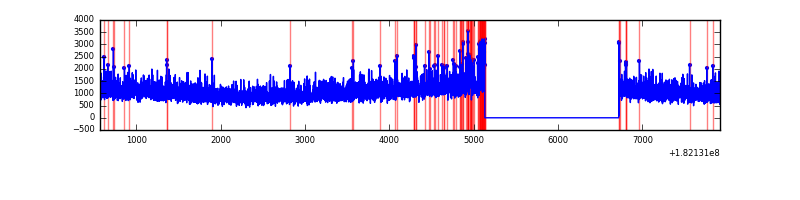 |
| D | 7352 | 5763 | 813 | 813 | 11.06% | 14.11% | 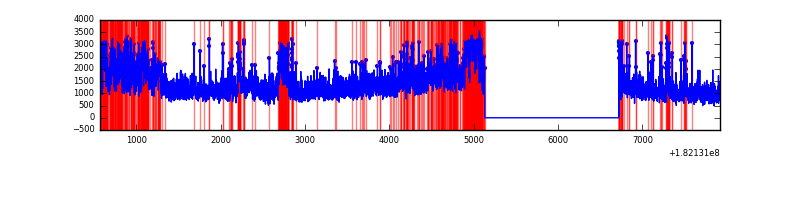 |
Top three noisy pixels from each quadrant. If the there are fewer than three noisy pixels in the level2.evt file, extra rows are filled as -1
| Pixel properties | Quadrant properties | ||||||
|---|---|---|---|---|---|---|---|
| Quadrant | DetID | PixID | Counts | Sigma | Mean | Median | Sigma |
| A | 14 | 10 | 71406 | 189.57 | 1673 | 1660 | 367.9 |
| A | 7 | 128 | 48662 | 127.75 | 1673 | 1660 | 367.9 |
| A | 0 | 6 | 38732 | 100.76 | 1673 | 1660 | 367.9 |
| B | 10 | 199 | 212548 | 533.55 | 1692 | 1706 | 395.2 |
| B | 8 | 5 | 60923 | 149.85 | 1692 | 1706 | 395.2 |
| B | 5 | 216 | 14867 | 33.3 | 1692 | 1706 | 395.2 |
| C | 0 | 202 | 95065 | 218.85 | 1525 | 1582 | 427.2 |
| C | 9 | 201 | 29497 | 65.35 | 1525 | 1582 | 427.2 |
| C | 10 | 33 | 10081 | 19.9 | 1525 | 1582 | 427.2 |
| D | 2 | 121 | 1014603 | 2216.49 | 1481 | 1529 | 457.1 |
| D | 13 | 89 | 733908 | 1602.36 | 1481 | 1529 | 457.1 |
| D | 2 | 239 | 303757 | 661.24 | 1481 | 1529 | 457.1 |
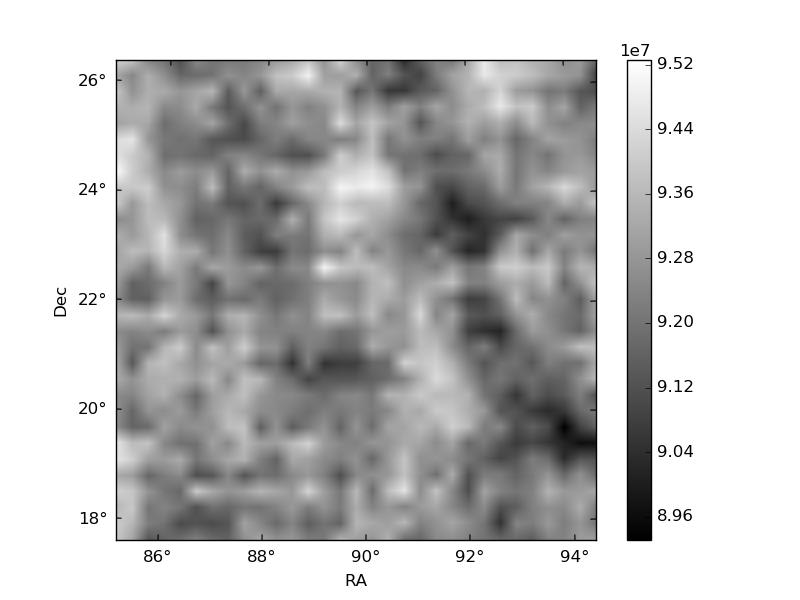
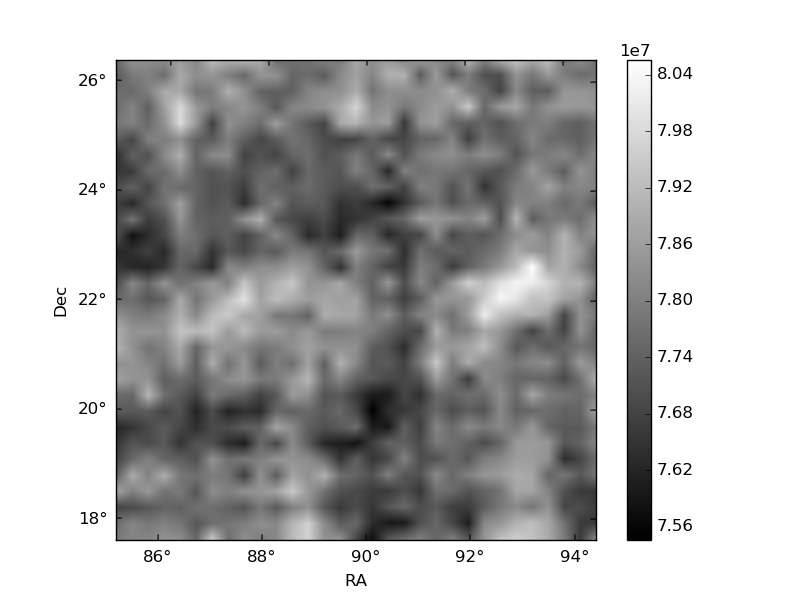
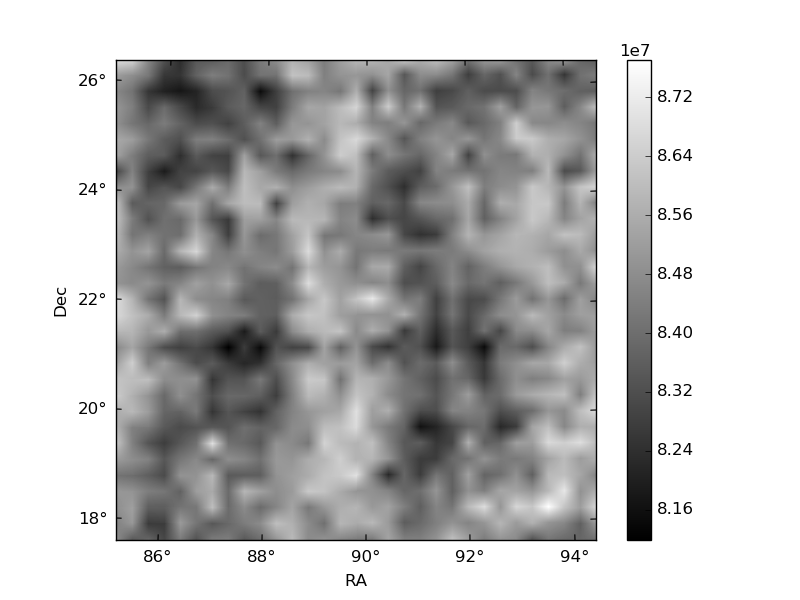
Histogram calculated using DETX and DETY for each event in the final _common_clean file
| Quadrant A | 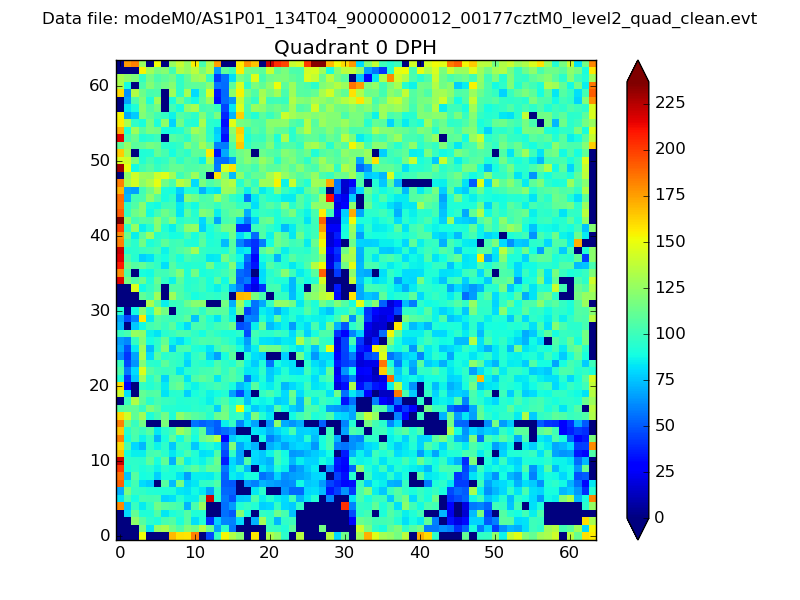 |
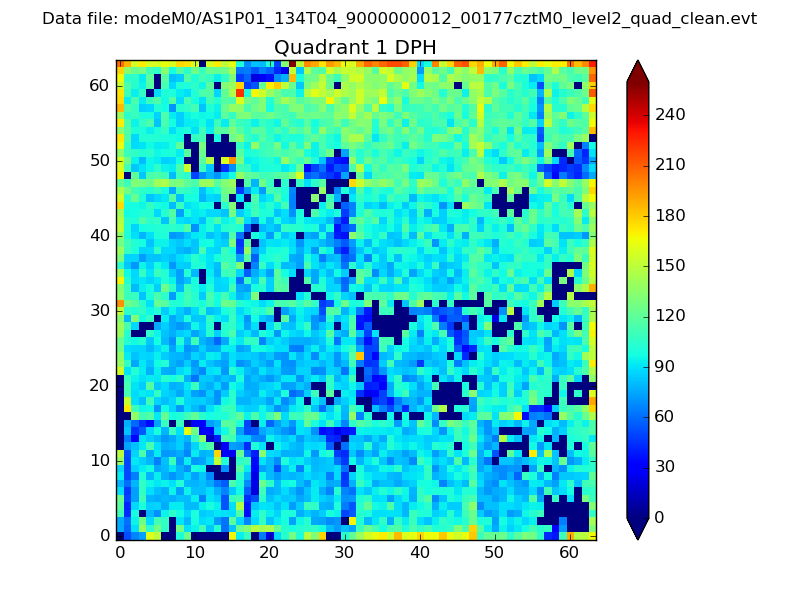 |
Quadrant B |
|---|---|---|---|
| Quadrant D | 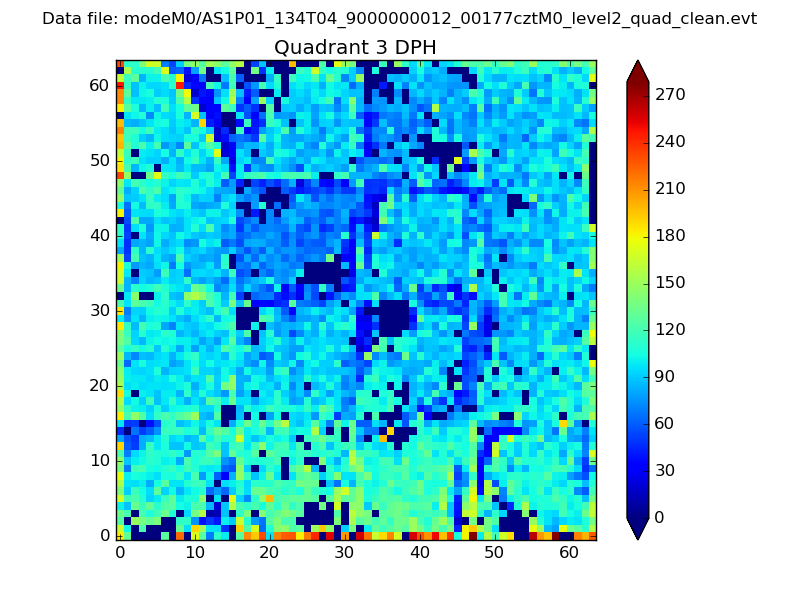 |
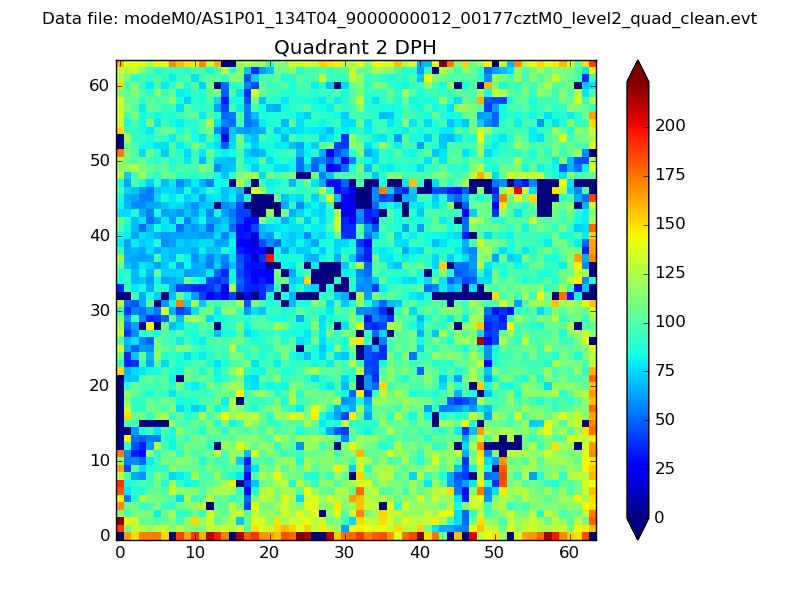 |
Quadrant C |
| Plot type | Count rate plots | Images |
|---|---|---|
| Comparison with Poisson distribution Blue bars denote a histogram of data divided into 1 sec bins. Red curve is a Poisson curve with rate = median count rate of data. |
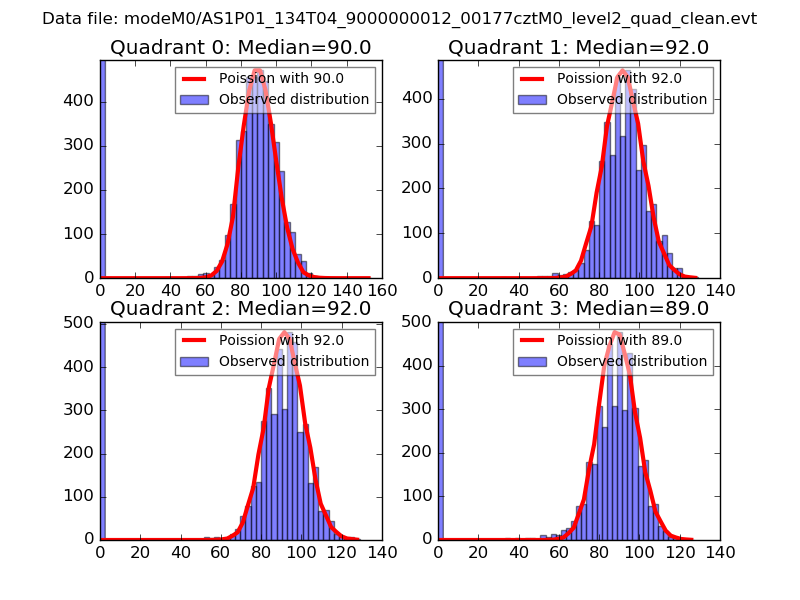 |
 |
| Quadrant-wise count rates Data is divided into 100 sec bins |
 |
|
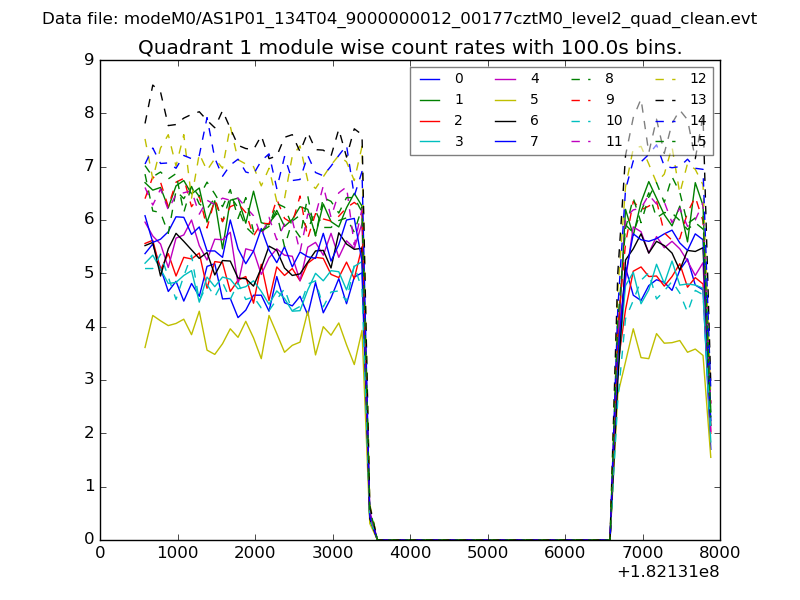
| Module-wise count rates for Quadrant A Data is divided into 100 sec bins |
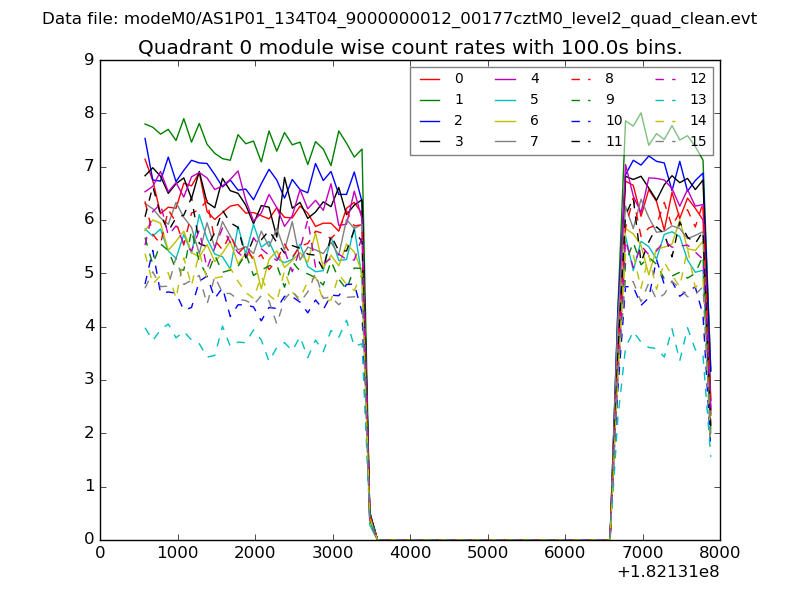 |
 |
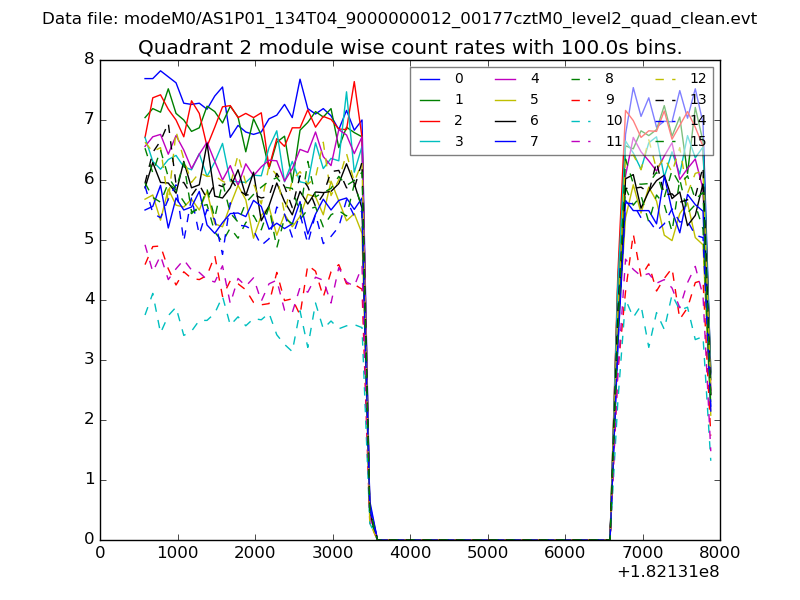
| Module-wise count rates for Quadrant B Data is divided into 100 sec bins |
 |
 |
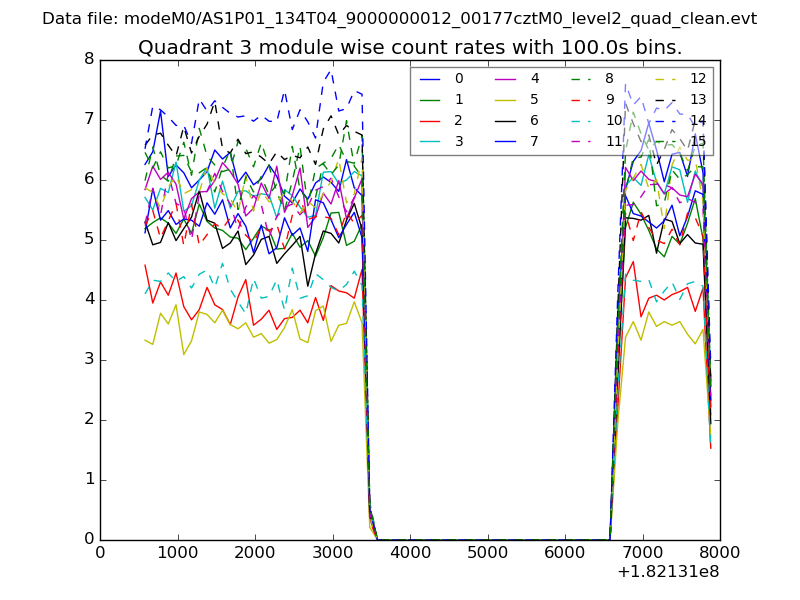
| Module-wise count rates for Quadrant C Data is divided into 100 sec bins |
 |
 |
| Module-wise count rates for Quadrant D Data is divided into 100 sec bins |
 |
 |
| Parameter | Plot |
|---|---|
| CZT HV Monitor | 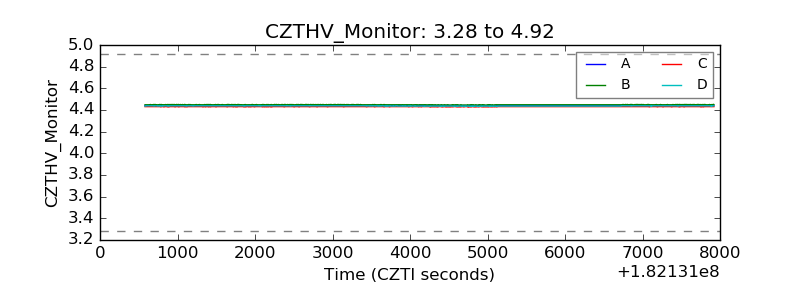 |
| D_VDD | 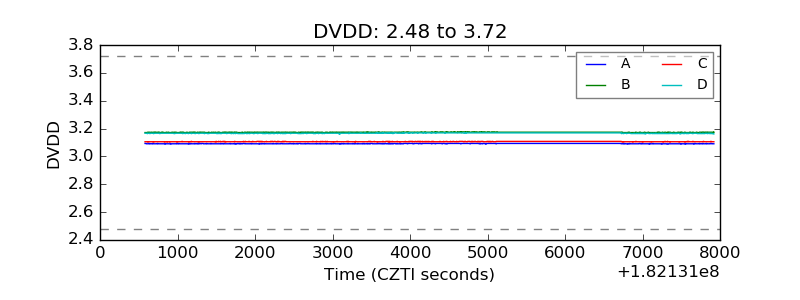 |
| Temperature 1 | 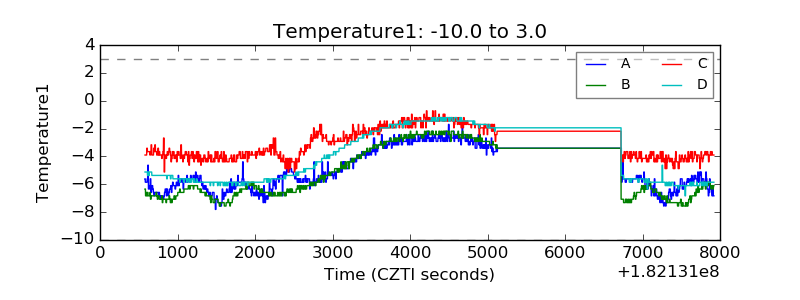 |
| Veto HV Monitor | 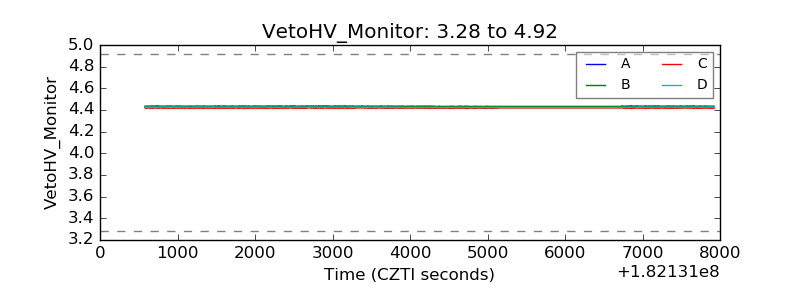 |
| Veto LLD | 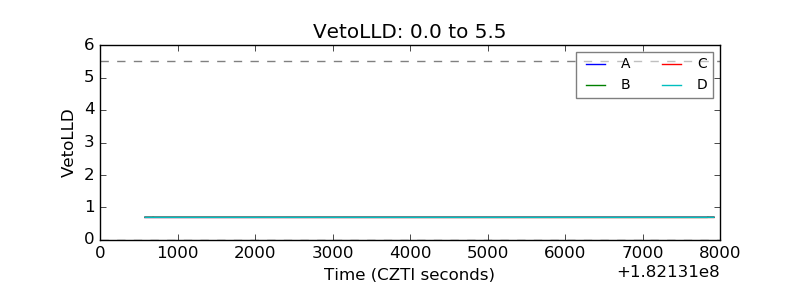 |
| Alpha Counter | 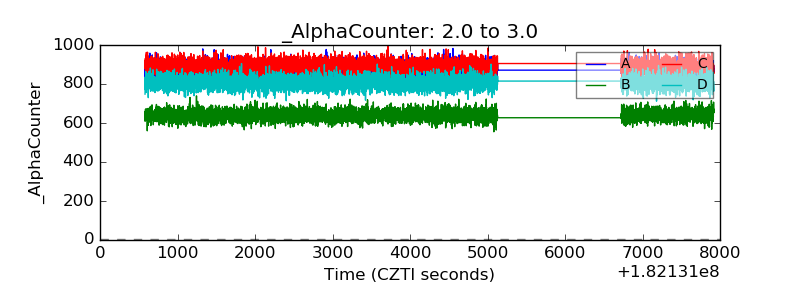 |
| _CPM_Rate | 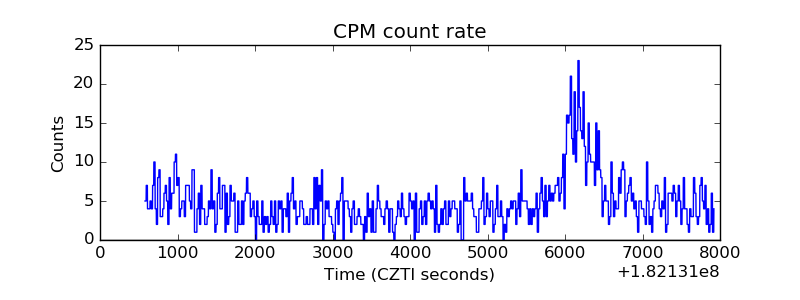 |
| CZT Counter | 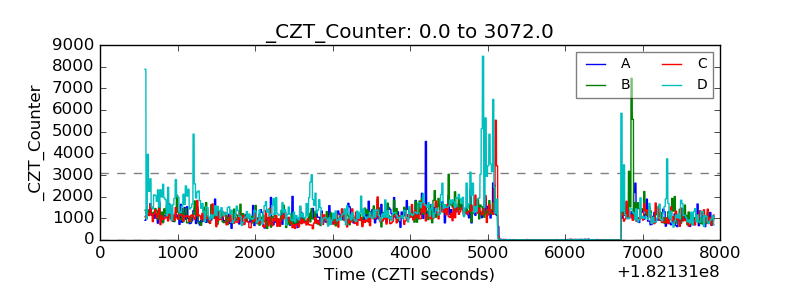 |
| +2.5 Volts monitor |  |
| +5 Volts monitor | 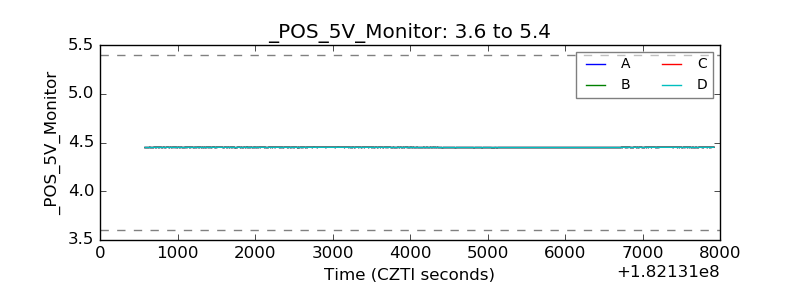 |
| _ROLL_ROT | 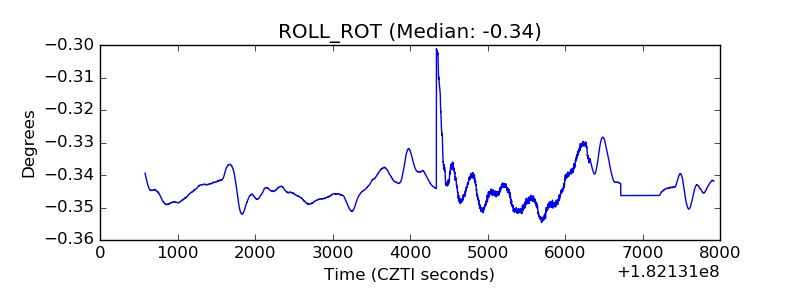 |
| _Roll_DEC | 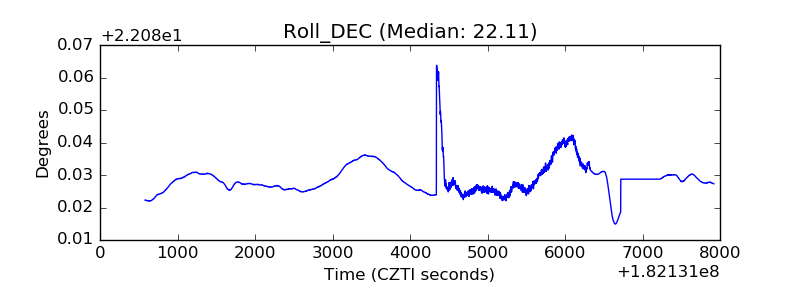 |
| _Roll_RA | 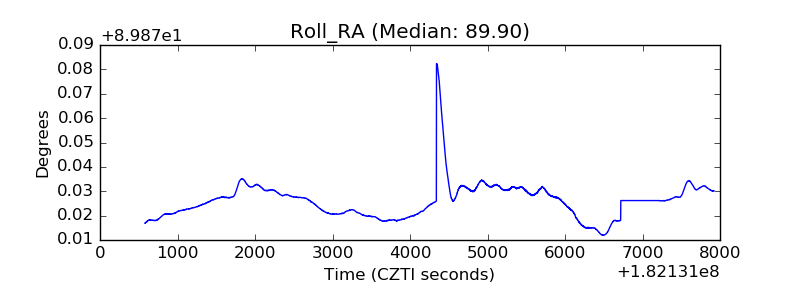 |
| Veto Counter | 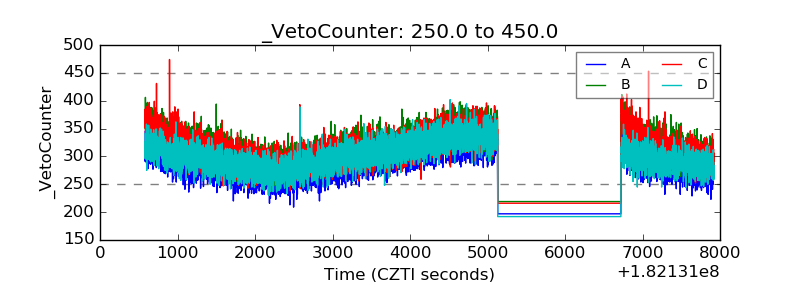 |