| Param | Original file | Final file |
|---|---|---|
| Filename | modeM0/AS1P01_134T04_9000000012_00178cztM0_level2.evt | modeM0/AS1P01_134T04_9000000012_00178cztM0_level2_quad_clean.evt |
| Size (bytes) | 693,429,120 | 52,128,000 |
| Size | 661.3 MB | 49.7 MB |
| Events in quadrant A | 5,281,869 | 310,441 |
| Events in quadrant B | 5,261,738 | 315,976 |
| Events in quadrant C | 4,944,739 | 315,138 |
| Events in quadrant D | 5,197,821 | 306,374 |
| Mode M9 | |||
|---|---|---|---|
| Quadrant | BADHDUFLAG | Total packets | Discarded packets |
| A | 0 | 16 | 11 |
| B | 0 | 15 | 11 |
| C | 0 | 16 | 10 |
| D | 0 | 16 | 10 |
| Mode SS | |||
|---|---|---|---|
| Quadrant | BADHDUFLAG | Total packets | Discarded packets |
| A | 0 | 114 | 18 |
| B | 0 | 114 | 16 |
| C | 0 | 114 | 18 |
| D | 0 | 114 | 12 |
| Mode M0 | |||
|---|---|---|---|
| Quadrant | BADHDUFLAG | Total packets | Discarded packets |
| A | 0 | 23881 | 4836 |
| B | 0 | 23937 | 4962 |
| C | 0 | 22192 | 4110 |
| D | 0 | 26049 | 7251 |
| Quadrant | Total seconds | Saturated seconds | Saturation percentage |
|---|---|---|---|
| A | 4692 | 4 | 0.085251% |
| B | 4676 | 5 | 0.106929% |
| C | 4726 | 31 | 0.655946% |
| D | 4661 | 102 | 2.188372% |
Noise dominated data is calculated using 1-second bins in cleaned event files. If a bin has >2000 counts, and if more than 50% of those come from <1% of pixels, then it is considered to be noise-dominated and hence unusable.
| Quadrant | # 1 sec bins | Bins with >0 counts | Bins with >2000 counts | High rate bins dominated by noise | Noise dominated (total time) | Noise dominated (detector-on time) | Marked lightcurve |
|---|---|---|---|---|---|---|---|
| A | 7191 | 4850 | 102 | 102 | 1.42% | 2.10% |  |
| B | 7191 | 4841 | 68 | 68 | 0.95% | 1.40% | 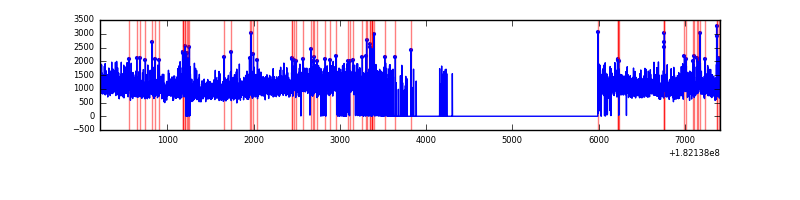 |
| C | 7191 | 4888 | 113 | 113 | 1.57% | 2.31% | 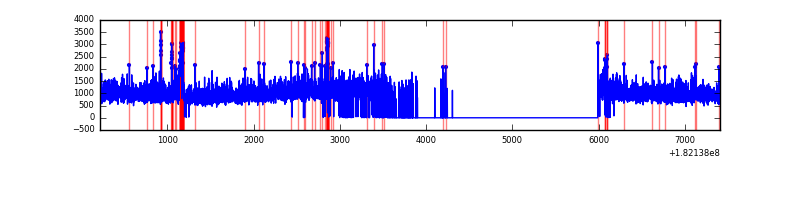 |
| D | 7191 | 4814 | 209 | 209 | 2.91% | 4.34% | 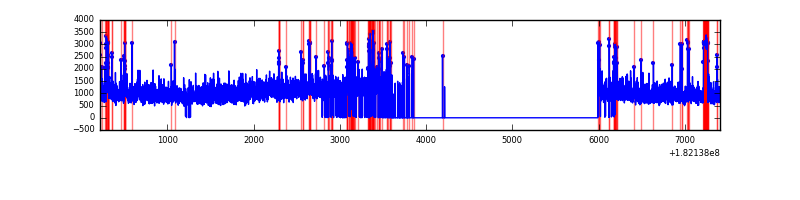 |
Top three noisy pixels from each quadrant. If the there are fewer than three noisy pixels in the level2.evt file, extra rows are filled as -1
| Pixel properties | Quadrant properties | ||||||
|---|---|---|---|---|---|---|---|
| Quadrant | DetID | PixID | Counts | Sigma | Mean | Median | Sigma |
| A | 7 | 128 | 50539 | 171.4 | 1311 | 1304 | 287.3 |
| A | 14 | 10 | 46590 | 157.65 | 1311 | 1304 | 287.3 |
| A | 13 | 66 | 27284 | 90.44 | 1311 | 1304 | 287.3 |
| B | 10 | 199 | 200965 | 646.85 | 1308 | 1315 | 308.7 |
| B | 5 | 85 | 14371 | 42.3 | 1308 | 1315 | 308.7 |
| B | 5 | 216 | 11709 | 33.68 | 1308 | 1315 | 308.7 |
| C | 0 | 202 | 142472 | 428.51 | 1179 | 1221 | 329.6 |
| C | 9 | 201 | 61449 | 182.71 | 1179 | 1221 | 329.6 |
| C | 10 | 17 | 25512 | 73.69 | 1179 | 1221 | 329.6 |
| D | 2 | 121 | 215740 | 609.99 | 1145 | 1181 | 351.7 |
| D | 13 | 89 | 173089 | 488.73 | 1145 | 1181 | 351.7 |
| D | 2 | 63 | 145600 | 410.58 | 1145 | 1181 | 351.7 |
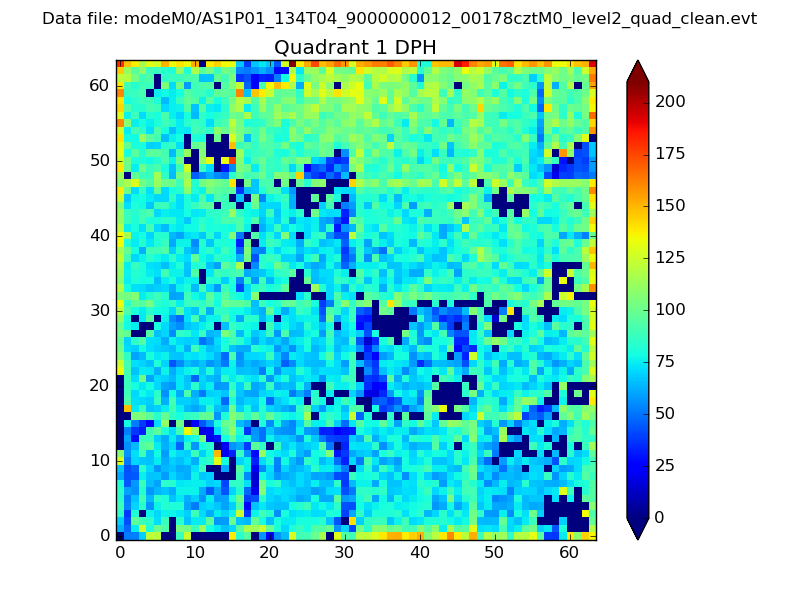
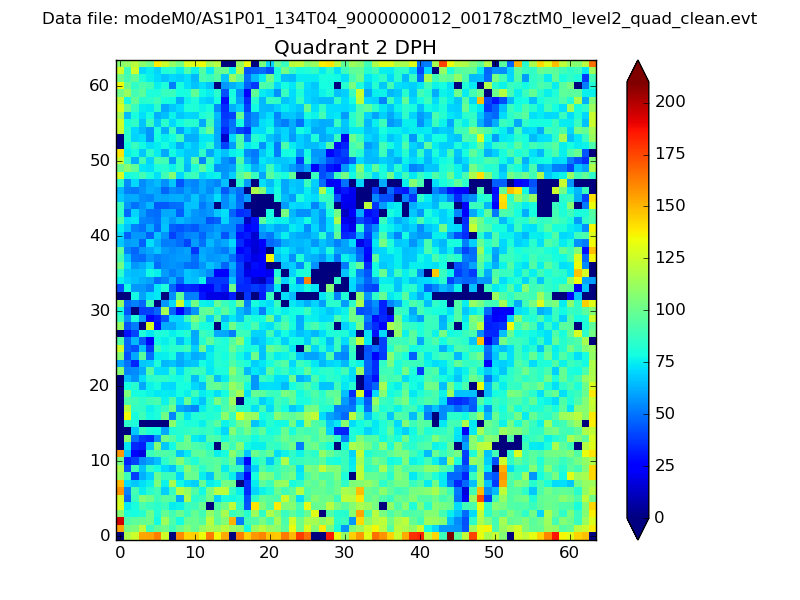
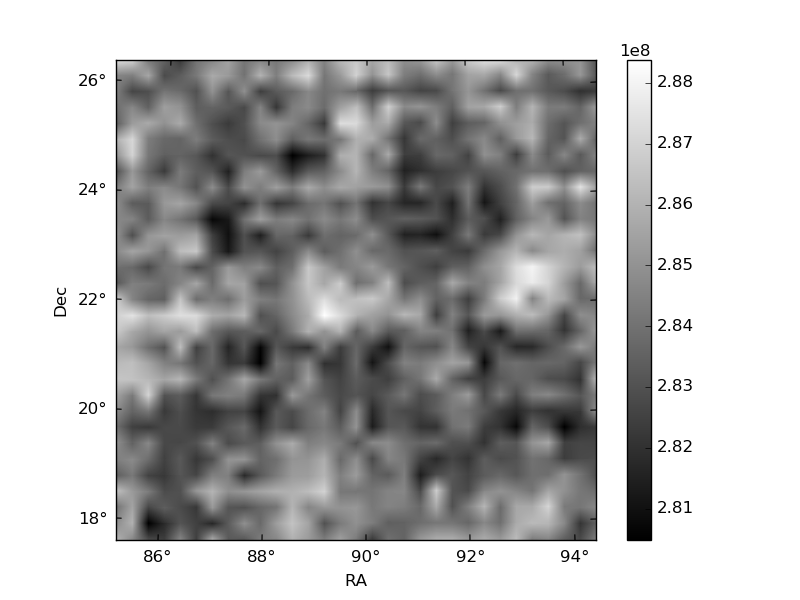
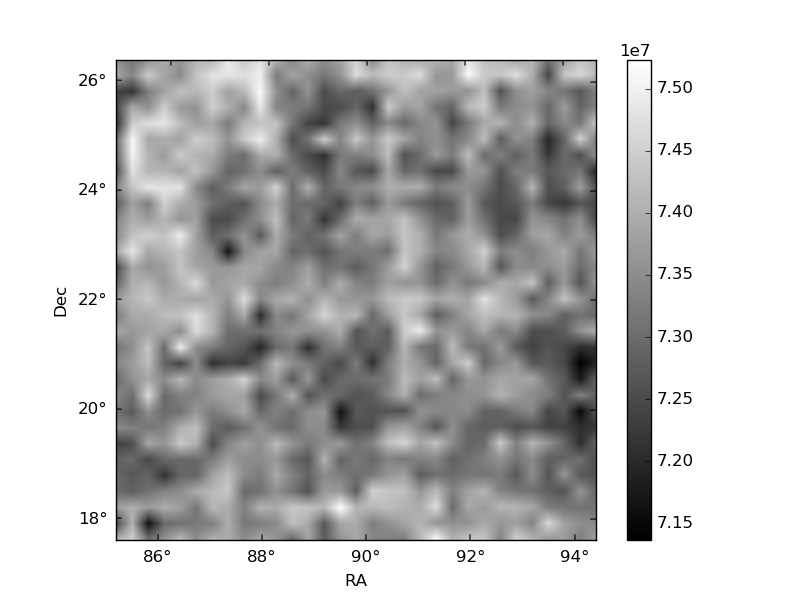
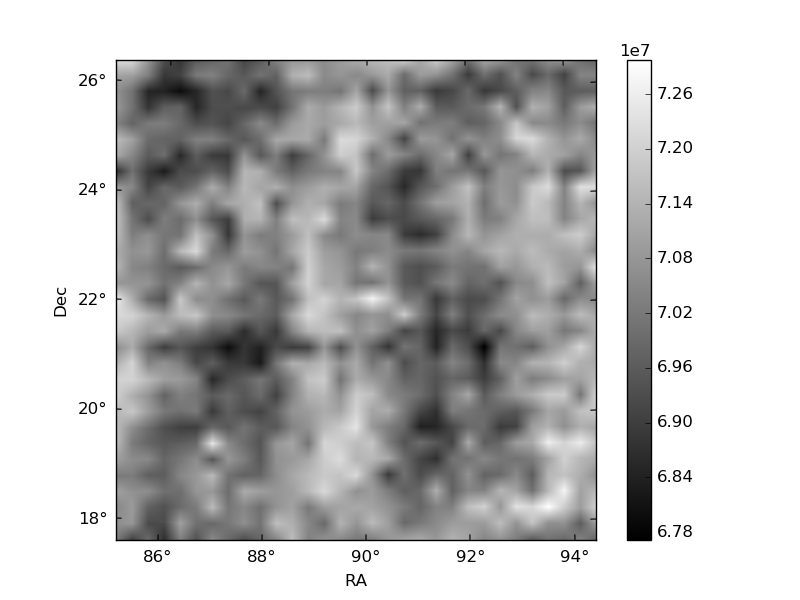
Histogram calculated using DETX and DETY for each event in the final _common_clean file
| Quadrant A | 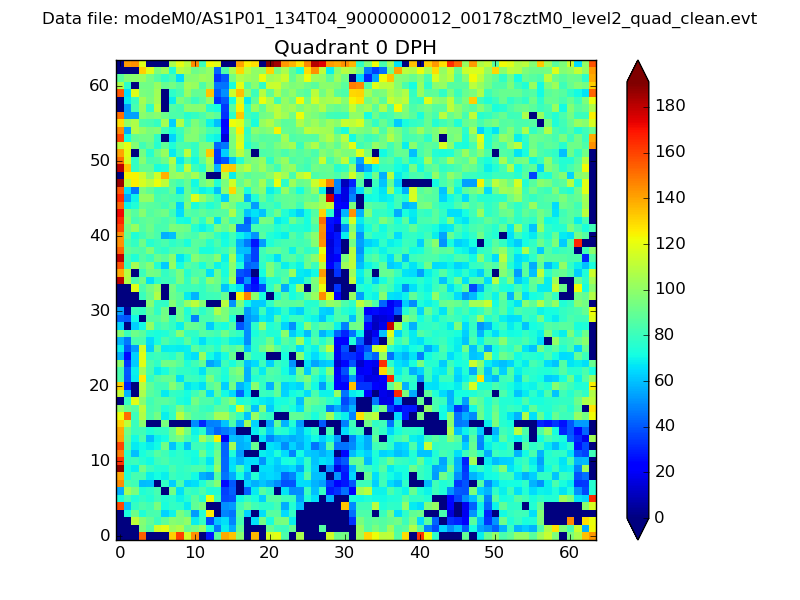 |
 |
Quadrant B |
|---|---|---|---|
| Quadrant D | 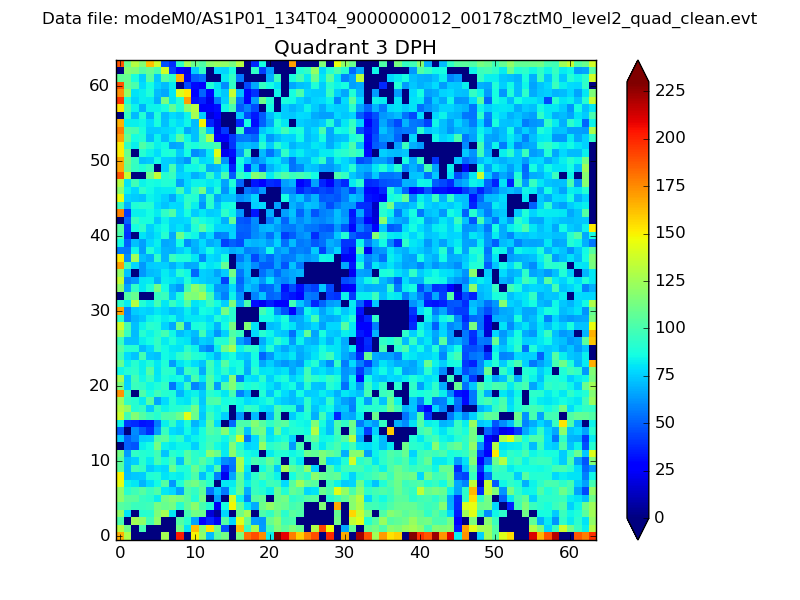 |
 |
Quadrant C |
| Plot type | Count rate plots | Images |
|---|---|---|
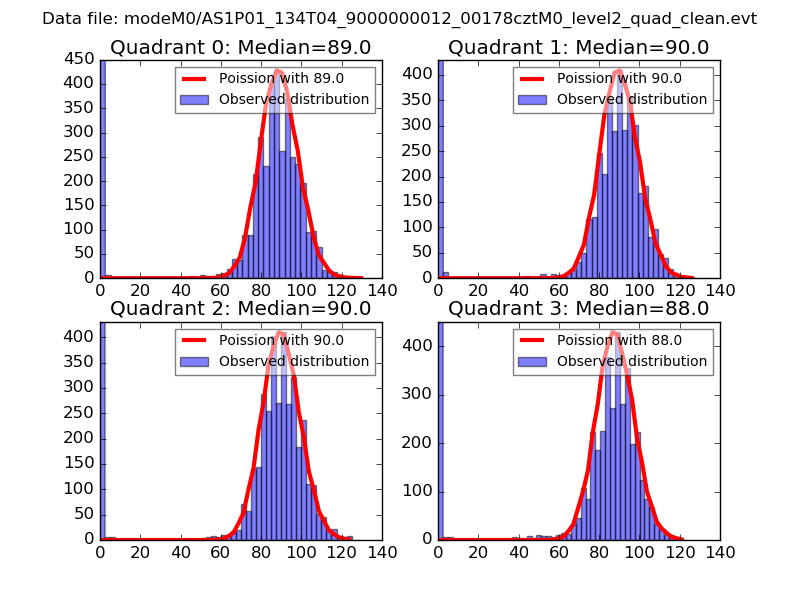
| Comparison with Poisson distribution Blue bars denote a histogram of data divided into 1 sec bins. Red curve is a Poisson curve with rate = median count rate of data. |
 |
 |
| Quadrant-wise count rates Data is divided into 100 sec bins |
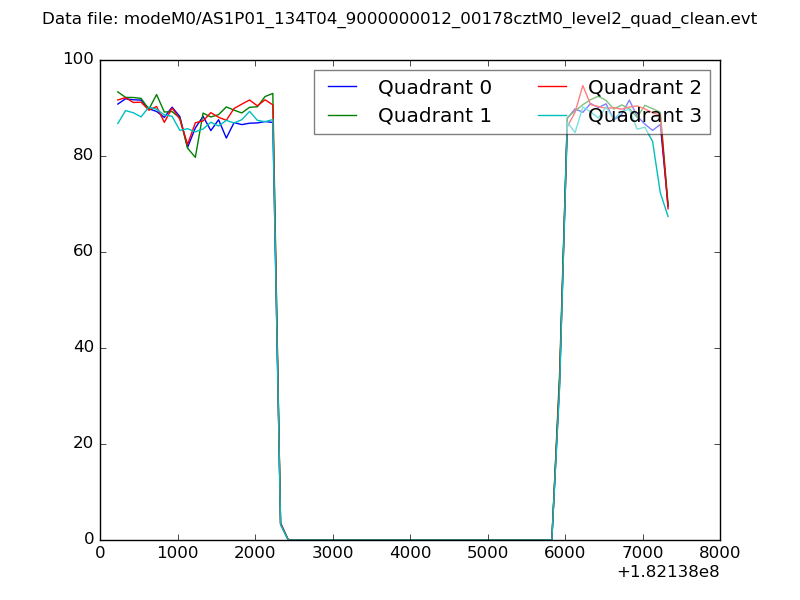 |
|
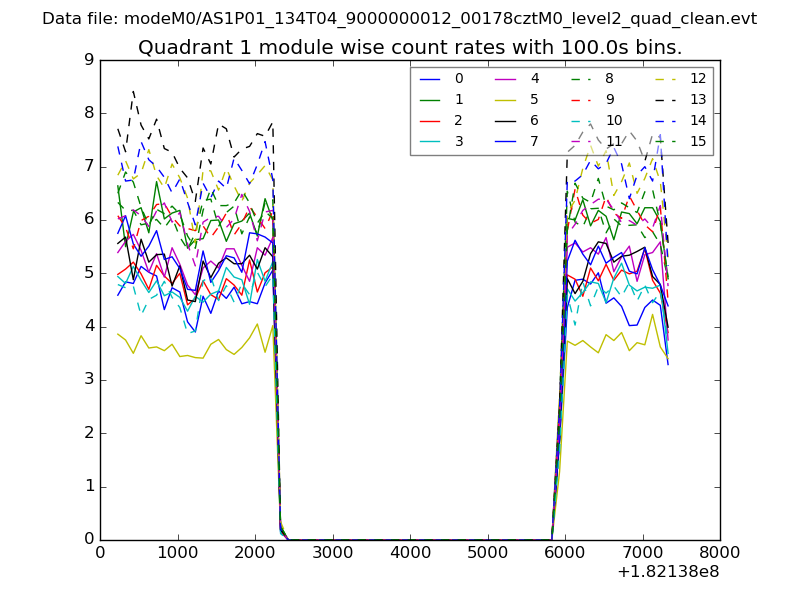
| Module-wise count rates for Quadrant A Data is divided into 100 sec bins |
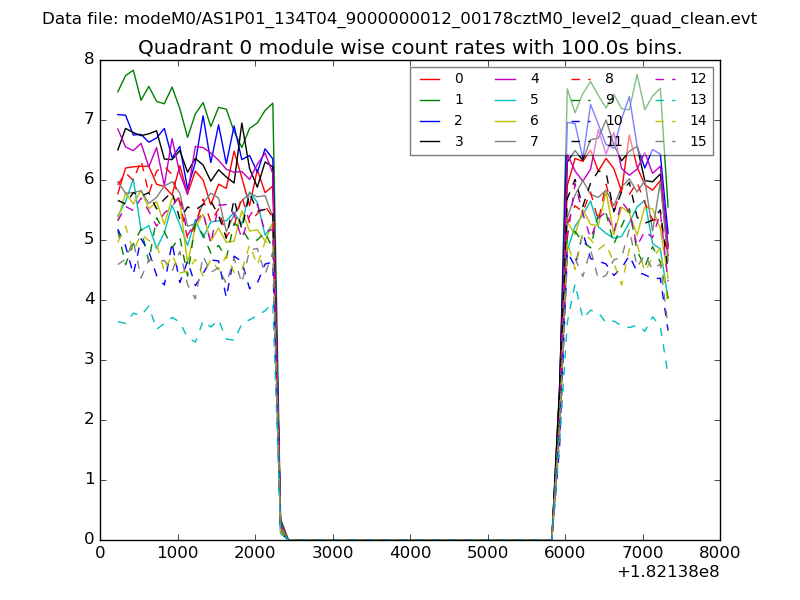 |
 |
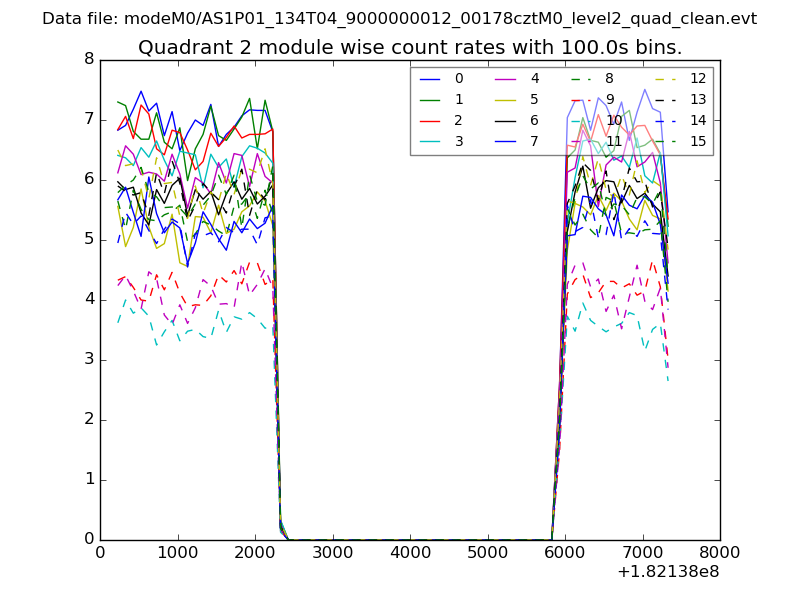
| Module-wise count rates for Quadrant B Data is divided into 100 sec bins |
 |
 |
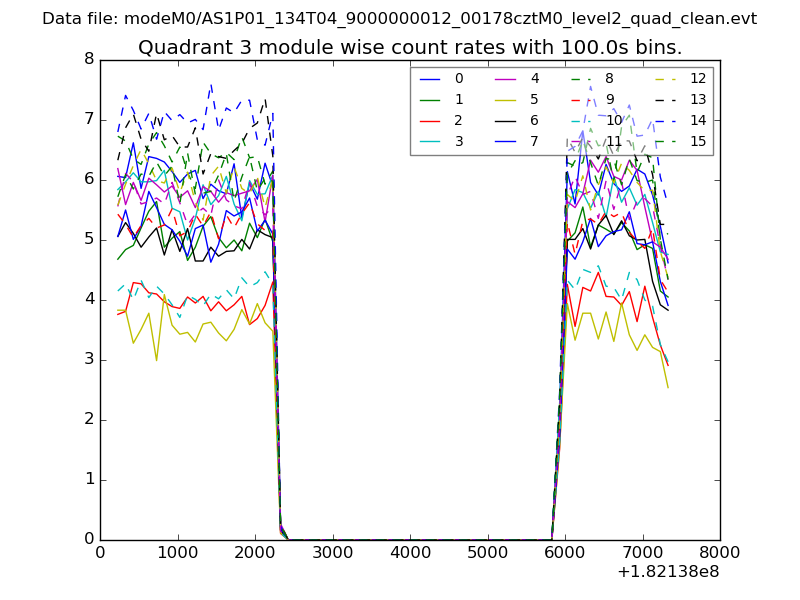
| Module-wise count rates for Quadrant C Data is divided into 100 sec bins |
 |
 |
| Module-wise count rates for Quadrant D Data is divided into 100 sec bins |
 |
 |
| Parameter | Plot |
|---|---|
| CZT HV Monitor | 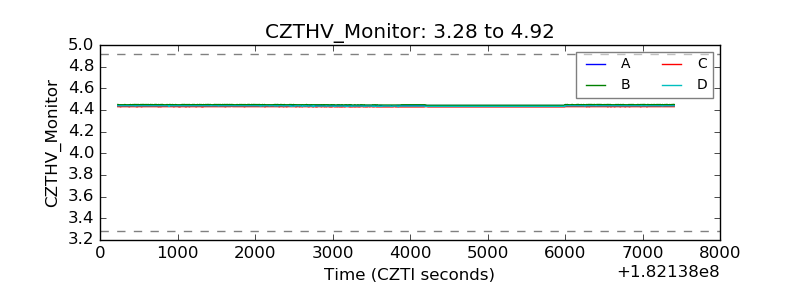 |
| D_VDD | 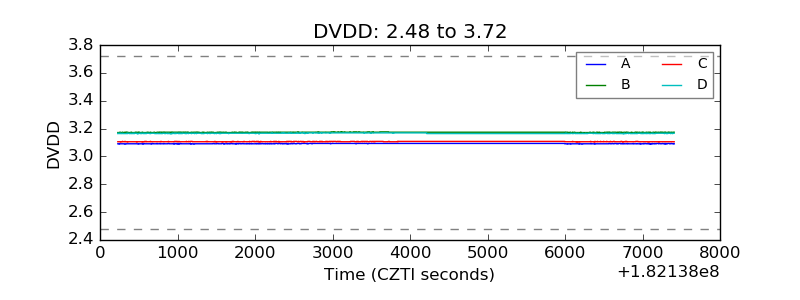 |
| Temperature 1 | 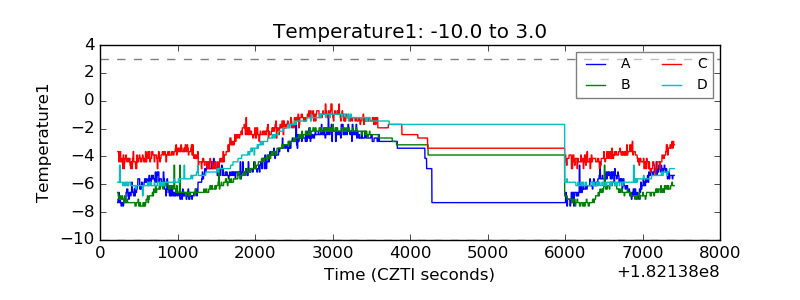 |
| Veto HV Monitor | 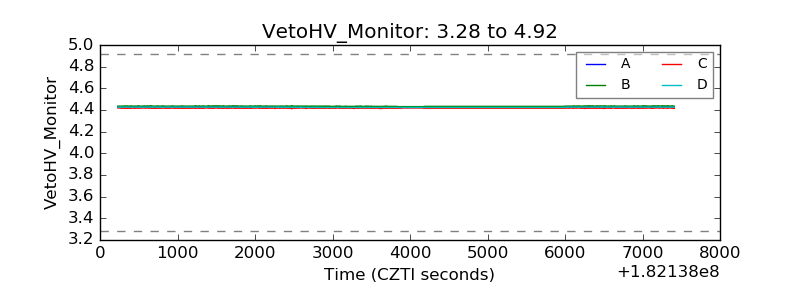 |
| Veto LLD | 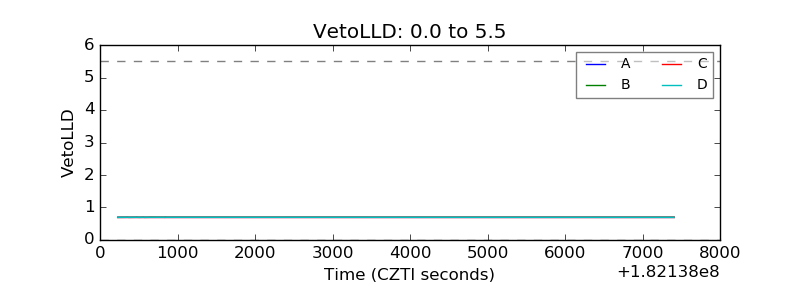 |
| Alpha Counter | 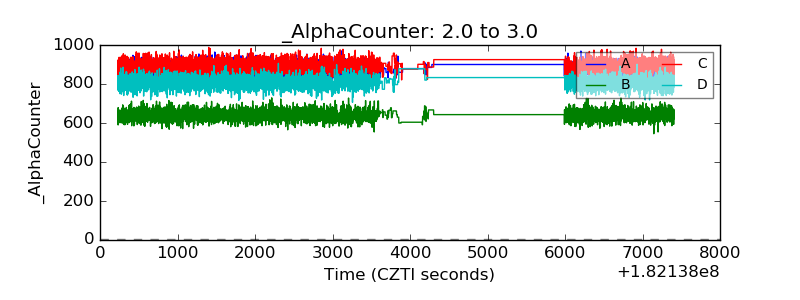 |
| _CPM_Rate | 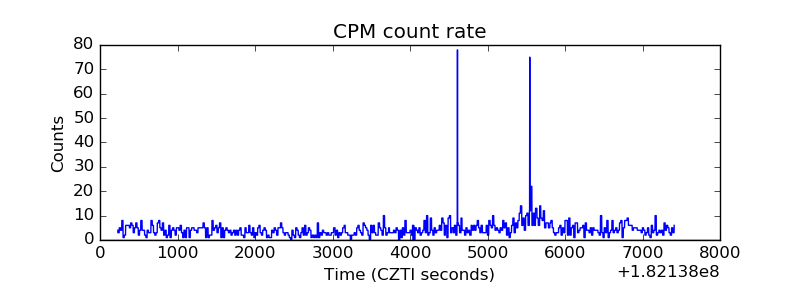 |
| CZT Counter | 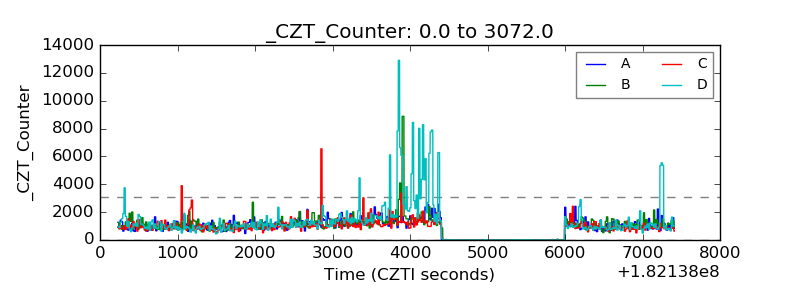 |
| +2.5 Volts monitor | 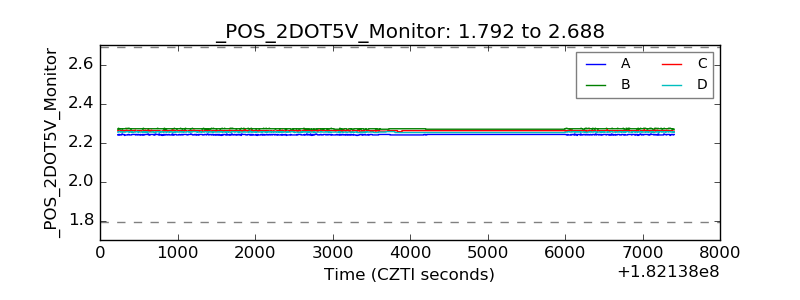 |
| +5 Volts monitor |  |
| _ROLL_ROT | 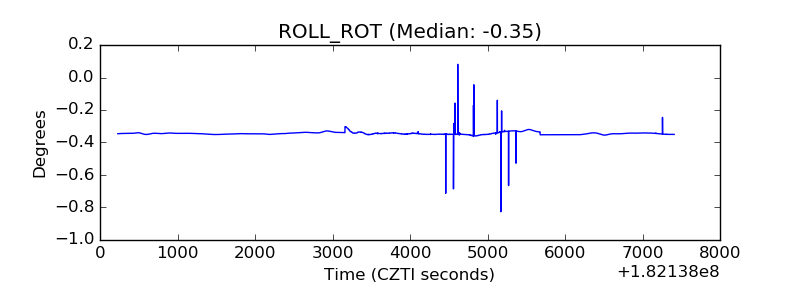 |
| _Roll_DEC | 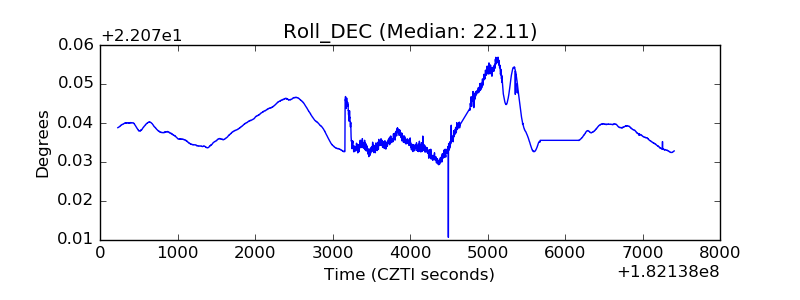 |
| _Roll_RA | 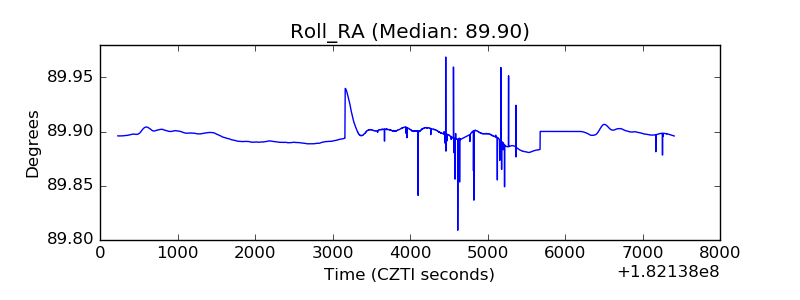 |
| Veto Counter | 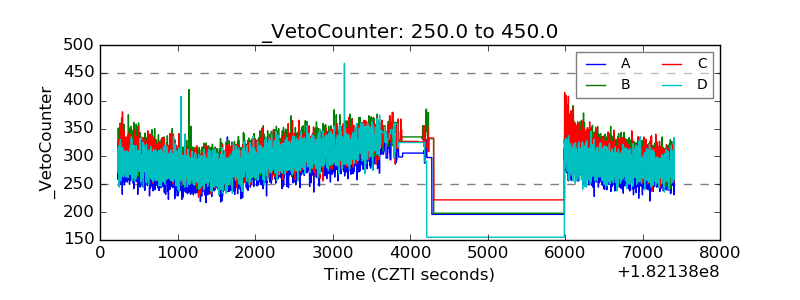 |