| Param | Original file | Final file |
|---|---|---|
| Filename | modeM0/AS1P01_120T01_9000000016_00187cztM0_level2.evt | modeM0/AS1P01_120T01_9000000016_00187cztM0_level2_quad_clean.evt |
| Size (bytes) | 964,612,800 | 73,298,880 |
| Size | 919.9 MB | 69.9 MB |
| Events in quadrant A | 6,754,228 | 460,264 |
| Events in quadrant B | 6,720,120 | 474,751 |
| Events in quadrant C | 6,244,033 | 468,683 |
| Events in quadrant D | 9,134,703 | 434,985 |
| Mode SS | |||
|---|---|---|---|
| Quadrant | BADHDUFLAG | Total packets | Discarded packets |
| A | 0 | 224 | 112 |
| B | 0 | 224 | 112 |
| C | 0 | 224 | 112 |
| D | 0 | 224 | 112 |
| Mode M0 | |||
|---|---|---|---|
| Quadrant | BADHDUFLAG | Total packets | Discarded packets |
| A | 0 | 47827 | 23915 |
| B | 0 | 47650 | 23826 |
| C | 0 | 44798 | 22406 |
| D | 0 | 62113 | 31058 |
| Mode M9 | |||
|---|---|---|---|
| Quadrant | BADHDUFLAG | Total packets | Discarded packets |
| A | 0 | 30 | 15 |
| B | 0 | 30 | 15 |
| C | 0 | 30 | 15 |
| D | 0 | 30 | 15 |
| Quadrant | Total seconds | Saturated seconds | Saturation percentage |
|---|---|---|---|
| A | 5436 | 5 | 0.091979% |
| B | 5436 | 8 | 0.147167% |
| C | 5435 | 2 | 0.036799% |
| D | 5436 | 659 | 12.122884% |
Noise dominated data is calculated using 1-second bins in cleaned event files. If a bin has >2000 counts, and if more than 50% of those come from <1% of pixels, then it is considered to be noise-dominated and hence unusable.
| Quadrant | # 1 sec bins | Bins with >0 counts | Bins with >2000 counts | High rate bins dominated by noise | Noise dominated (total time) | Noise dominated (detector-on time) | Marked lightcurve |
|---|---|---|---|---|---|---|---|
| A | 7027 | 5438 | 182 | 182 | 2.59% | 3.35% |  |
| B | 7027 | 5437 | 115 | 115 | 1.64% | 2.12% |  |
| C | 7027 | 5438 | 65 | 65 | 0.93% | 1.20% |  |
| D | 7027 | 5438 | 1573 | 1573 | 22.39% | 28.93% | 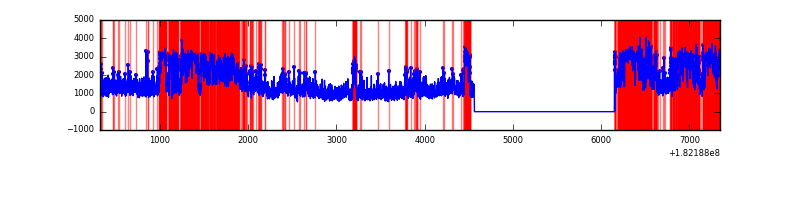 |
Top three noisy pixels from each quadrant. If the there are fewer than three noisy pixels in the level2.evt file, extra rows are filled as -1
| Pixel properties | Quadrant properties | ||||||
|---|---|---|---|---|---|---|---|
| Quadrant | DetID | PixID | Counts | Sigma | Mean | Median | Sigma |
| A | 13 | 17 | 41177 | 106.62 | 1701 | 1689 | 370.4 |
| A | 12 | 244 | 40463 | 104.69 | 1701 | 1689 | 370.4 |
| A | 15 | 127 | 31388 | 80.19 | 1701 | 1689 | 370.4 |
| B | 0 | 247 | 64110 | 157.71 | 1712 | 1720 | 395.6 |
| B | 5 | 85 | 21450 | 49.87 | 1712 | 1720 | 395.6 |
| B | 14 | 50 | 14828 | 33.13 | 1712 | 1720 | 395.6 |
| C | 10 | 33 | 17696 | 36.83 | 1576 | 1639 | 436.0 |
| C | 9 | 128 | 12121 | 24.04 | 1576 | 1639 | 436.0 |
| C | 0 | 188 | 7323 | 13.04 | 1576 | 1639 | 436.0 |
| D | 12 | 249 | 2947146 | 6466.28 | 1515 | 1568 | 455.5 |
| D | 13 | 6 | 187906 | 409.06 | 1515 | 1568 | 455.5 |
| D | 2 | 106 | 27339 | 56.57 | 1515 | 1568 | 455.5 |
Histogram calculated using DETX and DETY for each event in the final _common_clean file
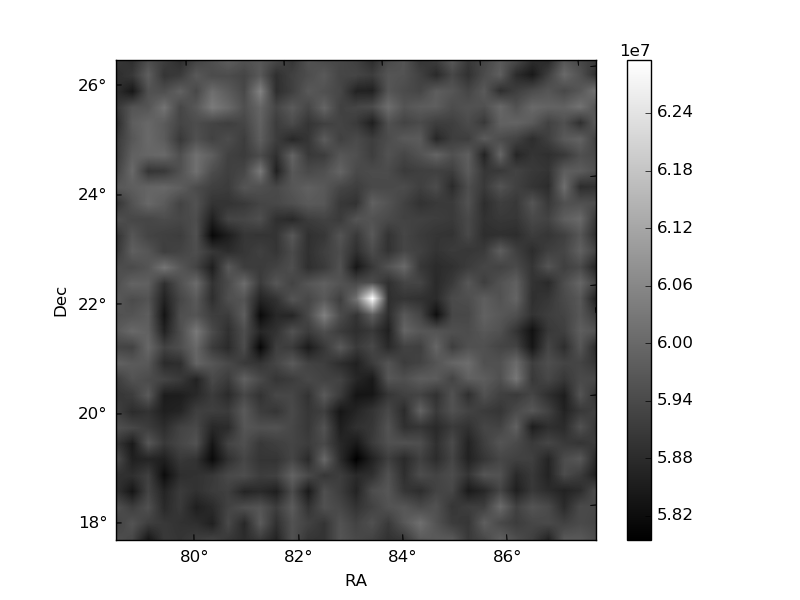
| Quadrant A | 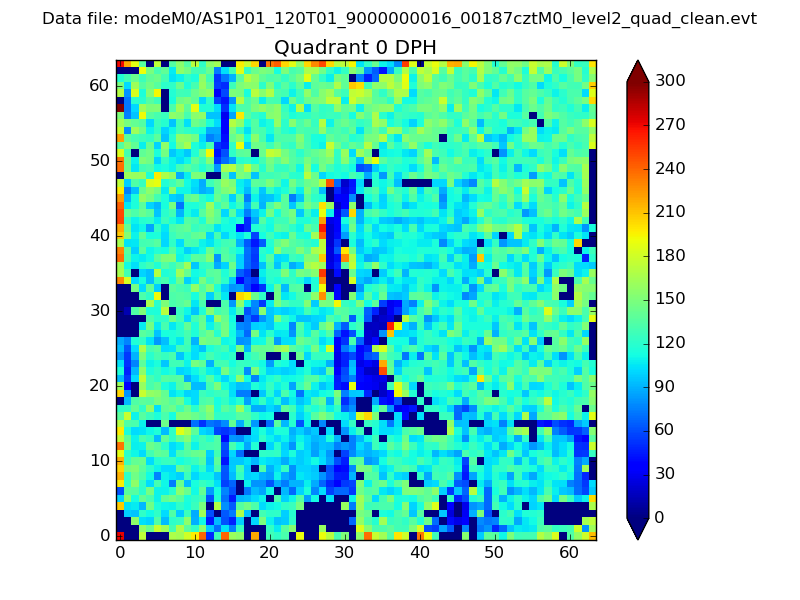 |
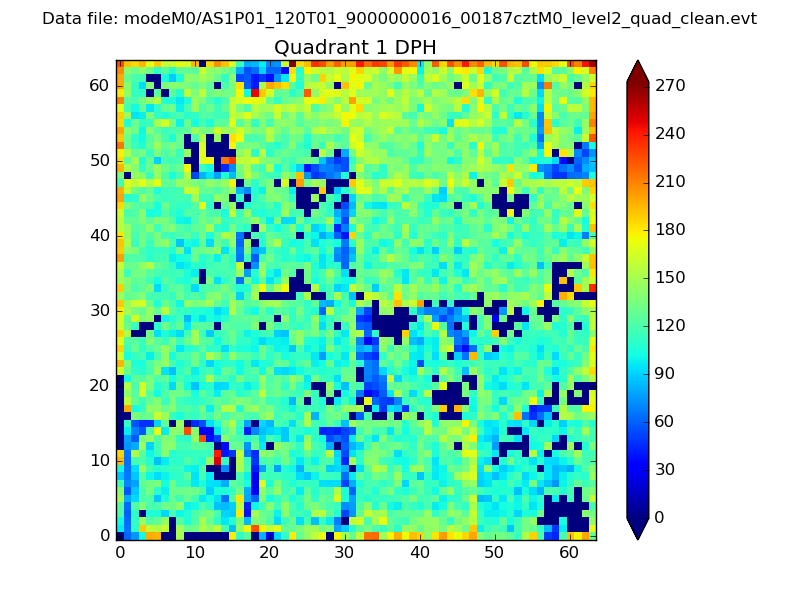 |
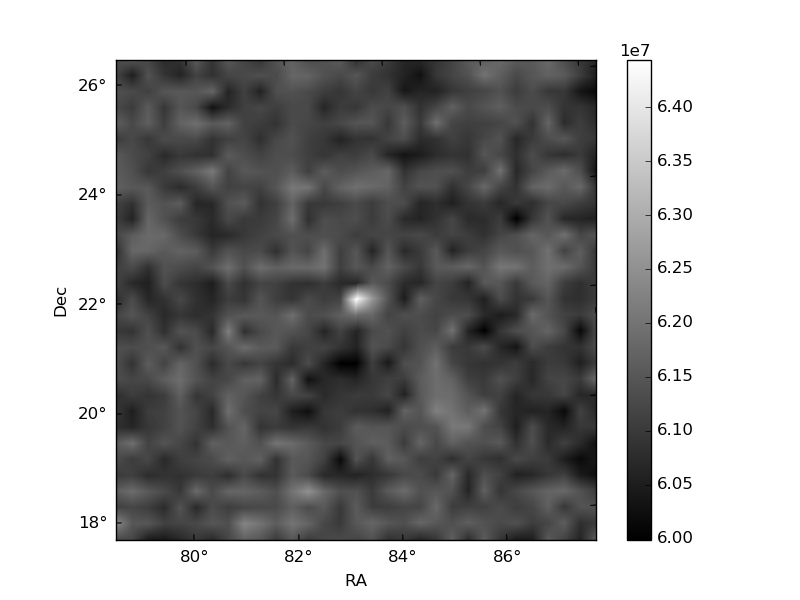
Quadrant B |
|---|---|---|---|
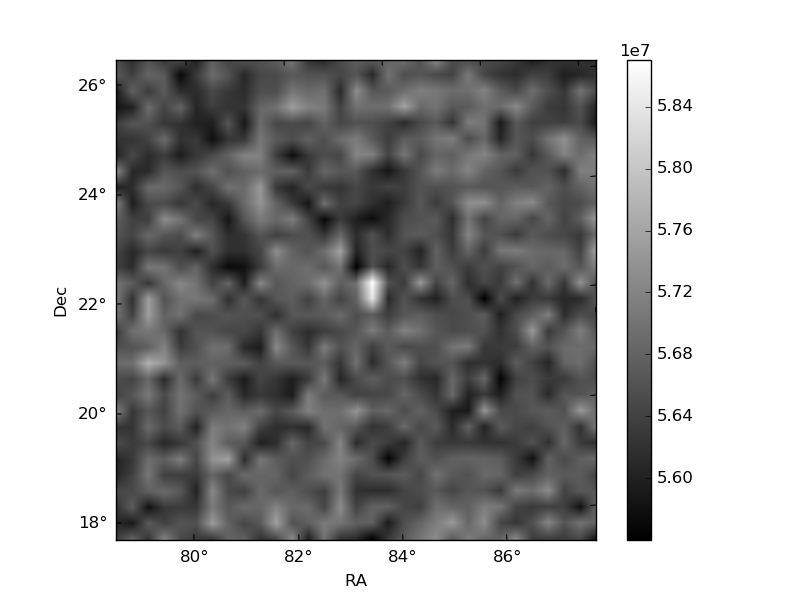
| Quadrant D | 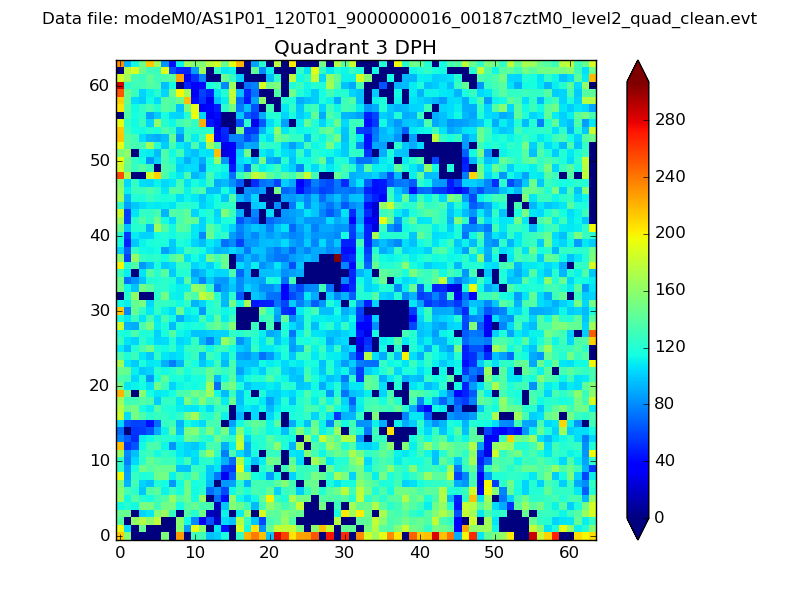 |
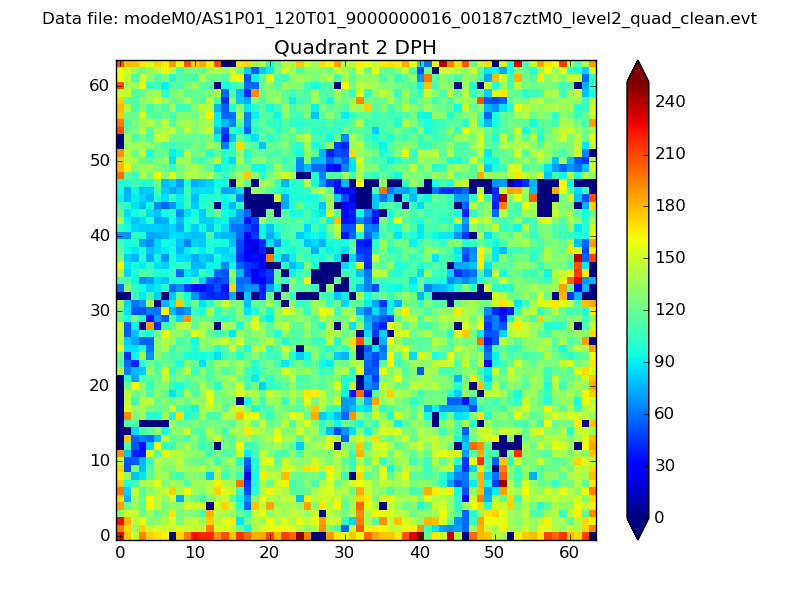 |
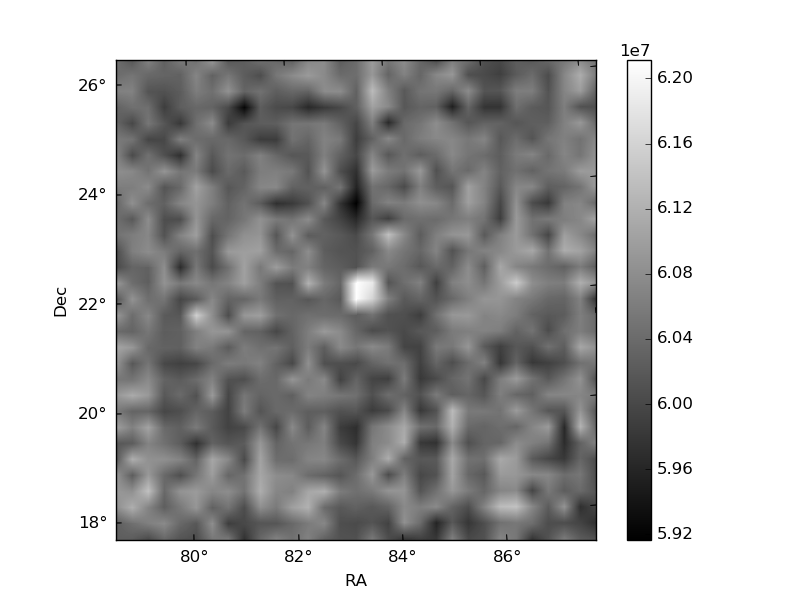
Quadrant C |
| Plot type | Count rate plots | Images |
|---|---|---|
| Comparison with Poisson distribution Blue bars denote a histogram of data divided into 1 sec bins. Red curve is a Poisson curve with rate = median count rate of data. |
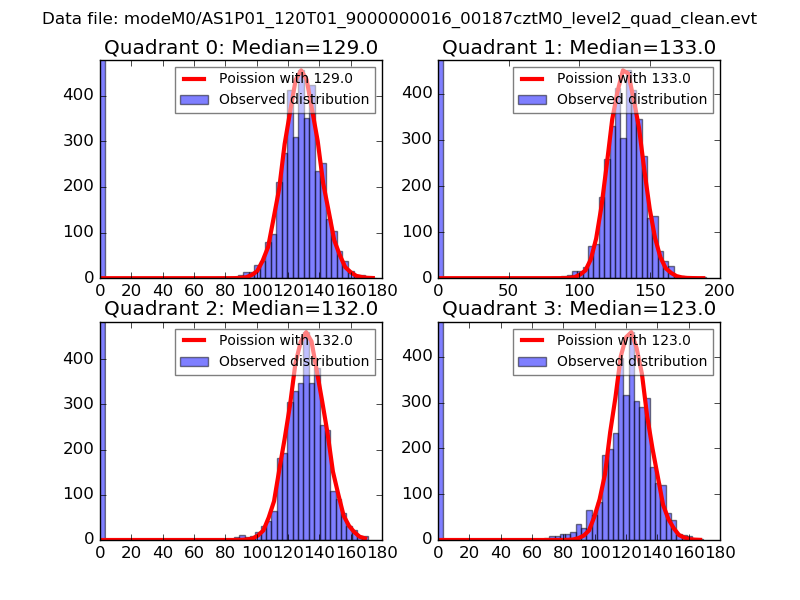 |
 |
| Quadrant-wise count rates Data is divided into 100 sec bins |
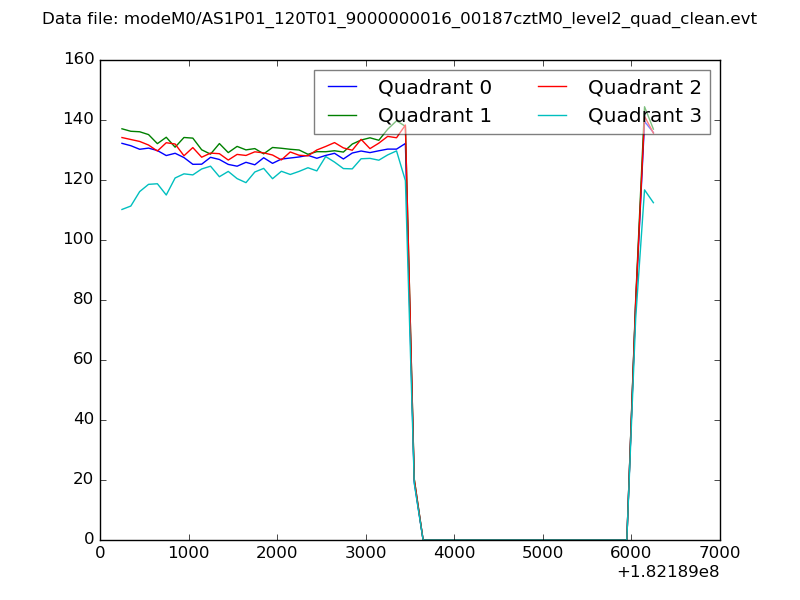 |
|
| Module-wise count rates for Quadrant A Data is divided into 100 sec bins |
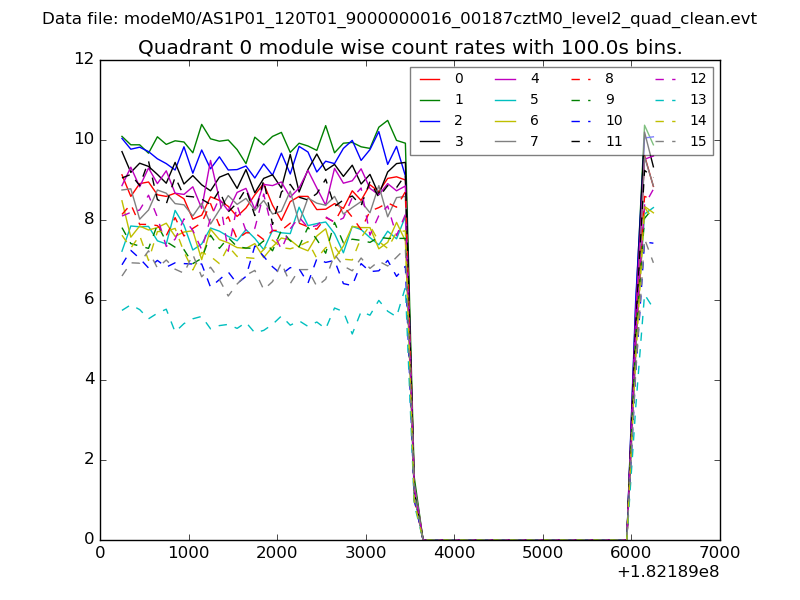 |
 |
| Module-wise count rates for Quadrant B Data is divided into 100 sec bins |
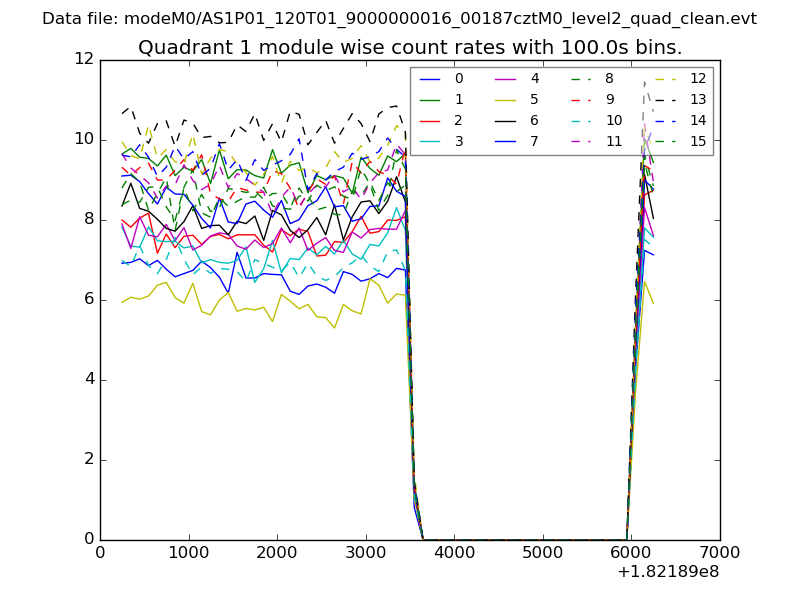 |
 |
| Module-wise count rates for Quadrant C Data is divided into 100 sec bins |
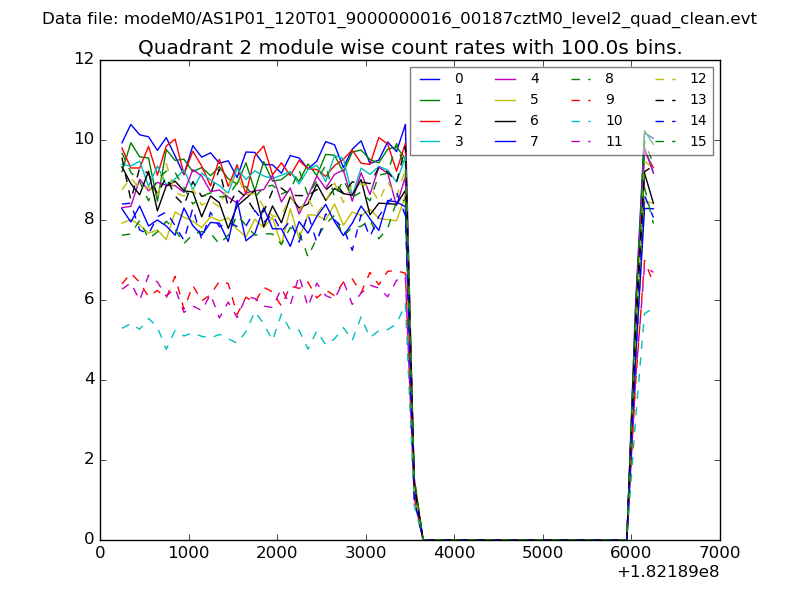 |
 |
| Module-wise count rates for Quadrant D Data is divided into 100 sec bins |
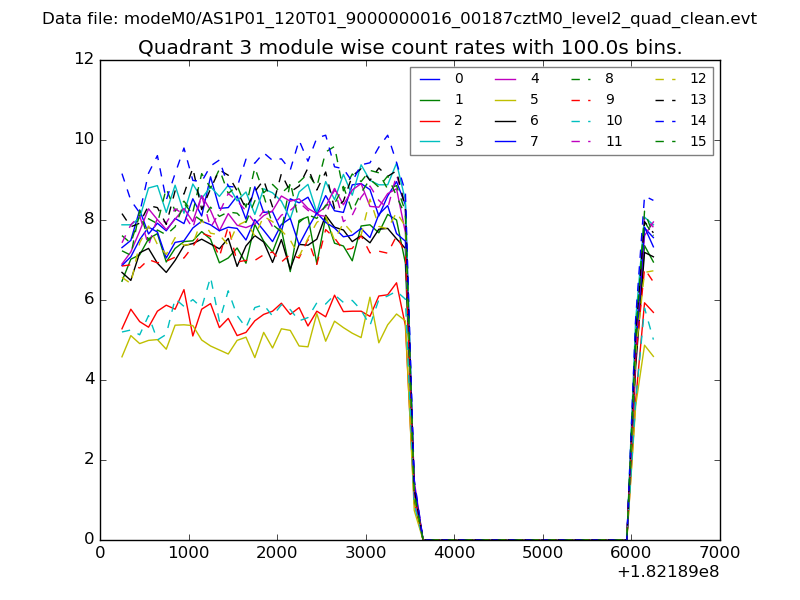 |
 |
| Parameter | Plot |
|---|---|
| CZT HV Monitor | 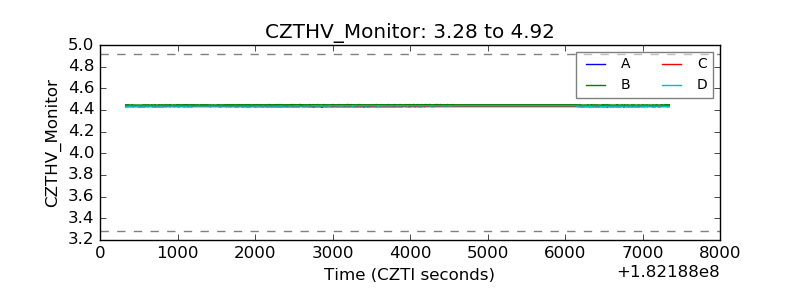 |
| D_VDD | 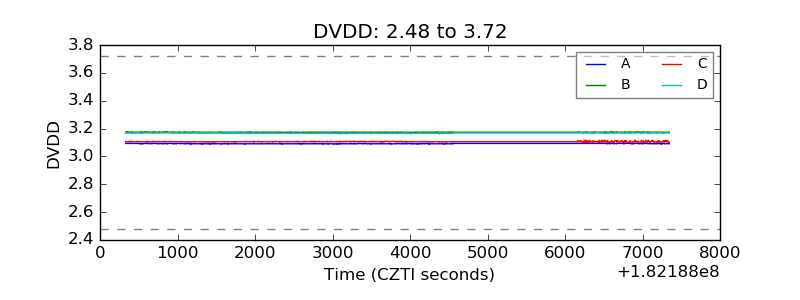 |
| Temperature 1 | 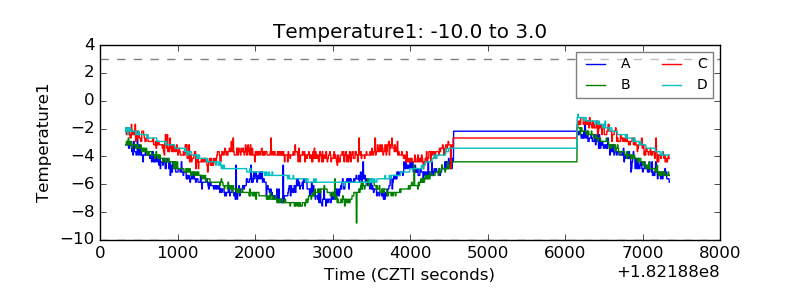 |
| Veto HV Monitor | 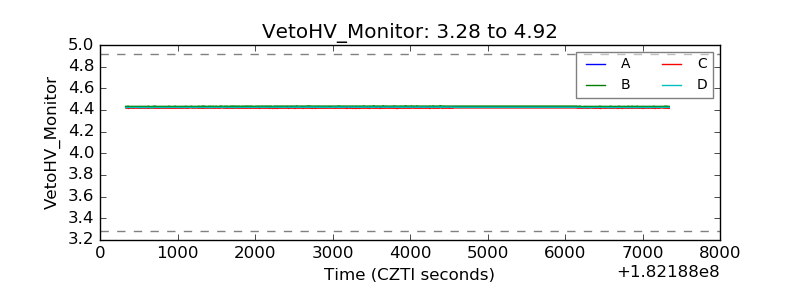 |
| Veto LLD | 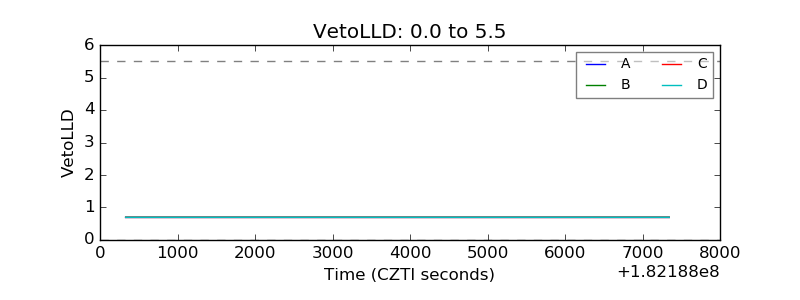 |
| Alpha Counter |  |
| _CPM_Rate | 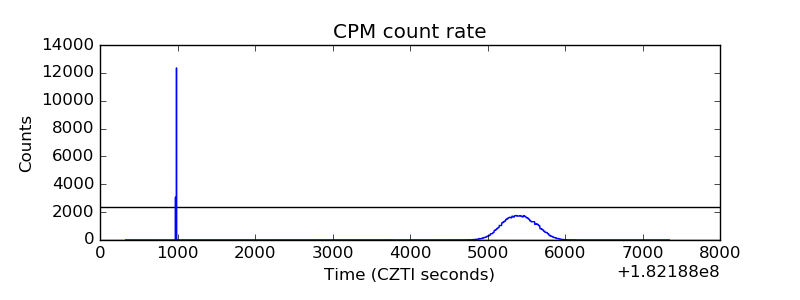 |
| CZT Counter | 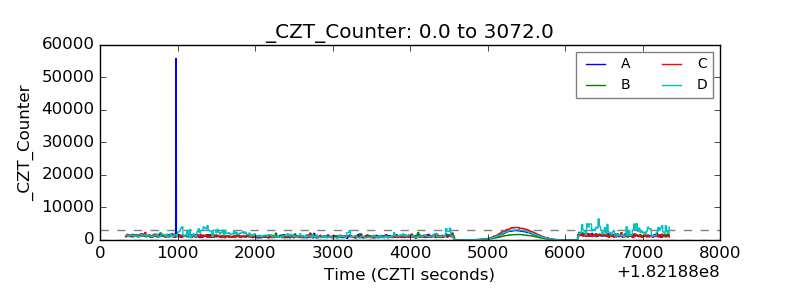 |
| +2.5 Volts monitor |  |
| +5 Volts monitor |  |
| _ROLL_ROT | 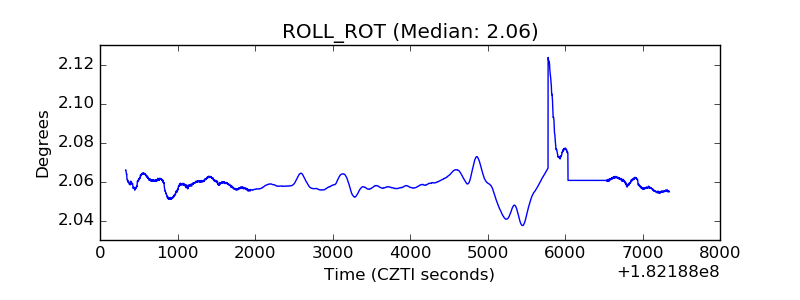 |
| _Roll_DEC | 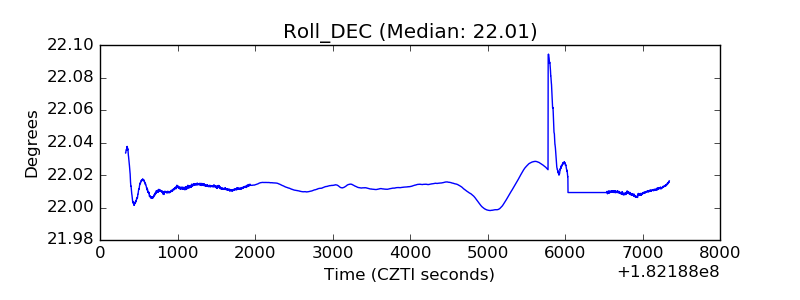 |
| _Roll_RA | 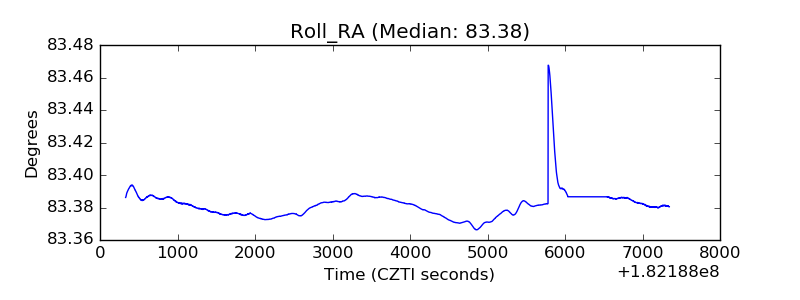 |
| Veto Counter | 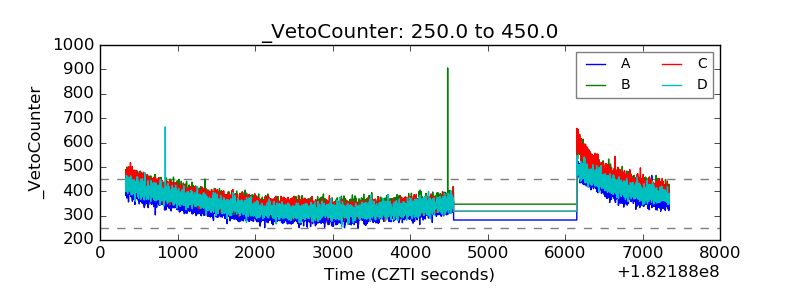 |