| Param | Original file | Final file |
|---|---|---|
| Filename | modeM0/AS1P01_120T01_9000000016_00188cztM0_level2.evt | modeM0/AS1P01_120T01_9000000016_00188cztM0_level2_quad_clean.evt |
| Size (bytes) | 953,942,400 | 86,106,240 |
| Size | 909.8 MB | 82.1 MB |
| Events in quadrant A | 6,777,888 | 554,613 |
| Events in quadrant B | 7,269,716 | 569,614 |
| Events in quadrant C | 6,240,579 | 569,411 |
| Events in quadrant D | 8,239,107 | 530,704 |
| Mode SS | |||
|---|---|---|---|
| Quadrant | BADHDUFLAG | Total packets | Discarded packets |
| A | 0 | 224 | 112 |
| B | 0 | 224 | 112 |
| C | 0 | 224 | 112 |
| D | 0 | 224 | 112 |
| Mode M0 | |||
|---|---|---|---|
| Quadrant | BADHDUFLAG | Total packets | Discarded packets |
| A | 0 | 47963 | 23983 |
| B | 0 | 51042 | 25522 |
| C | 0 | 44866 | 22434 |
| D | 0 | 56789 | 28400 |
| Mode M9 | |||
|---|---|---|---|
| Quadrant | BADHDUFLAG | Total packets | Discarded packets |
| A | 0 | 32 | 16 |
| B | 0 | 32 | 16 |
| C | 0 | 32 | 16 |
| D | 0 | 32 | 16 |
| Quadrant | Total seconds | Saturated seconds | Saturation percentage |
|---|---|---|---|
| A | 5476 | 4 | 0.073046% |
| B | 5476 | 228 | 4.163623% |
| C | 5476 | 7 | 0.127831% |
| D | 5475 | 290 | 5.296804% |
Noise dominated data is calculated using 1-second bins in cleaned event files. If a bin has >2000 counts, and if more than 50% of those come from <1% of pixels, then it is considered to be noise-dominated and hence unusable.
| Quadrant | # 1 sec bins | Bins with >0 counts | Bins with >2000 counts | High rate bins dominated by noise | Noise dominated (total time) | Noise dominated (detector-on time) | Marked lightcurve |
|---|---|---|---|---|---|---|---|
| A | 7067 | 5478 | 187 | 187 | 2.65% | 3.41% | 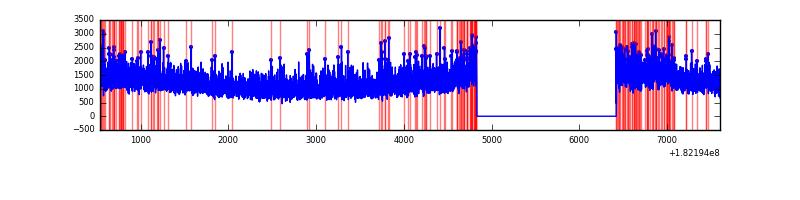 |
| B | 7067 | 5478 | 488 | 488 | 6.91% | 8.91% | 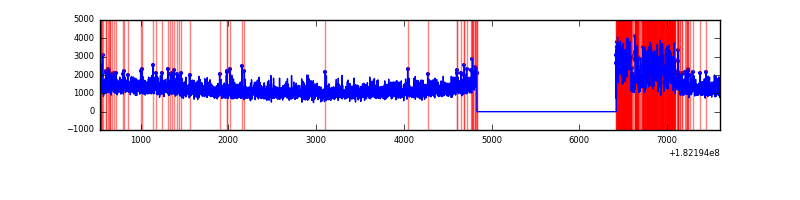 |
| C | 7067 | 5478 | 66 | 66 | 0.93% | 1.20% | 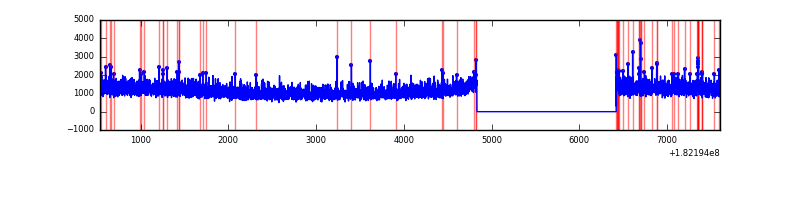 |
| D | 7067 | 5478 | 920 | 920 | 13.02% | 16.79% | 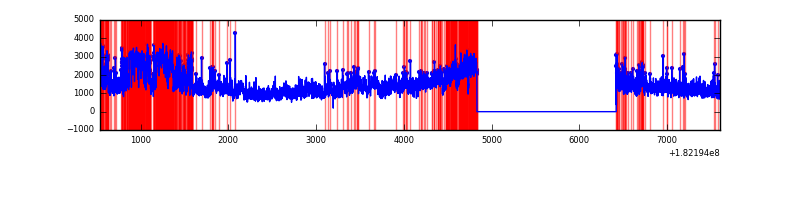 |
Top three noisy pixels from each quadrant. If the there are fewer than three noisy pixels in the level2.evt file, extra rows are filled as -1
| Pixel properties | Quadrant properties | ||||||
|---|---|---|---|---|---|---|---|
| Quadrant | DetID | PixID | Counts | Sigma | Mean | Median | Sigma |
| A | 13 | 145 | 106713 | 280.44 | 1697 | 1684 | 374.5 |
| A | 13 | 164 | 39675 | 101.44 | 1697 | 1684 | 374.5 |
| A | 13 | 17 | 23898 | 59.31 | 1697 | 1684 | 374.5 |
| B | 0 | 247 | 730212 | 1873.09 | 1675 | 1692 | 388.9 |
| B | 8 | 5 | 29214 | 70.76 | 1675 | 1692 | 388.9 |
| B | 14 | 50 | 18962 | 44.4 | 1675 | 1692 | 388.9 |
| C | 0 | 202 | 13028 | 26.09 | 1574 | 1637 | 436.7 |
| C | 7 | 158 | 10587 | 20.5 | 1574 | 1637 | 436.7 |
| C | 7 | 143 | 10257 | 19.74 | 1574 | 1637 | 436.7 |
| D | 12 | 249 | 2092645 | 4535.67 | 1524 | 1576 | 461.0 |
| D | 13 | 6 | 73185 | 155.32 | 1524 | 1576 | 461.0 |
| D | 2 | 106 | 32401 | 66.86 | 1524 | 1576 | 461.0 |
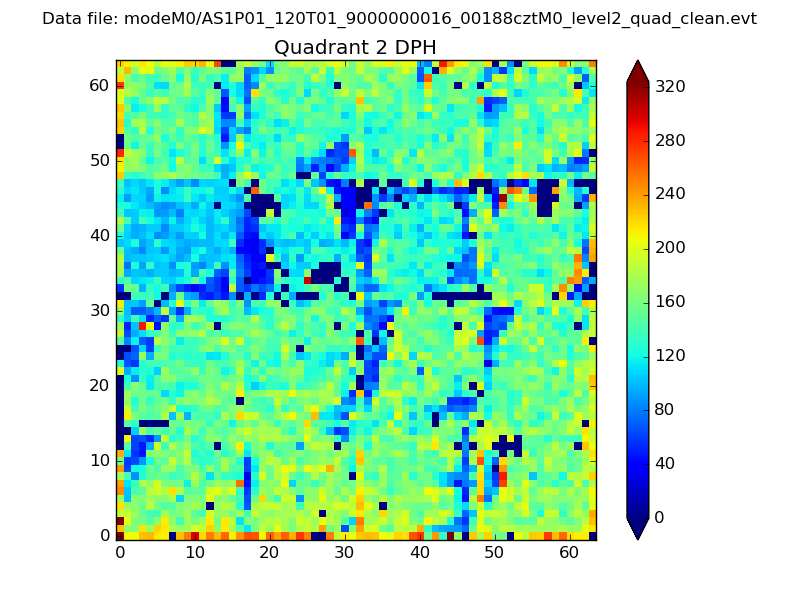
Histogram calculated using DETX and DETY for each event in the final _common_clean file
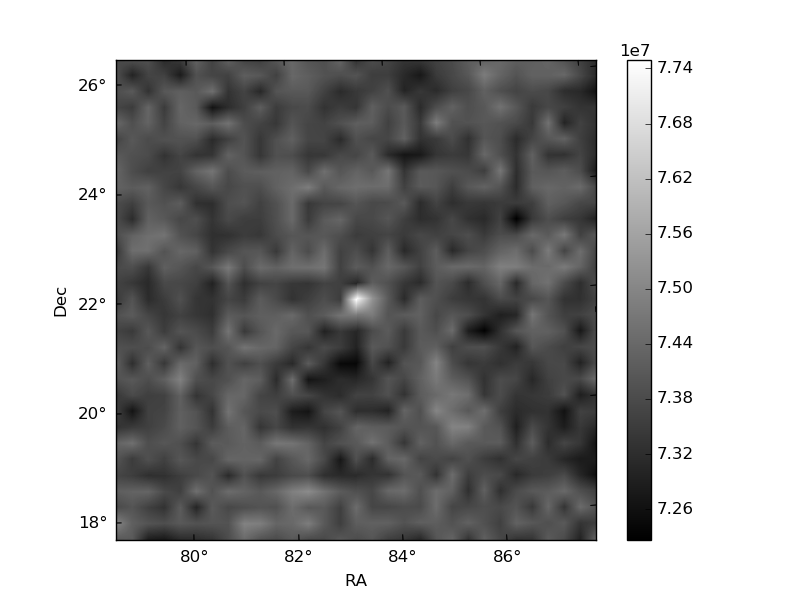
| Quadrant A | 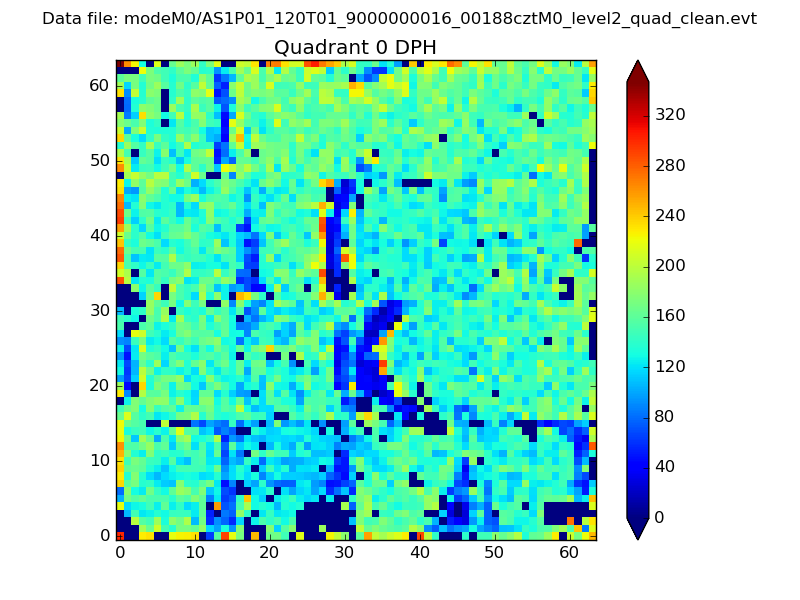 |
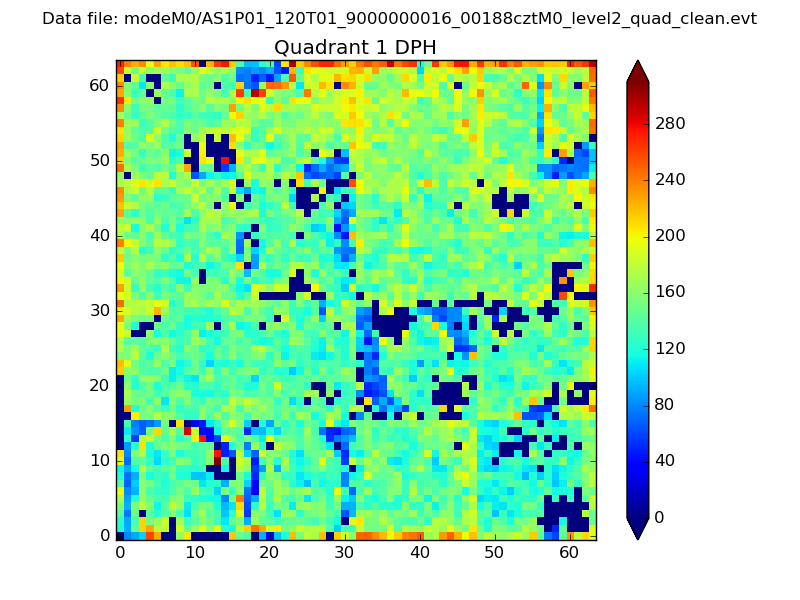 |
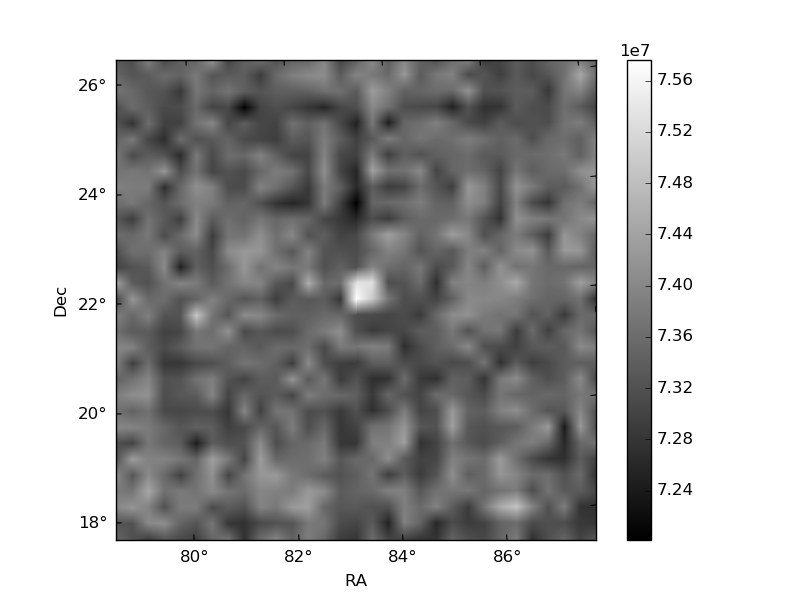
Quadrant B |
|---|---|---|---|
| Quadrant D | 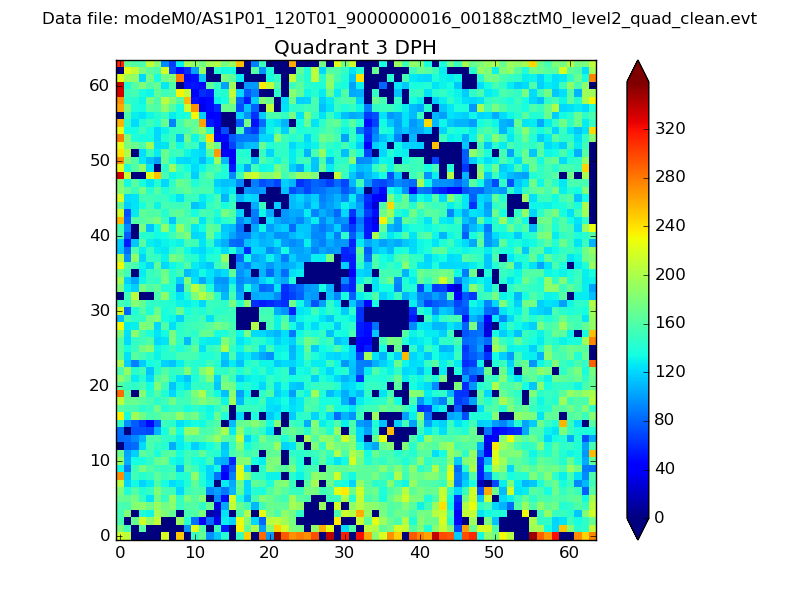 |
 |
Quadrant C |
| Plot type | Count rate plots | Images |
|---|---|---|
| Comparison with Poisson distribution Blue bars denote a histogram of data divided into 1 sec bins. Red curve is a Poisson curve with rate = median count rate of data. |
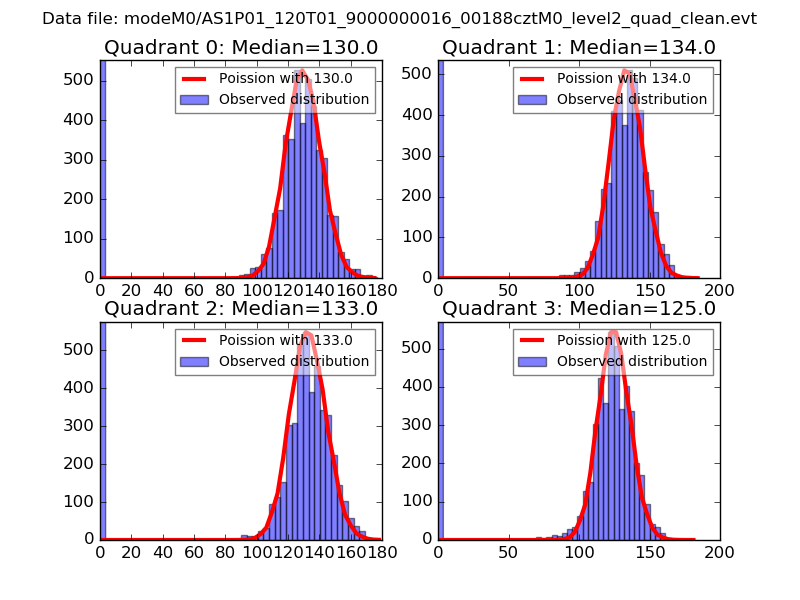 |
 |
| Quadrant-wise count rates Data is divided into 100 sec bins |
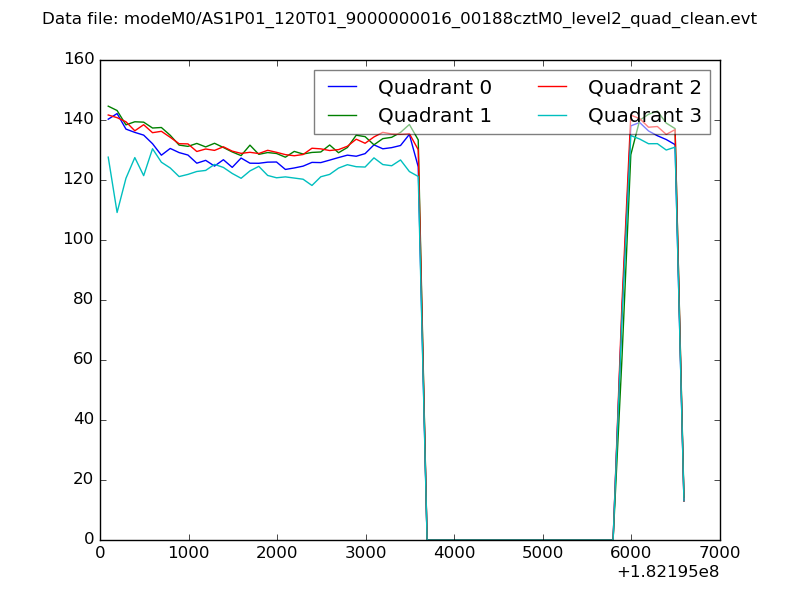 |
|
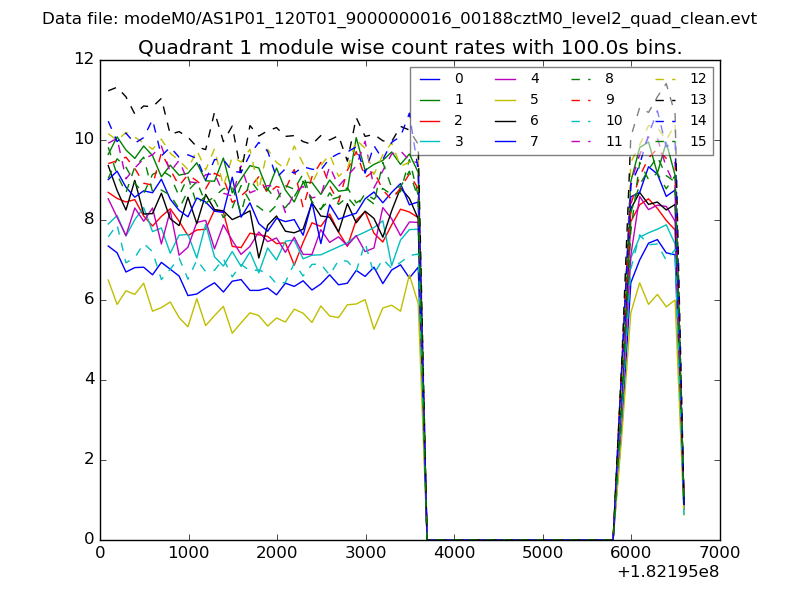
| Module-wise count rates for Quadrant A Data is divided into 100 sec bins |
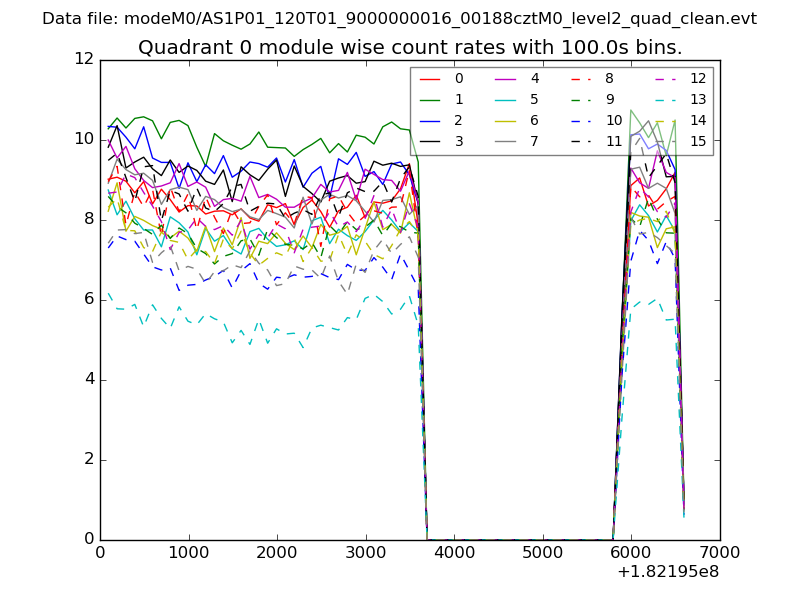 |
 |
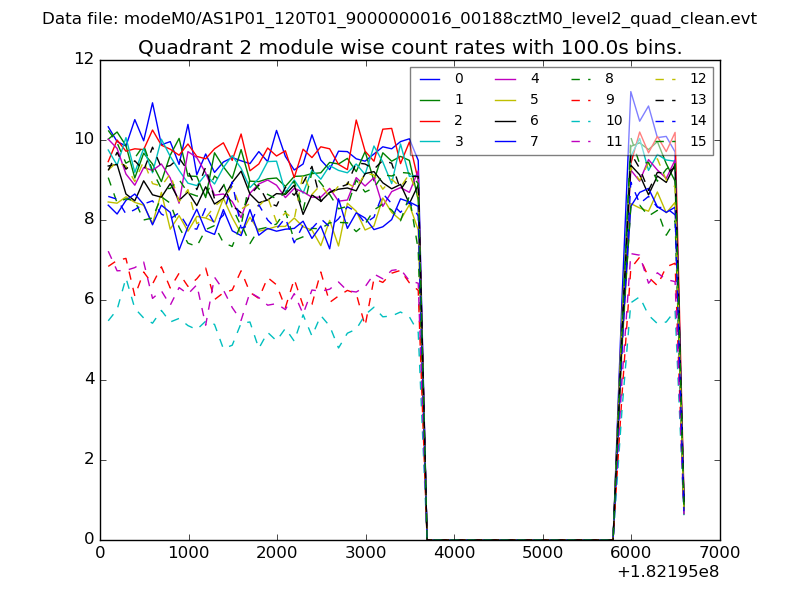
| Module-wise count rates for Quadrant B Data is divided into 100 sec bins |
 |
 |
| Module-wise count rates for Quadrant C Data is divided into 100 sec bins |
 |
 |
| Module-wise count rates for Quadrant D Data is divided into 100 sec bins |
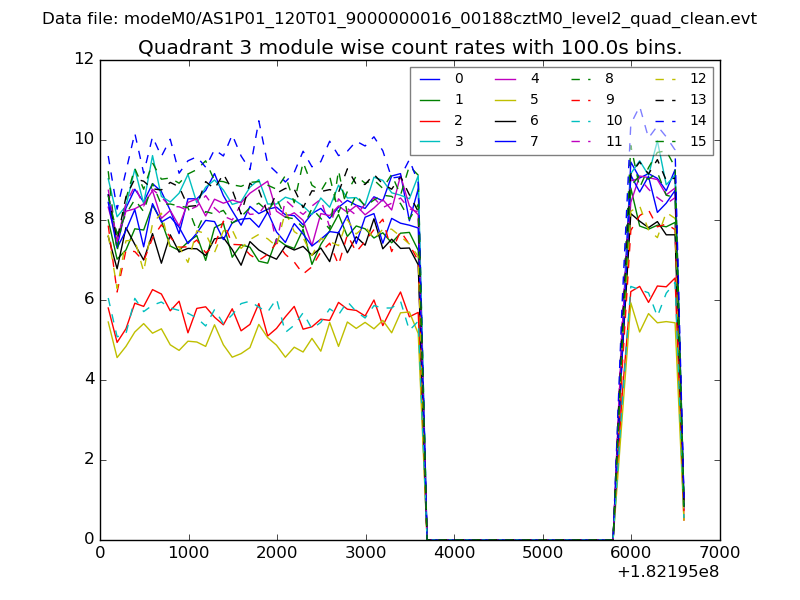 |
 |
| Parameter | Plot |
|---|---|
| CZT HV Monitor | 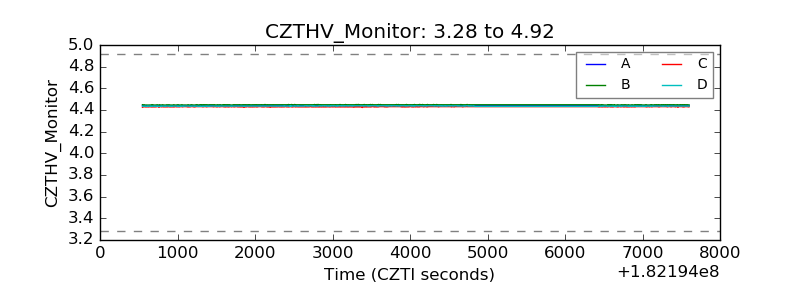 |
| D_VDD |  |
| Temperature 1 | 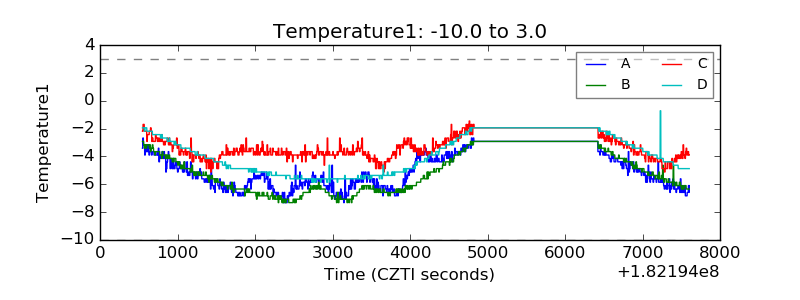 |
| Veto HV Monitor | 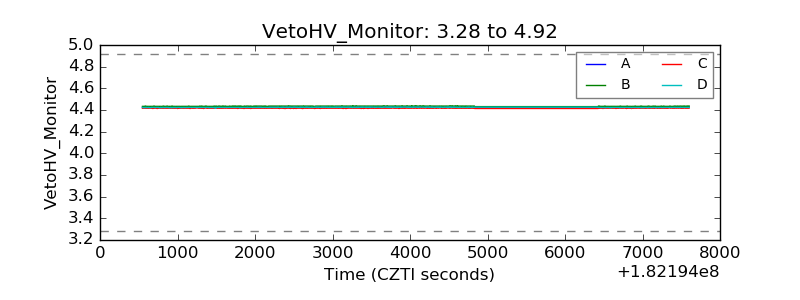 |
| Veto LLD | 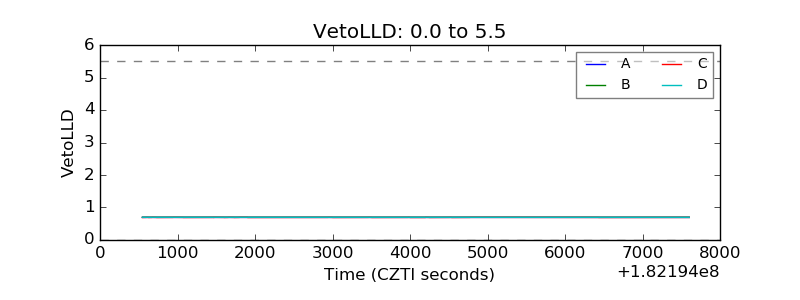 |
| Alpha Counter | 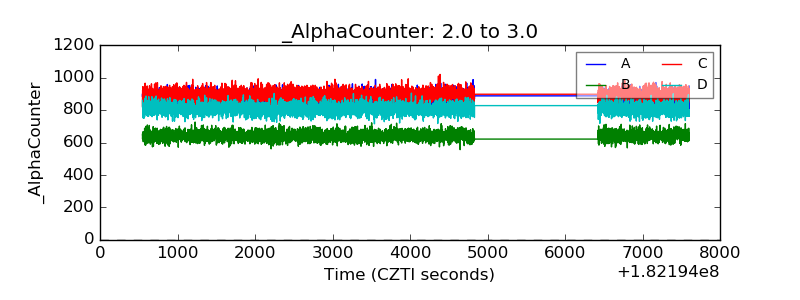 |
| _CPM_Rate | 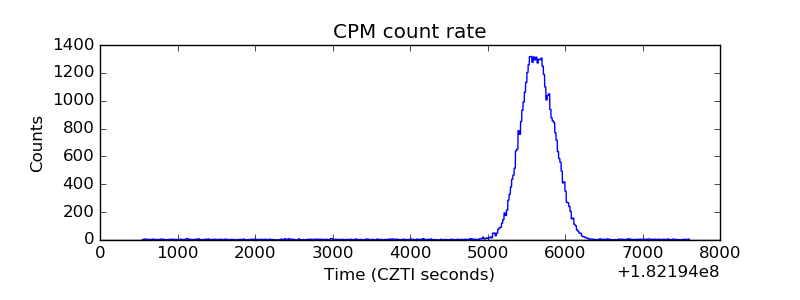 |
| CZT Counter | 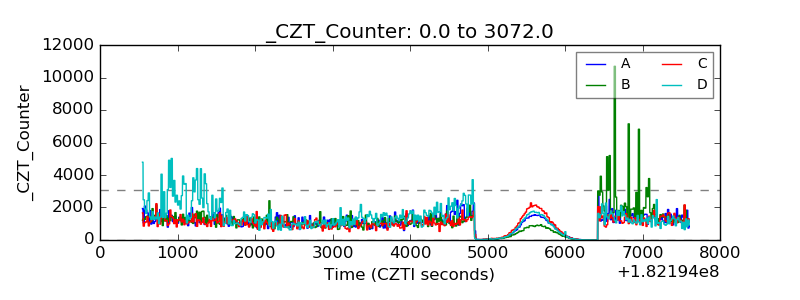 |
| +2.5 Volts monitor |  |
| +5 Volts monitor |  |
| _ROLL_ROT | 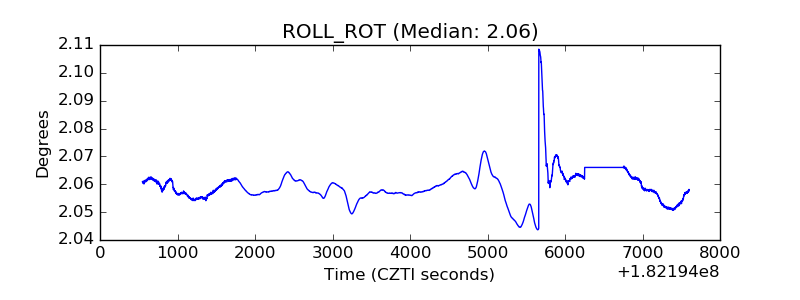 |
| _Roll_DEC | 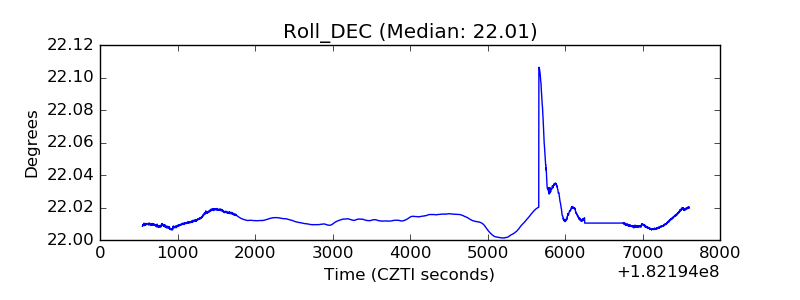 |
| _Roll_RA |  |
| Veto Counter | 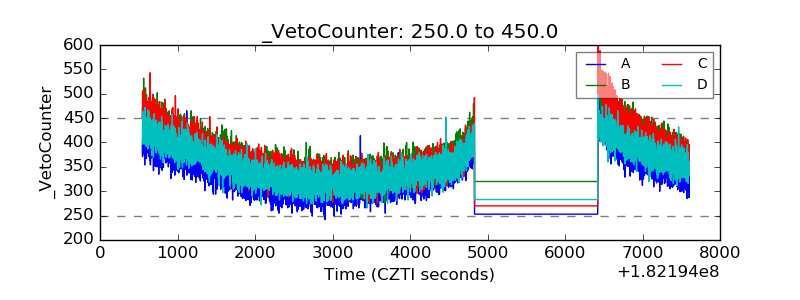 |