| Param | Original file | Final file |
|---|---|---|
| Filename | modeM0/AS1P01_120T01_9000000016_00191cztM0_level2.evt | modeM0/AS1P01_120T01_9000000016_00191cztM0_level2_quad_clean.evt |
| Size (bytes) | 818,285,760 | 76,291,200 |
| Size | 780.4 MB | 72.8 MB |
| Events in quadrant A | 6,273,459 | 479,728 |
| Events in quadrant B | 6,418,761 | 491,875 |
| Events in quadrant C | 5,813,560 | 488,346 |
| Events in quadrant D | 5,911,897 | 467,692 |
| Mode SS | |||
|---|---|---|---|
| Quadrant | BADHDUFLAG | Total packets | Discarded packets |
| A | 0 | 220 | 110 |
| B | 0 | 220 | 110 |
| C | 0 | 220 | 110 |
| D | 0 | 220 | 110 |
| Mode M0 | |||
|---|---|---|---|
| Quadrant | BADHDUFLAG | Total packets | Discarded packets |
| A | 0 | 45045 | 22524 |
| B | 0 | 45940 | 22971 |
| C | 0 | 42314 | 21162 |
| D | 0 | 42911 | 21457 |
| Mode M9 | |||
|---|---|---|---|
| Quadrant | BADHDUFLAG | Total packets | Discarded packets |
| A | 0 | 34 | 17 |
| B | 0 | 34 | 17 |
| C | 0 | 34 | 17 |
| D | 0 | 34 | 17 |
| Quadrant | Total seconds | Saturated seconds | Saturation percentage |
|---|---|---|---|
| A | 5471 | 3 | 0.054835% |
| B | 5471 | 28 | 0.511789% |
| C | 5470 | 1 | 0.018282% |
| D | 5471 | 16 | 0.292451% |
Noise dominated data is calculated using 1-second bins in cleaned event files. If a bin has >2000 counts, and if more than 50% of those come from <1% of pixels, then it is considered to be noise-dominated and hence unusable.
| Quadrant | # 1 sec bins | Bins with >0 counts | Bins with >2000 counts | High rate bins dominated by noise | Noise dominated (total time) | Noise dominated (detector-on time) | Marked lightcurve |
|---|---|---|---|---|---|---|---|
| A | 7093 | 5473 | 99 | 99 | 1.40% | 1.81% | 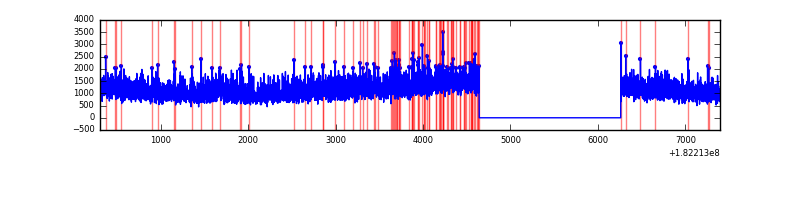 |
| B | 7093 | 5473 | 112 | 112 | 1.58% | 2.05% | 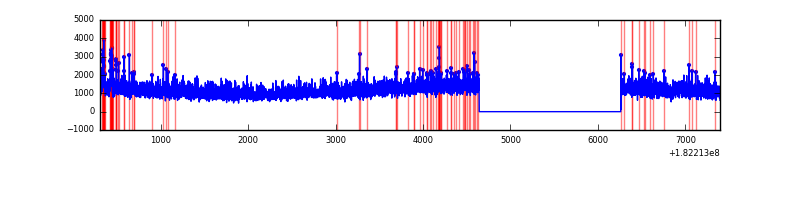 |
| C | 7093 | 5473 | 56 | 56 | 0.79% | 1.02% | 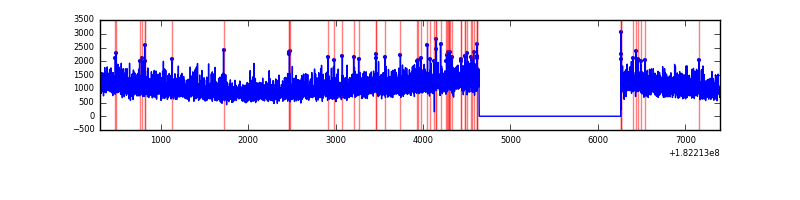 |
| D | 7093 | 5473 | 76 | 76 | 1.07% | 1.39% |  |
Top three noisy pixels from each quadrant. If the there are fewer than three noisy pixels in the level2.evt file, extra rows are filled as -1
| Pixel properties | Quadrant properties | ||||||
|---|---|---|---|---|---|---|---|
| Quadrant | DetID | PixID | Counts | Sigma | Mean | Median | Sigma |
| A | 5 | 244 | 47842 | 133.59 | 1593 | 1583 | 346.3 |
| A | 13 | 17 | 25610 | 69.38 | 1593 | 1583 | 346.3 |
| A | 0 | 253 | 14270 | 36.64 | 1593 | 1583 | 346.3 |
| B | 0 | 247 | 130590 | 345.83 | 1609 | 1616 | 372.9 |
| B | 0 | 190 | 27825 | 70.28 | 1609 | 1616 | 372.9 |
| B | 8 | 34 | 24715 | 61.94 | 1609 | 1616 | 372.9 |
| C | 1 | 192 | 11697 | 24.75 | 1469 | 1525 | 411.0 |
| C | 9 | 128 | 9909 | 20.4 | 1469 | 1525 | 411.0 |
| C | 10 | 33 | 8451 | 16.85 | 1469 | 1525 | 411.0 |
| D | 6 | 212 | 72445 | 163.99 | 1430 | 1481 | 432.7 |
| D | 1 | 4 | 49475 | 110.91 | 1430 | 1481 | 432.7 |
| D | 10 | 182 | 48195 | 107.95 | 1430 | 1481 | 432.7 |
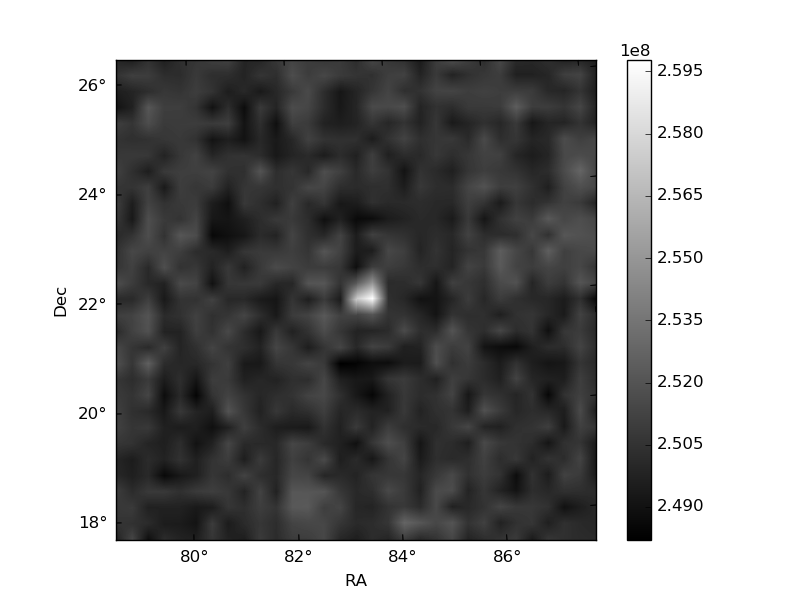
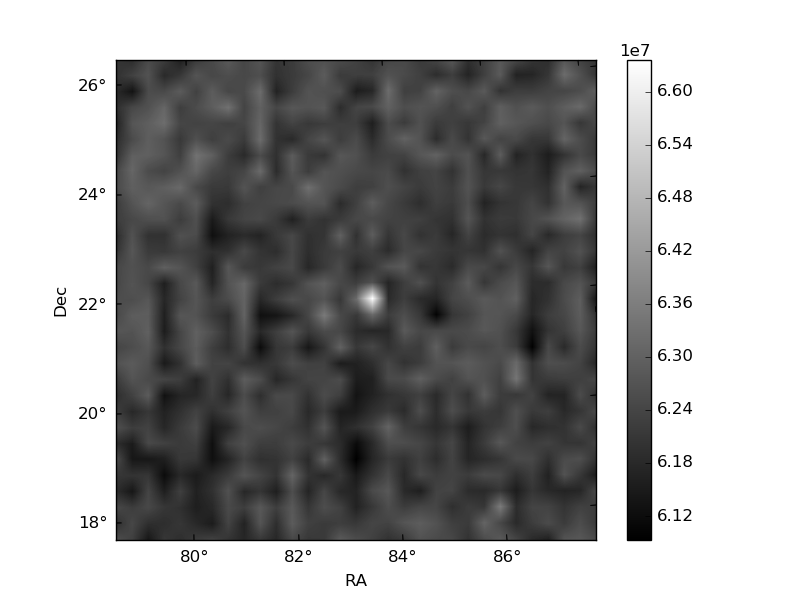
Histogram calculated using DETX and DETY for each event in the final _common_clean file
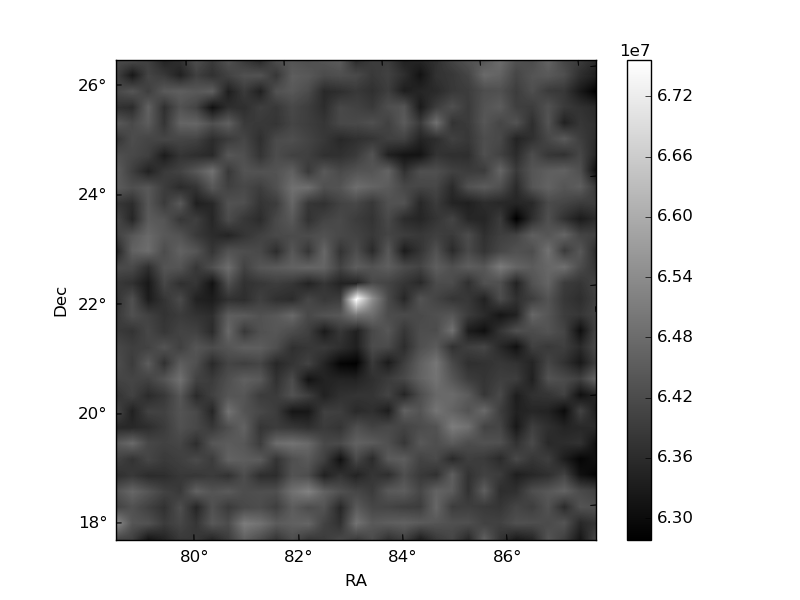
| Quadrant A | 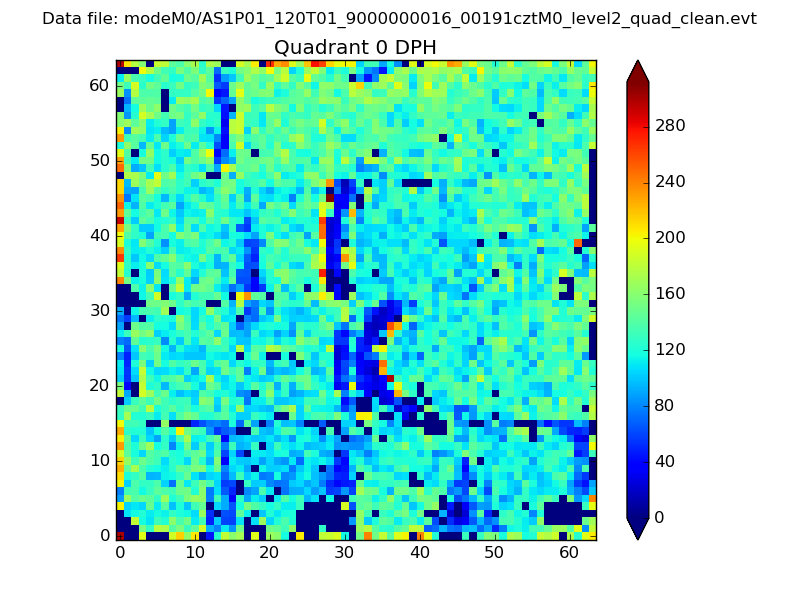 |
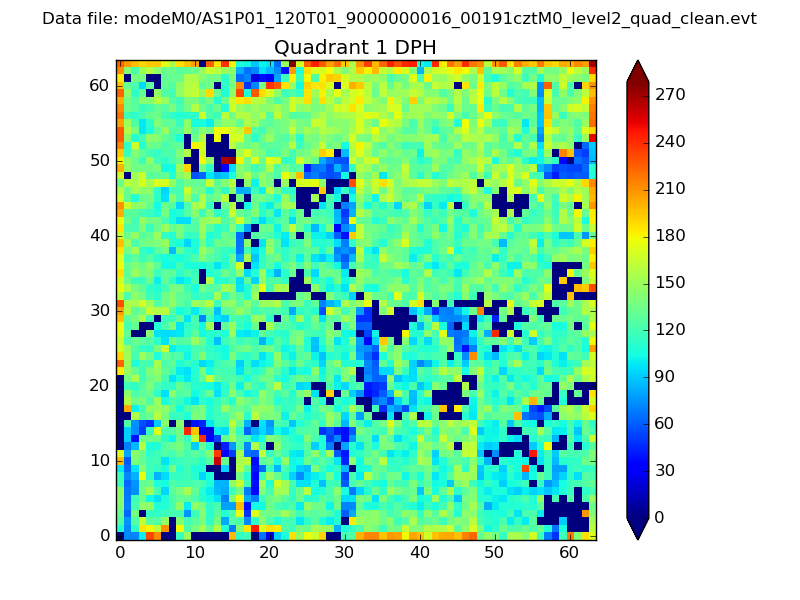 |
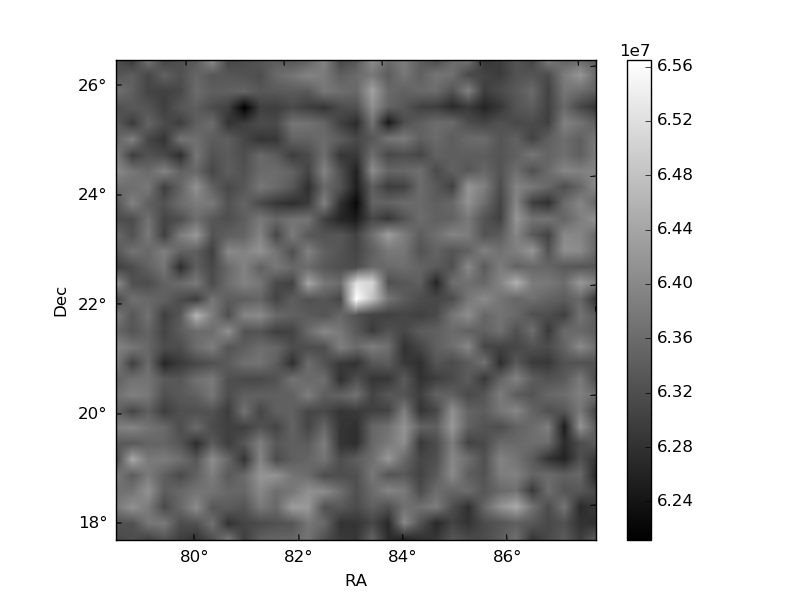
Quadrant B |
|---|---|---|---|
| Quadrant D | 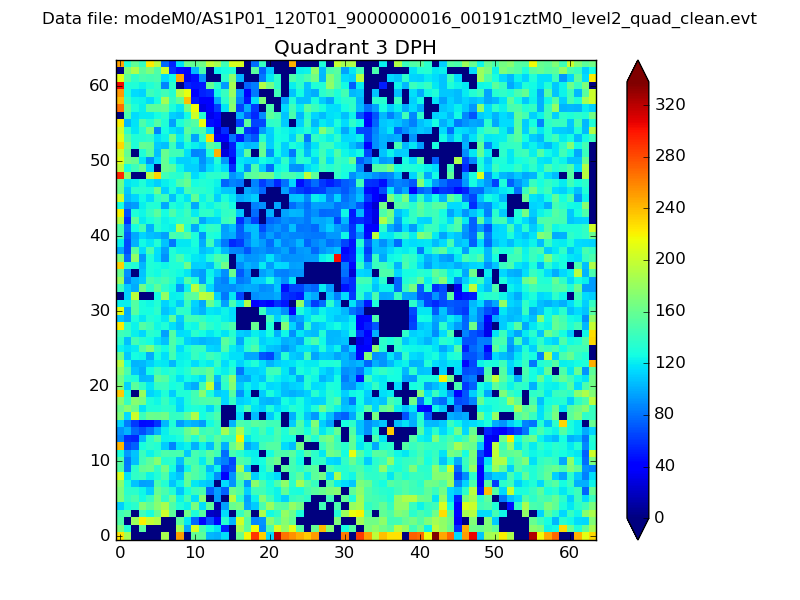 |
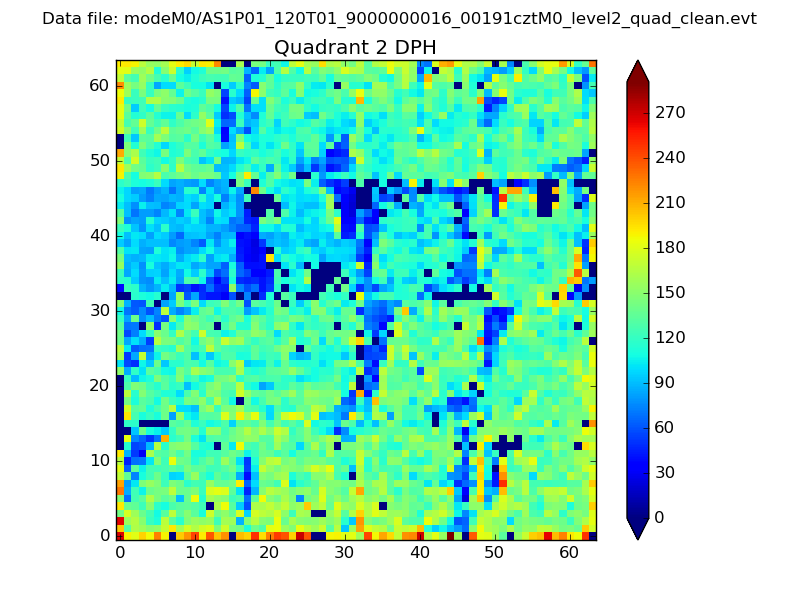 |
Quadrant C |
| Plot type | Count rate plots | Images |
|---|---|---|
| Comparison with Poisson distribution Blue bars denote a histogram of data divided into 1 sec bins. Red curve is a Poisson curve with rate = median count rate of data. |
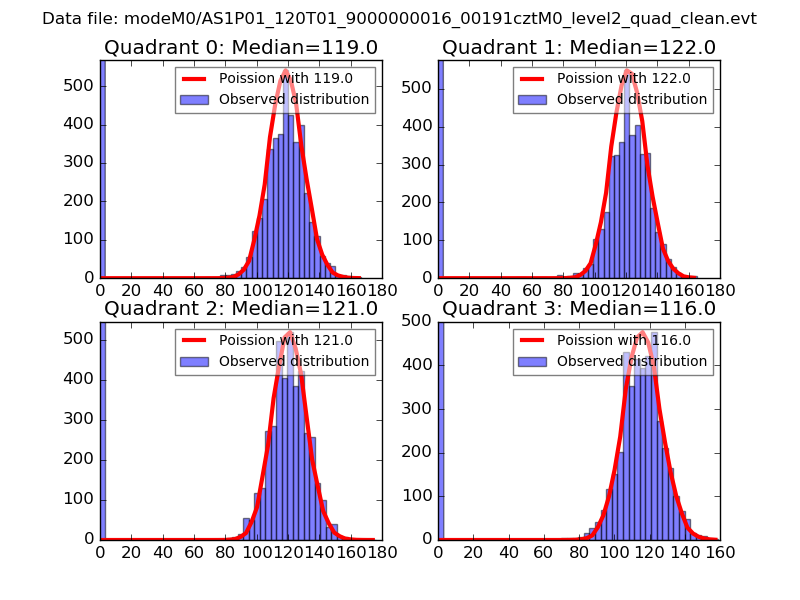 |
 |
| Quadrant-wise count rates Data is divided into 100 sec bins |
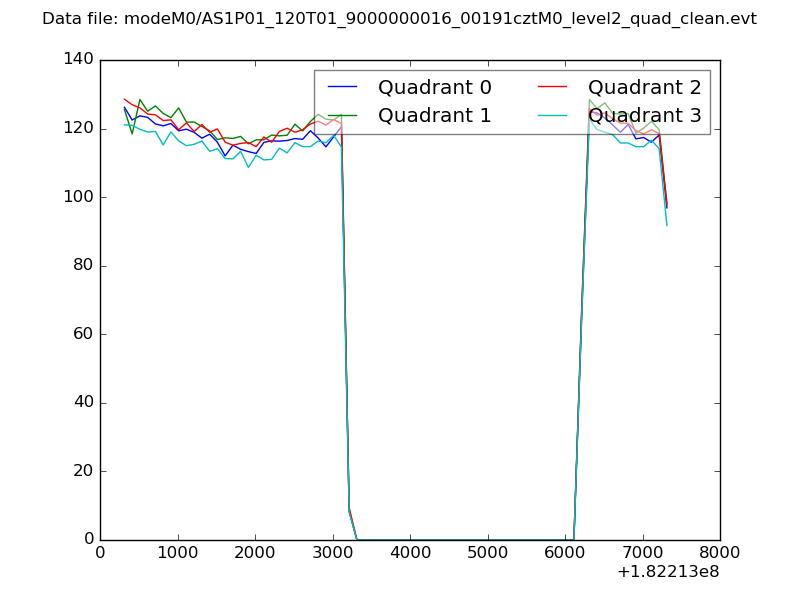 |
|
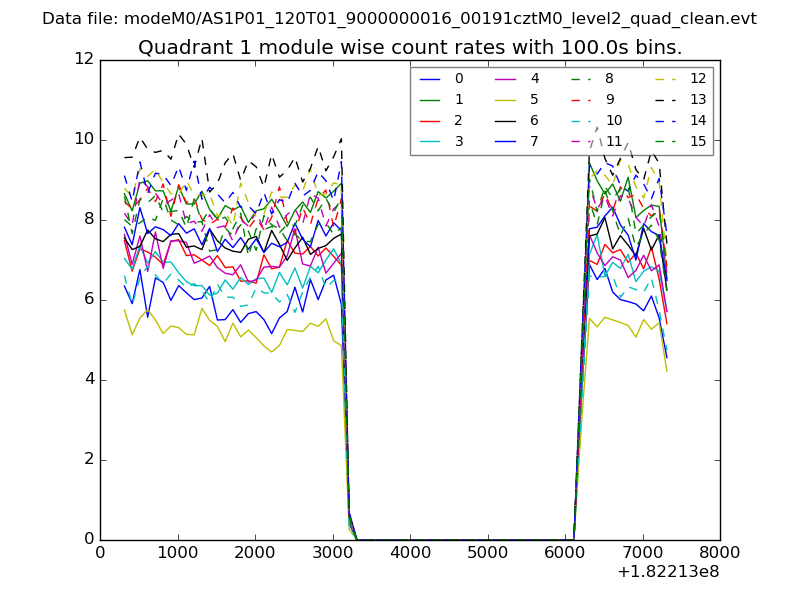
| Module-wise count rates for Quadrant A Data is divided into 100 sec bins |
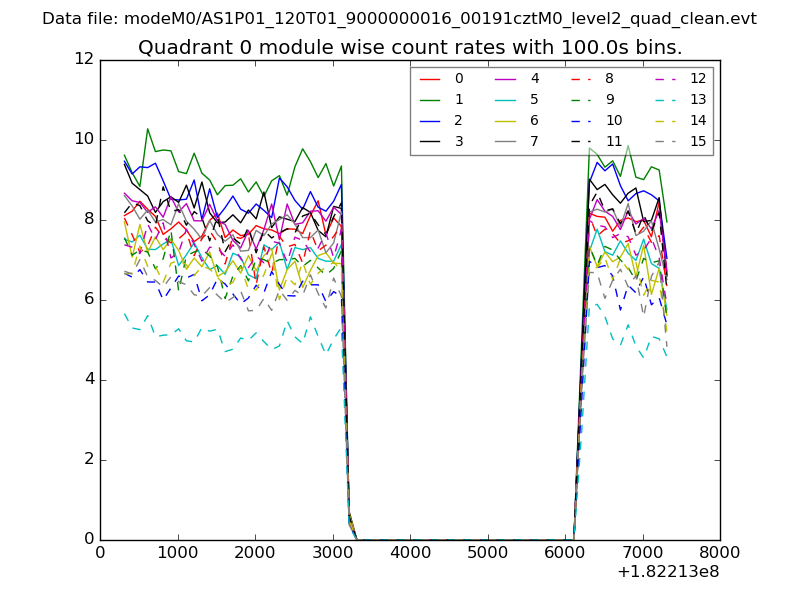 |
 |
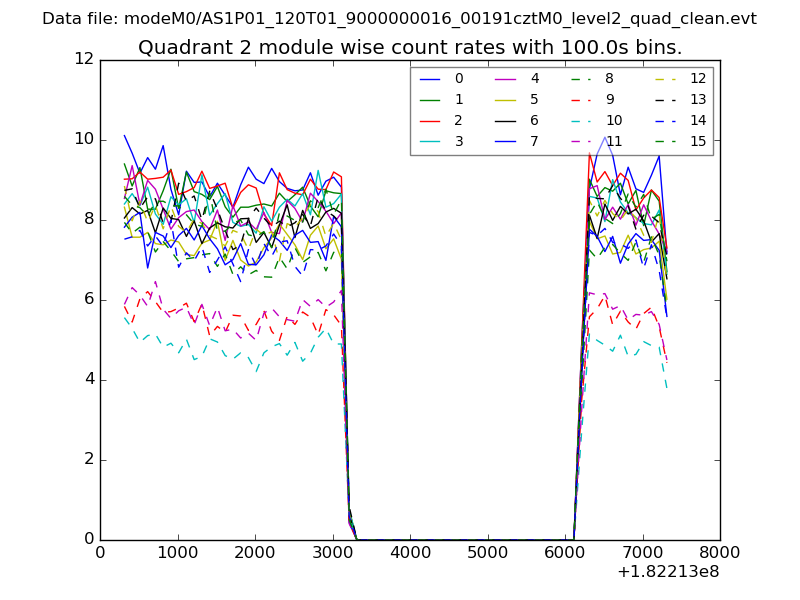
| Module-wise count rates for Quadrant B Data is divided into 100 sec bins |
 |
 |
| Module-wise count rates for Quadrant C Data is divided into 100 sec bins |
 |
 |
| Module-wise count rates for Quadrant D Data is divided into 100 sec bins |
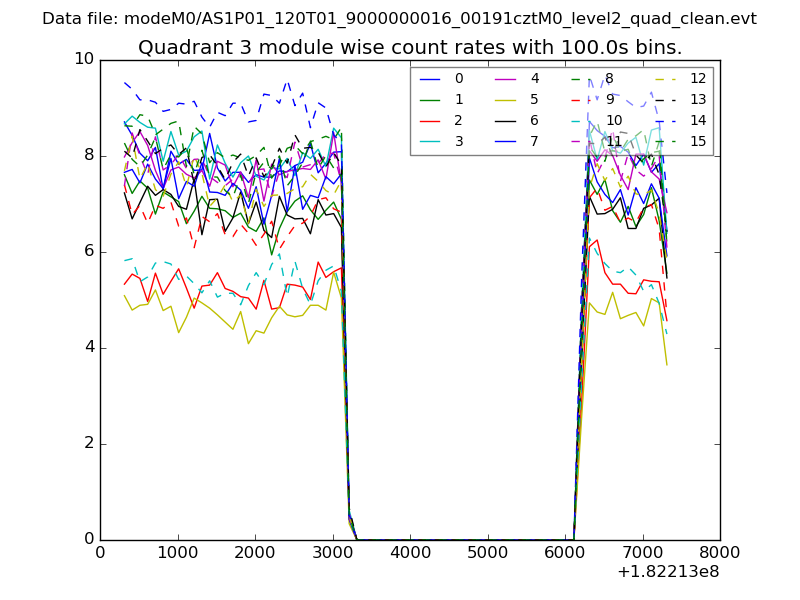 |
 |
| Parameter | Plot |
|---|---|
| CZT HV Monitor | 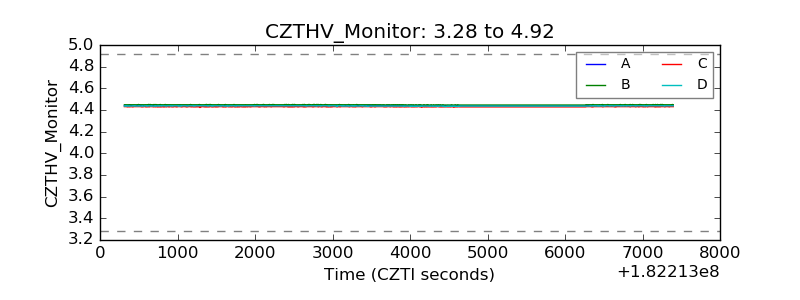 |
| D_VDD | 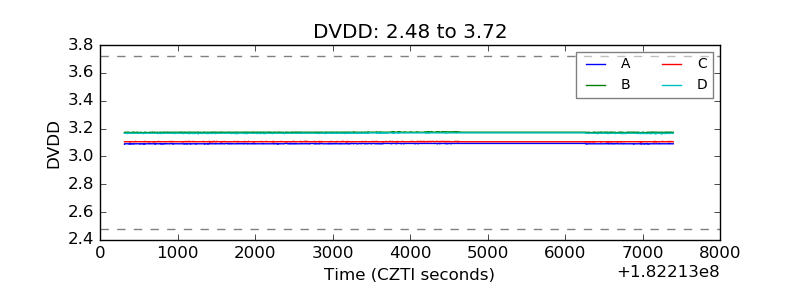 |
| Temperature 1 | 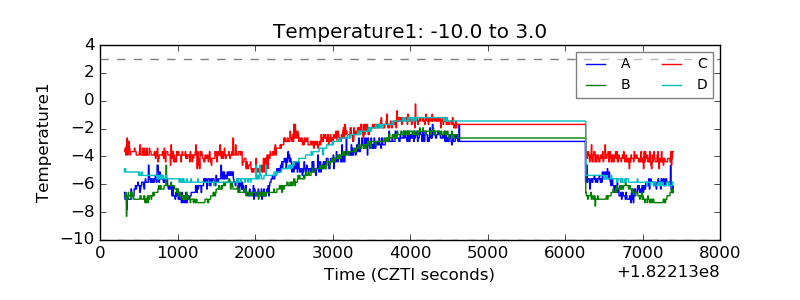 |
| Veto HV Monitor | 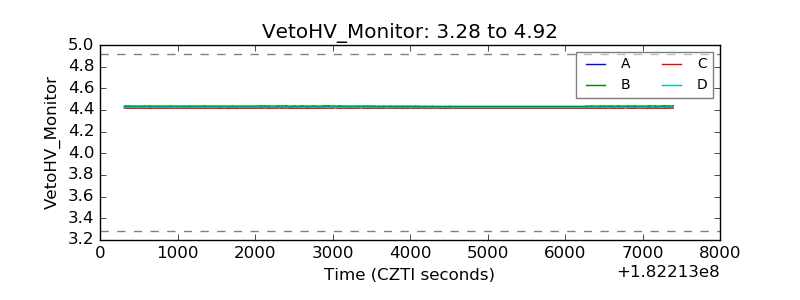 |
| Veto LLD |  |
| Alpha Counter | 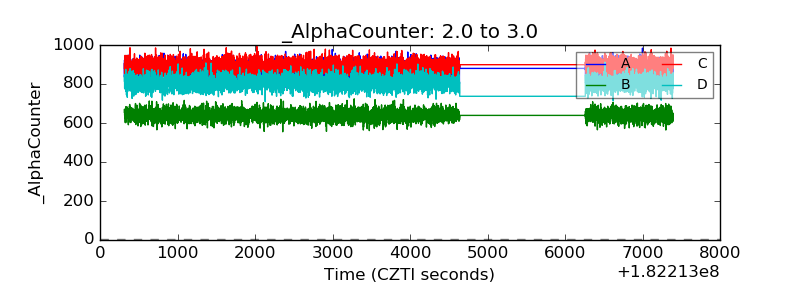 |
| _CPM_Rate | 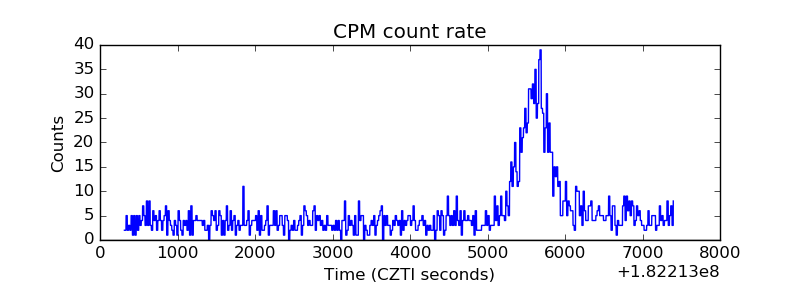 |
| CZT Counter | 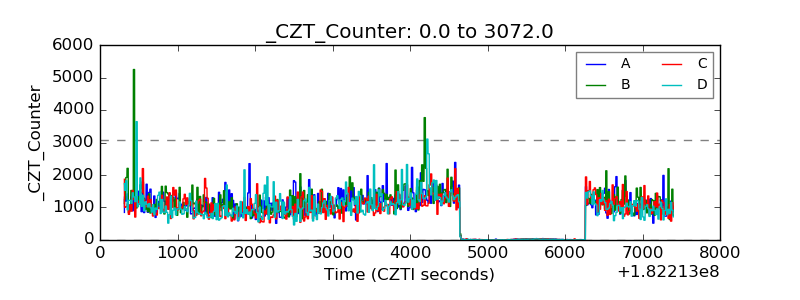 |
| +2.5 Volts monitor |  |
| +5 Volts monitor | 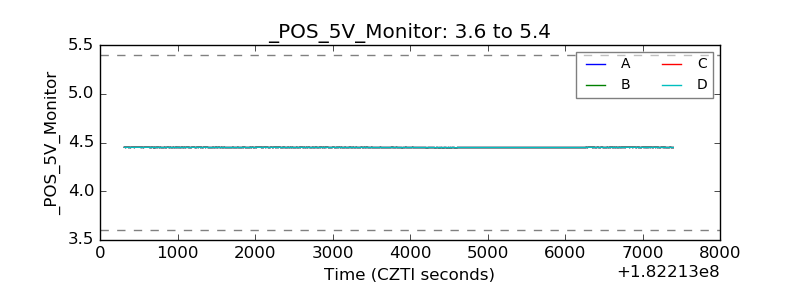 |
| _ROLL_ROT | 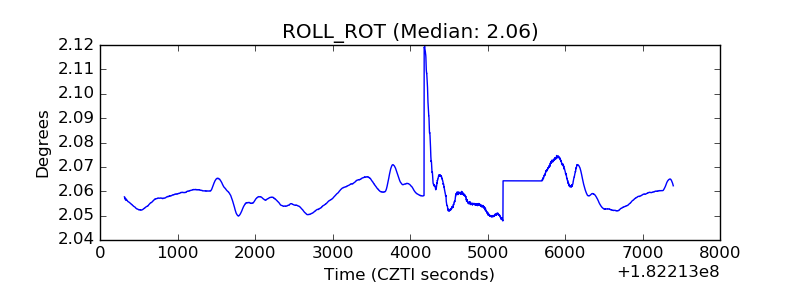 |
| _Roll_DEC | 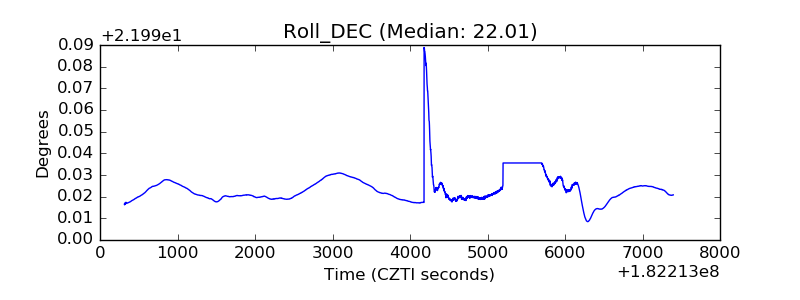 |
| _Roll_RA | 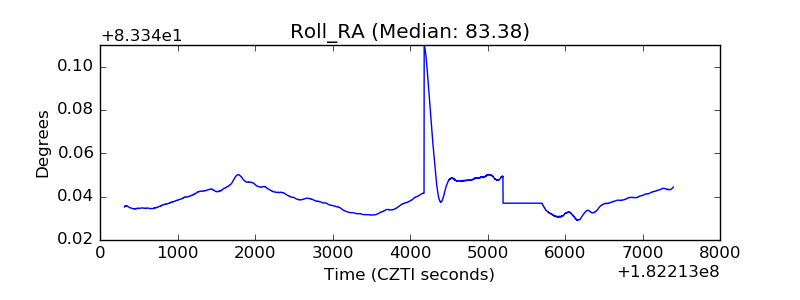 |
| Veto Counter | 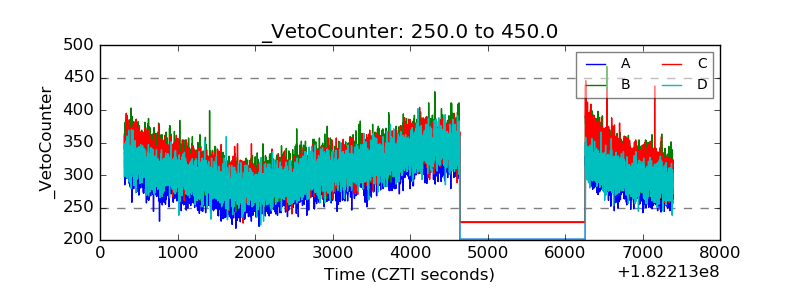 |