| Param | Original file | Final file |
|---|---|---|
| Filename | modeM0/AS1P01_120T01_9000000016_00192cztM0_level2.evt | modeM0/AS1P01_120T01_9000000016_00192cztM0_level2_quad_clean.evt |
| Size (bytes) | 887,057,280 | 75,502,080 |
| Size | 846.0 MB | 72.0 MB |
| Events in quadrant A | 6,679,163 | 466,575 |
| Events in quadrant B | 6,908,847 | 478,989 |
| Events in quadrant C | 6,217,484 | 475,550 |
| Events in quadrant D | 6,670,864 | 457,218 |
| Mode SS | |||
|---|---|---|---|
| Quadrant | BADHDUFLAG | Total packets | Discarded packets |
| A | 0 | 236 | 118 |
| B | 0 | 236 | 118 |
| C | 0 | 236 | 118 |
| D | 0 | 236 | 118 |
| Mode M0 | |||
|---|---|---|---|
| Quadrant | BADHDUFLAG | Total packets | Discarded packets |
| A | 0 | 48005 | 24009 |
| B | 0 | 49364 | 24688 |
| C | 0 | 45280 | 22647 |
| D | 0 | 47986 | 24003 |
| Mode M9 | |||
|---|---|---|---|
| Quadrant | BADHDUFLAG | Total packets | Discarded packets |
| A | 0 | 42 | 21 |
| B | 0 | 42 | 21 |
| C | 0 | 42 | 21 |
| D | 0 | 44 | 22 |
| Quadrant | Total seconds | Saturated seconds | Saturation percentage |
|---|---|---|---|
| A | 5839 | 2 | 0.034252% |
| B | 5839 | 44 | 0.753554% |
| C | 5839 | 13 | 0.222641% |
| D | 5838 | 13 | 0.222679% |
Noise dominated data is calculated using 1-second bins in cleaned event files. If a bin has >2000 counts, and if more than 50% of those come from <1% of pixels, then it is considered to be noise-dominated and hence unusable.
| Quadrant | # 1 sec bins | Bins with >0 counts | Bins with >2000 counts | High rate bins dominated by noise | Noise dominated (total time) | Noise dominated (detector-on time) | Marked lightcurve |
|---|---|---|---|---|---|---|---|
| A | 7460 | 5842 | 112 | 112 | 1.50% | 1.92% | 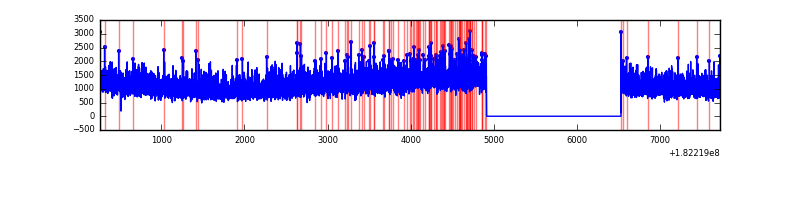 |
| B | 7460 | 5842 | 175 | 175 | 2.35% | 3.00% | 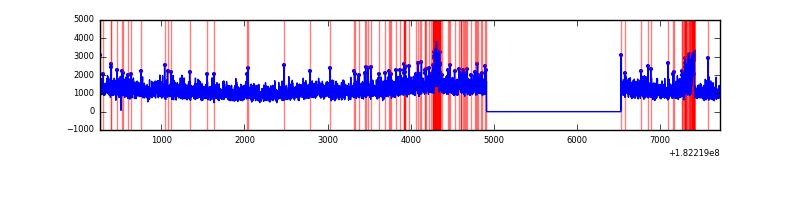 |
| C | 7460 | 5842 | 66 | 66 | 0.88% | 1.13% | 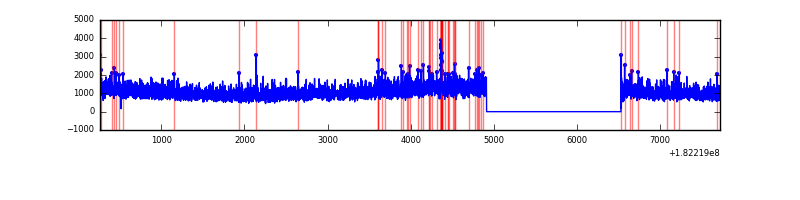 |
| D | 7460 | 5842 | 209 | 209 | 2.80% | 3.58% |  |
Top three noisy pixels from each quadrant. If the there are fewer than three noisy pixels in the level2.evt file, extra rows are filled as -1
| Pixel properties | Quadrant properties | ||||||
|---|---|---|---|---|---|---|---|
| Quadrant | DetID | PixID | Counts | Sigma | Mean | Median | Sigma |
| A | 12 | 244 | 13113 | 30.18 | 1715 | 1701 | 378.1 |
| A | 12 | 189 | 12086 | 27.47 | 1715 | 1701 | 378.1 |
| A | 15 | 127 | 11306 | 25.4 | 1715 | 1701 | 378.1 |
| B | 0 | 247 | 262189 | 642.78 | 1723 | 1732 | 405.2 |
| B | 0 | 217 | 16329 | 36.02 | 1723 | 1732 | 405.2 |
| B | 15 | 219 | 14347 | 31.13 | 1723 | 1732 | 405.2 |
| C | 1 | 192 | 36857 | 81.54 | 1556 | 1614 | 432.2 |
| C | 0 | 188 | 21596 | 46.23 | 1556 | 1614 | 432.2 |
| C | 10 | 33 | 17394 | 36.51 | 1556 | 1614 | 432.2 |
| D | 2 | 89 | 500853 | 1071.34 | 1530 | 1582 | 466.0 |
| D | 13 | 88 | 89583 | 188.83 | 1530 | 1582 | 466.0 |
| D | 1 | 4 | 84180 | 177.24 | 1530 | 1582 | 466.0 |
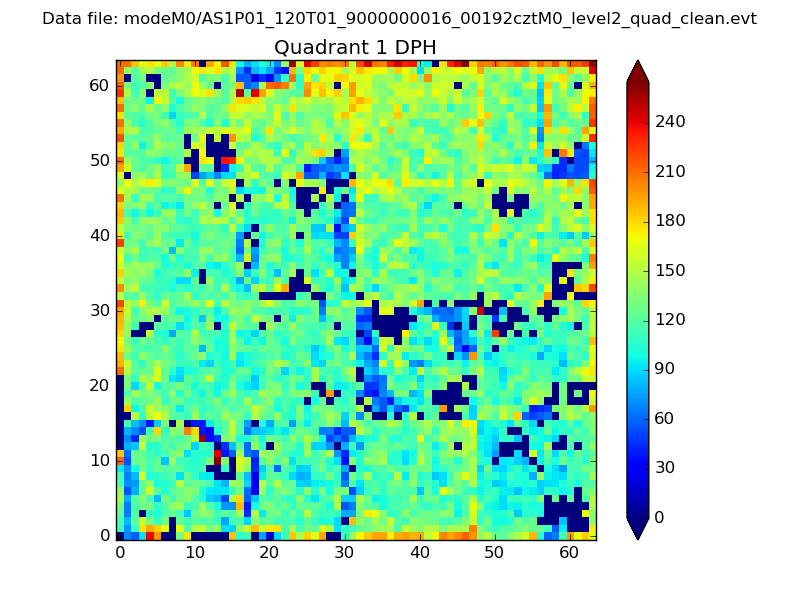
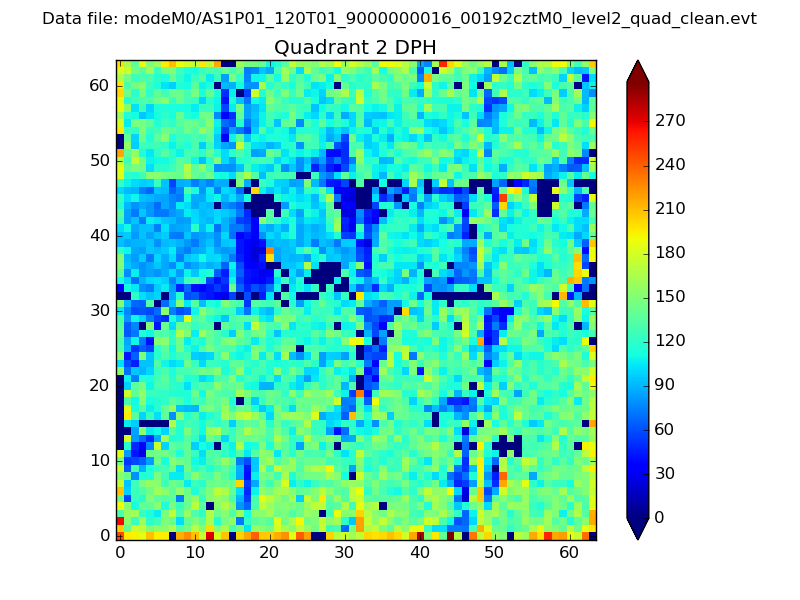
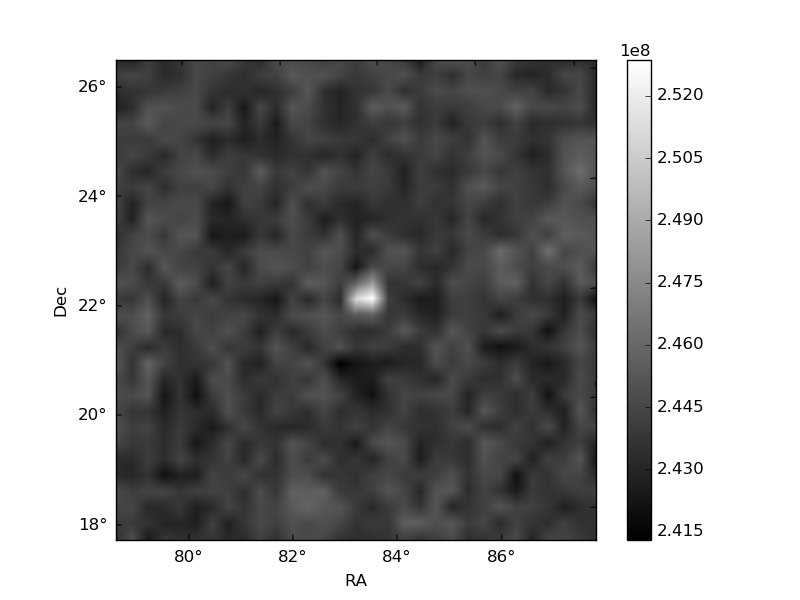
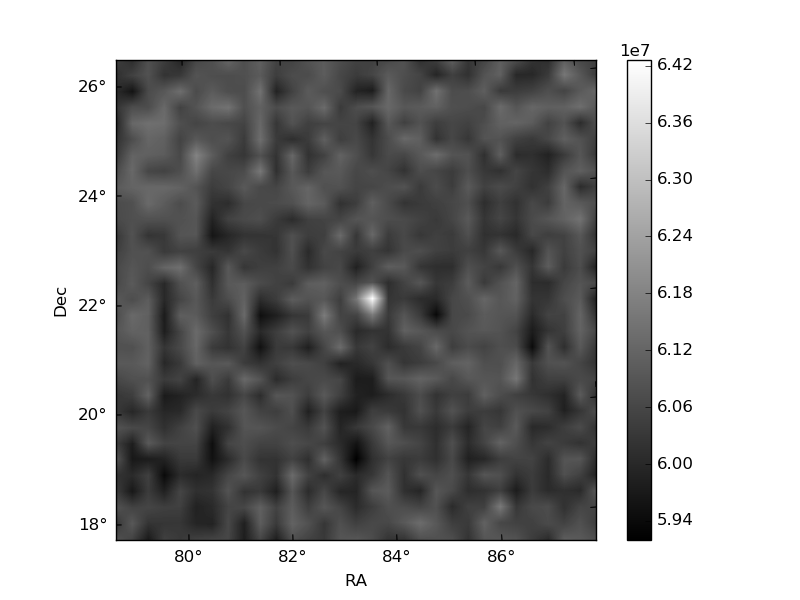
Histogram calculated using DETX and DETY for each event in the final _common_clean file
| Quadrant A | 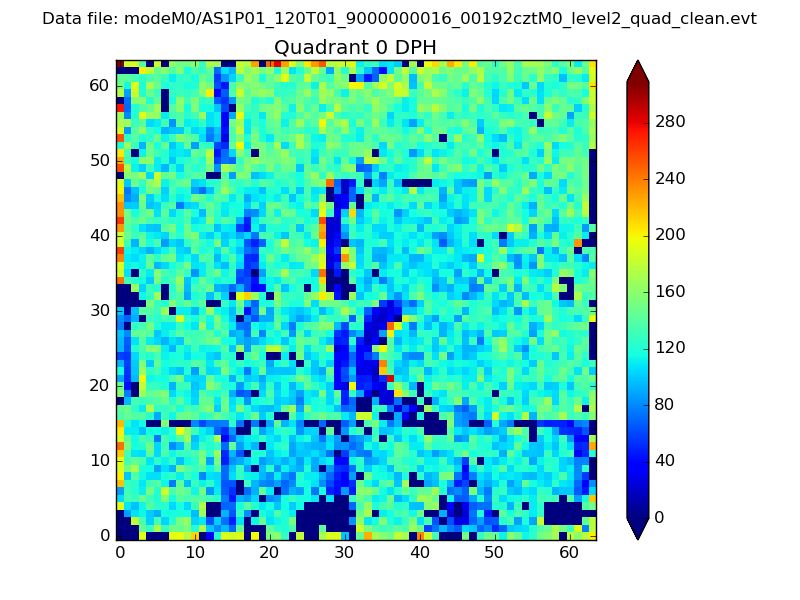 |
 |
Quadrant B |
|---|---|---|---|
| Quadrant D | 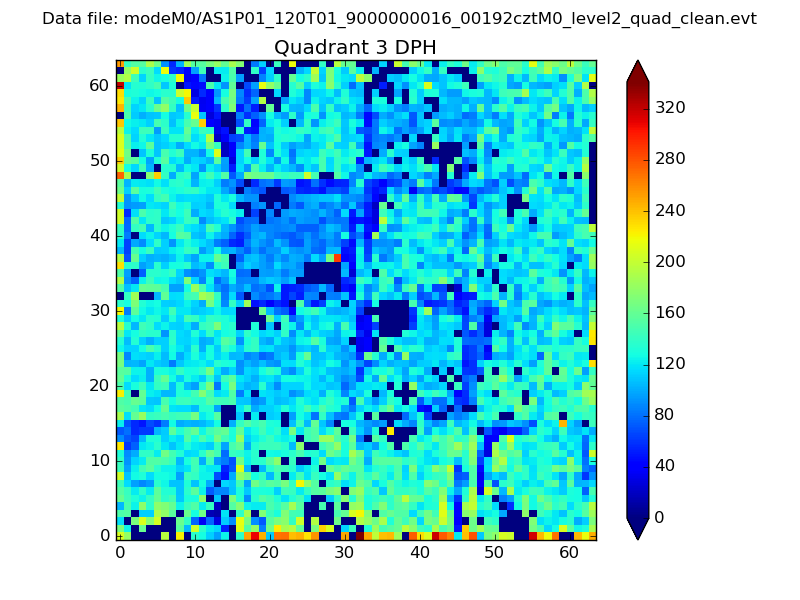 |
 |
Quadrant C |
| Plot type | Count rate plots | Images |
|---|---|---|
| Comparison with Poisson distribution Blue bars denote a histogram of data divided into 1 sec bins. Red curve is a Poisson curve with rate = median count rate of data. |
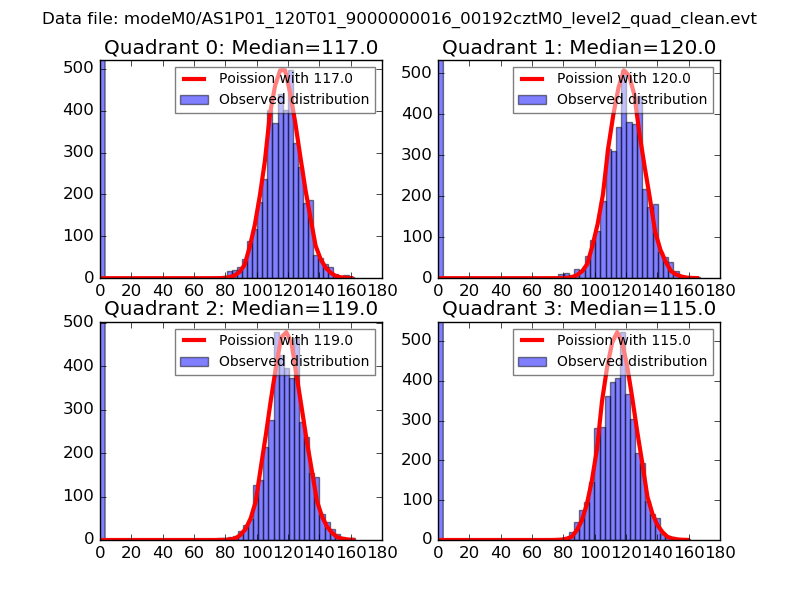 |
 |
| Quadrant-wise count rates Data is divided into 100 sec bins |
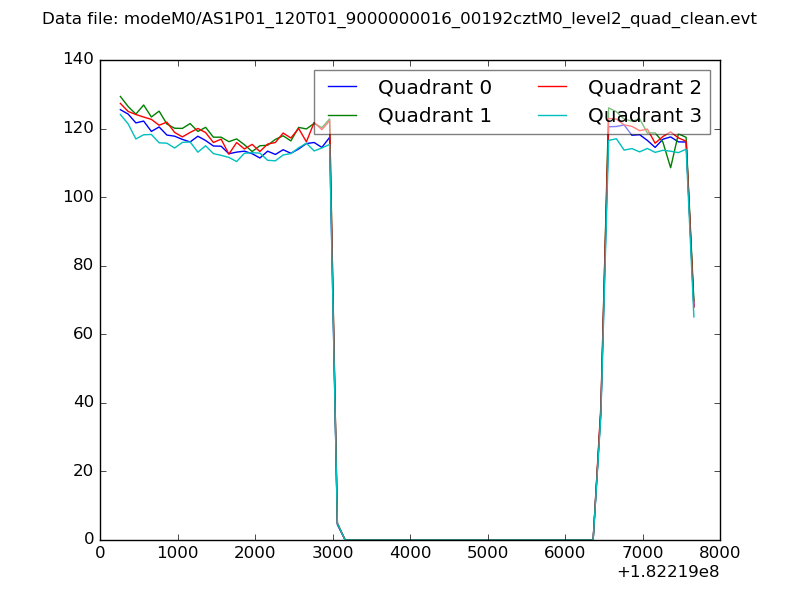 |
|
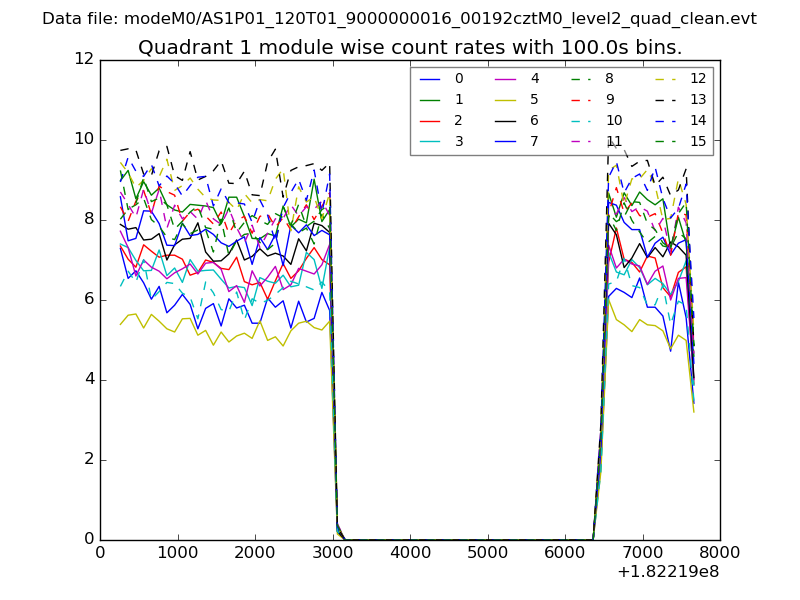
| Module-wise count rates for Quadrant A Data is divided into 100 sec bins |
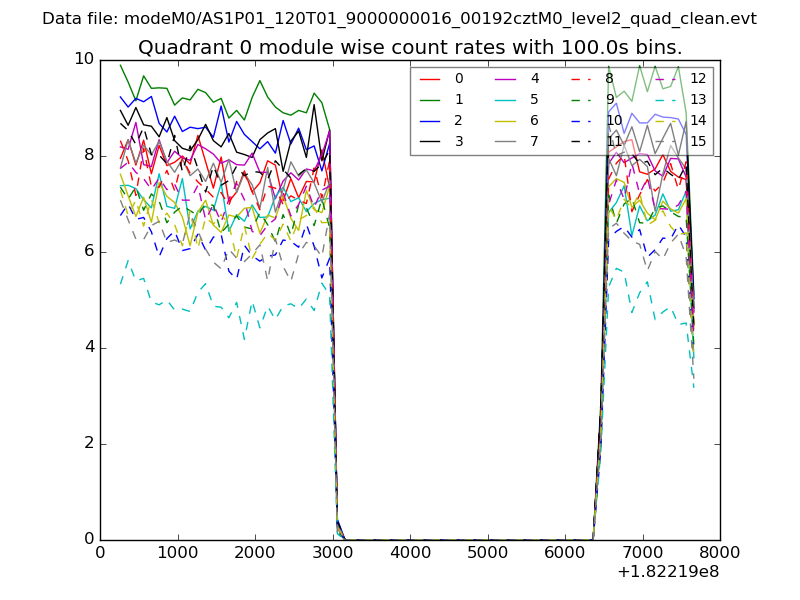 |
 |
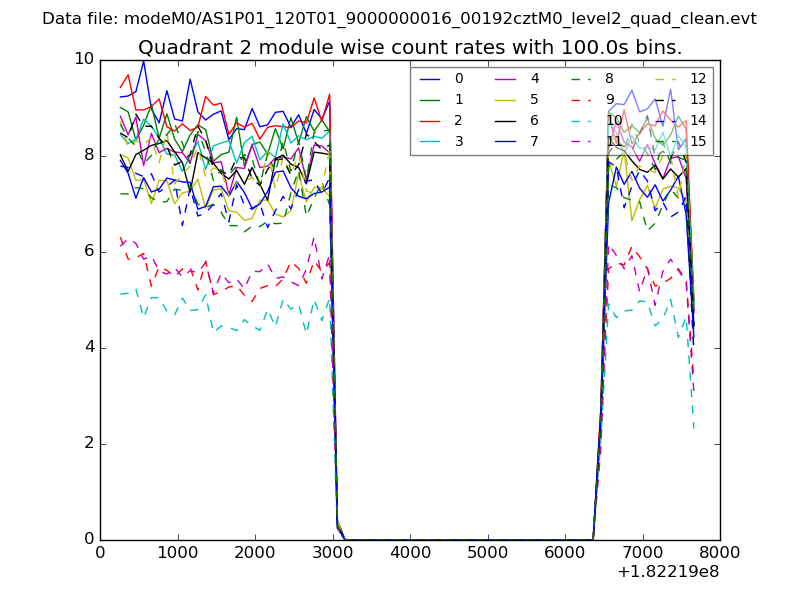
| Module-wise count rates for Quadrant B Data is divided into 100 sec bins |
 |
 |
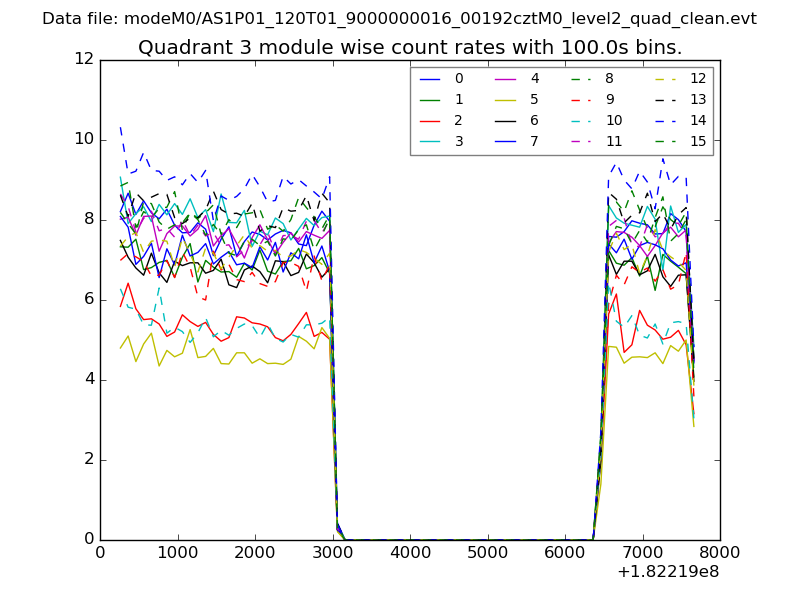
| Module-wise count rates for Quadrant C Data is divided into 100 sec bins |
 |
 |
| Module-wise count rates for Quadrant D Data is divided into 100 sec bins |
 |
 |
| Parameter | Plot |
|---|---|
| CZT HV Monitor | 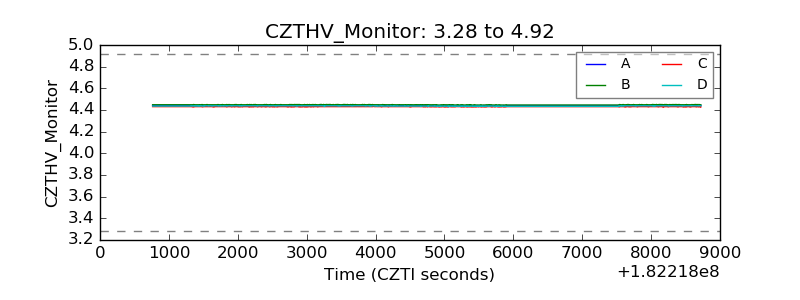 |
| D_VDD | 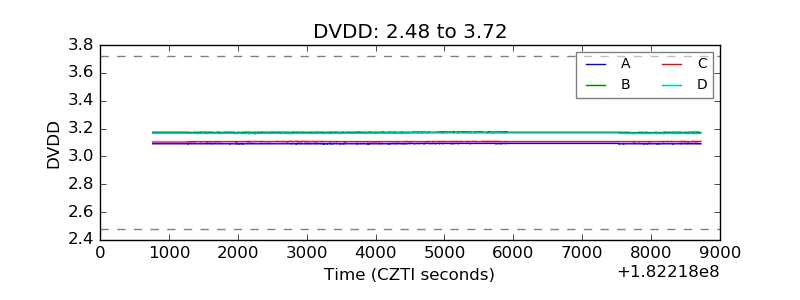 |
| Temperature 1 | 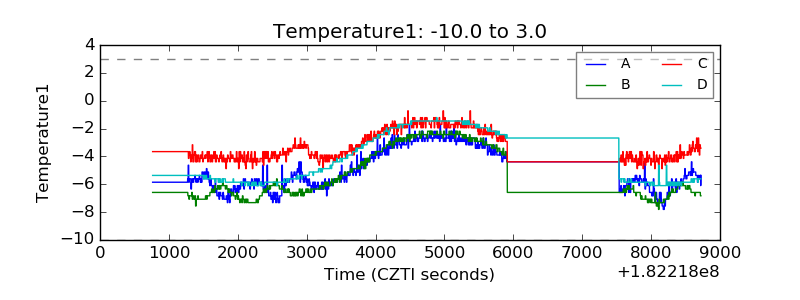 |
| Veto HV Monitor | 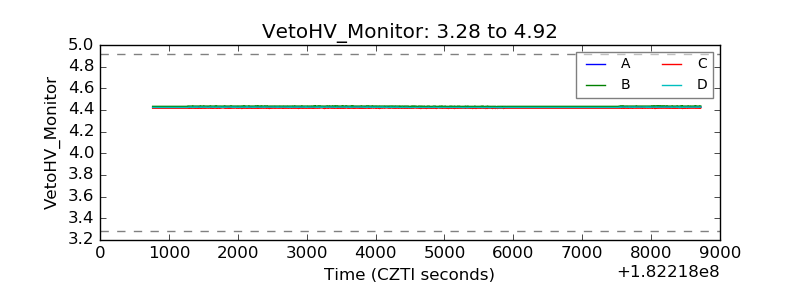 |
| Veto LLD | 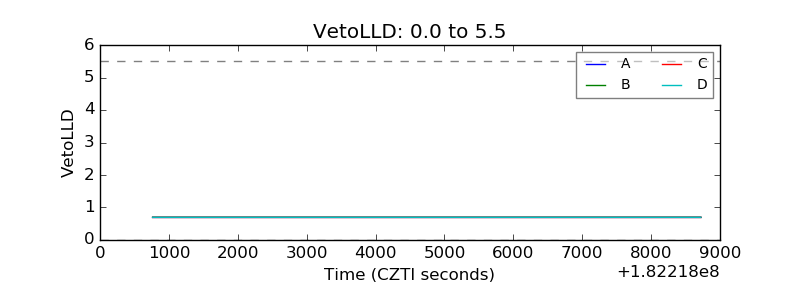 |
| Alpha Counter | 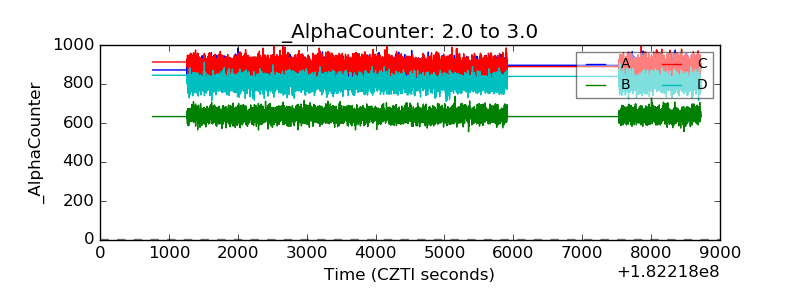 |
| _CPM_Rate | 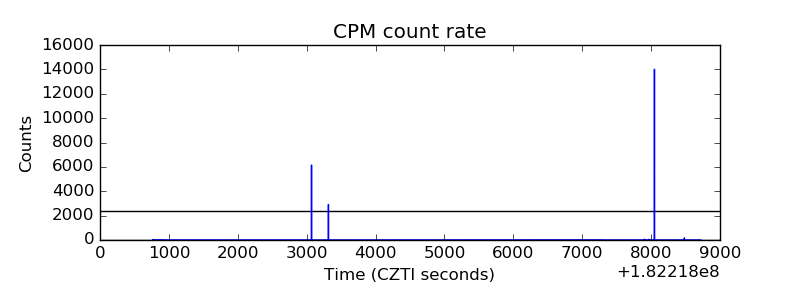 |
| CZT Counter | 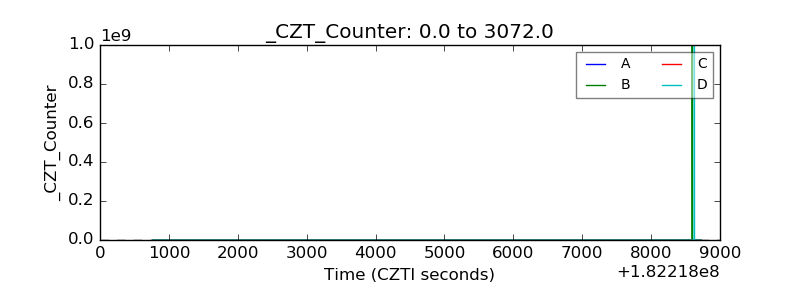 |
| +2.5 Volts monitor |  |
| +5 Volts monitor |  |
| _ROLL_ROT | 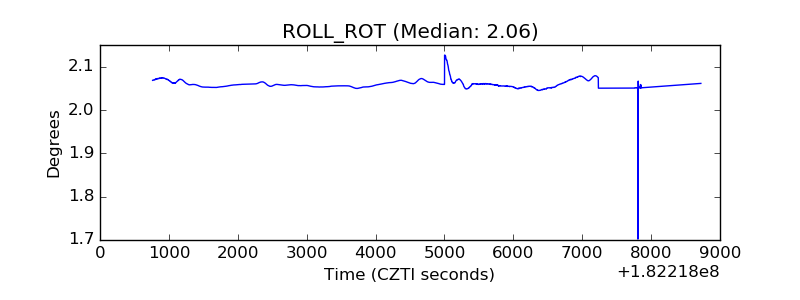 |
| _Roll_DEC | 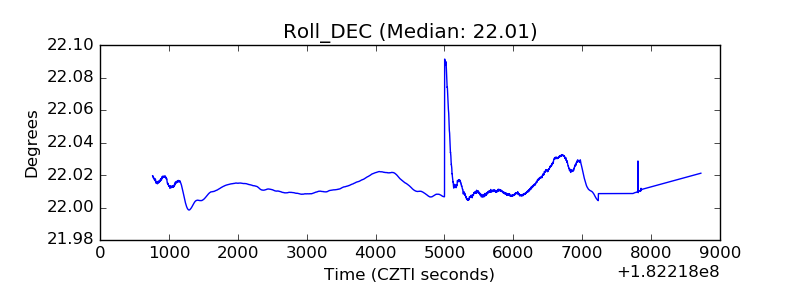 |
| _Roll_RA | 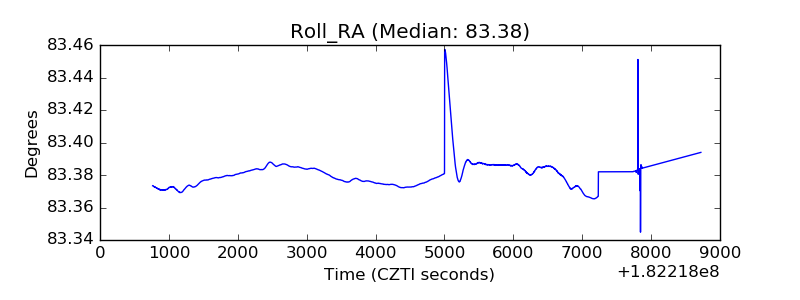 |
| Veto Counter | 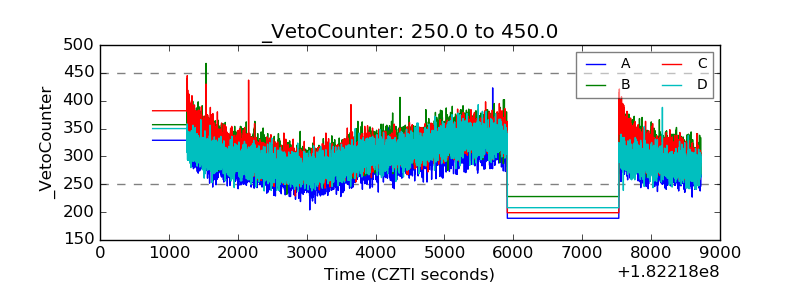 |