| Param | Original file | Final file |
|---|---|---|
| Filename | modeM0/AS1P01_120T01_9000000016_00193cztM0_level2.evt | modeM0/AS1P01_120T01_9000000016_00193cztM0_level2_quad_clean.evt |
| Size (bytes) | 306,178,560 | 25,427,520 |
| Size | 292.0 MB | 24.2 MB |
| Events in quadrant A | 2,277,025 | 156,637 |
| Events in quadrant B | 2,306,392 | 160,419 |
| Events in quadrant C | 2,206,730 | 157,867 |
| Events in quadrant D | 2,349,155 | 151,497 |
| Mode SS | |||
|---|---|---|---|
| Quadrant | BADHDUFLAG | Total packets | Discarded packets |
| A | 0 | 156 | 106 |
| B | 0 | 150 | 104 |
| C | 0 | 154 | 110 |
| D | 0 | 157 | 111 |
| Mode M0 | |||
|---|---|---|---|
| Quadrant | BADHDUFLAG | Total packets | Discarded packets |
| A | 0 | 30395 | 22241 |
| B | 0 | 31094 | 22857 |
| C | 0 | 28984 | 21041 |
| D | 0 | 33116 | 24743 |
| Mode M9 | |||
|---|---|---|---|
| Quadrant | BADHDUFLAG | Total packets | Discarded packets |
| A | 0 | 39 | 23 |
| B | 0 | 37 | 21 |
| C | 0 | 33 | 17 |
| D | 0 | 37 | 21 |
| Quadrant | Total seconds | Saturated seconds | Saturation percentage |
|---|---|---|---|
| A | 1958 | 1 | 0.051073% |
| B | 1941 | 1 | 0.051520% |
| C | 1962 | 15 | 0.764526% |
| D | 1933 | 36 | 1.862390% |
Noise dominated data is calculated using 1-second bins in cleaned event files. If a bin has >2000 counts, and if more than 50% of those come from <1% of pixels, then it is considered to be noise-dominated and hence unusable.
| Quadrant | # 1 sec bins | Bins with >0 counts | Bins with >2000 counts | High rate bins dominated by noise | Noise dominated (total time) | Noise dominated (detector-on time) | Marked lightcurve |
|---|---|---|---|---|---|---|---|
| A | 4020 | 2090 | 32 | 32 | 0.80% | 1.53% |  |
| B | 3907 | 2075 | 36 | 36 | 0.92% | 1.73% |  |
| C | 4027 | 2091 | 41 | 41 | 1.02% | 1.96% | 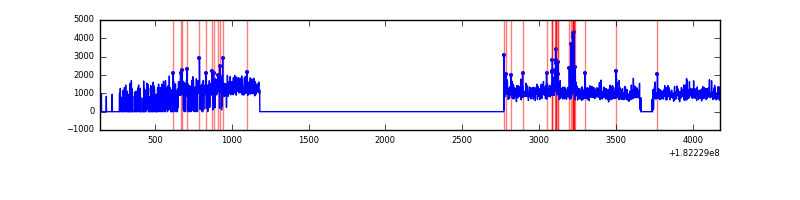 |
| D | 4036 | 2062 | 115 | 115 | 2.85% | 5.58% |  |
Top three noisy pixels from each quadrant. If the there are fewer than three noisy pixels in the level2.evt file, extra rows are filled as -1
| Pixel properties | Quadrant properties | ||||||
|---|---|---|---|---|---|---|---|
| Quadrant | DetID | PixID | Counts | Sigma | Mean | Median | Sigma |
| A | 15 | 127 | 6997 | 49.87 | 583 | 580 | 128.7 |
| A | 0 | 253 | 3823 | 25.2 | 583 | 580 | 128.7 |
| A | 12 | 189 | 3242 | 20.69 | 583 | 580 | 128.7 |
| B | 0 | 247 | 13815 | 94.59 | 593 | 594 | 139.8 |
| B | 14 | 50 | 9207 | 61.62 | 593 | 594 | 139.8 |
| B | 0 | 217 | 4098 | 25.07 | 593 | 594 | 139.8 |
| C | 1 | 192 | 70459 | 463.17 | 533 | 552 | 150.9 |
| C | 0 | 202 | 28664 | 186.26 | 533 | 552 | 150.9 |
| C | 0 | 188 | 3753 | 21.21 | 533 | 552 | 150.9 |
| D | 10 | 229 | 133701 | 847.46 | 511 | 527 | 157.1 |
| D | 2 | 33 | 123205 | 780.67 | 511 | 527 | 157.1 |
| D | 5 | 48 | 37700 | 236.55 | 511 | 527 | 157.1 |
Histogram calculated using DETX and DETY for each event in the final _common_clean file
| Quadrant A | 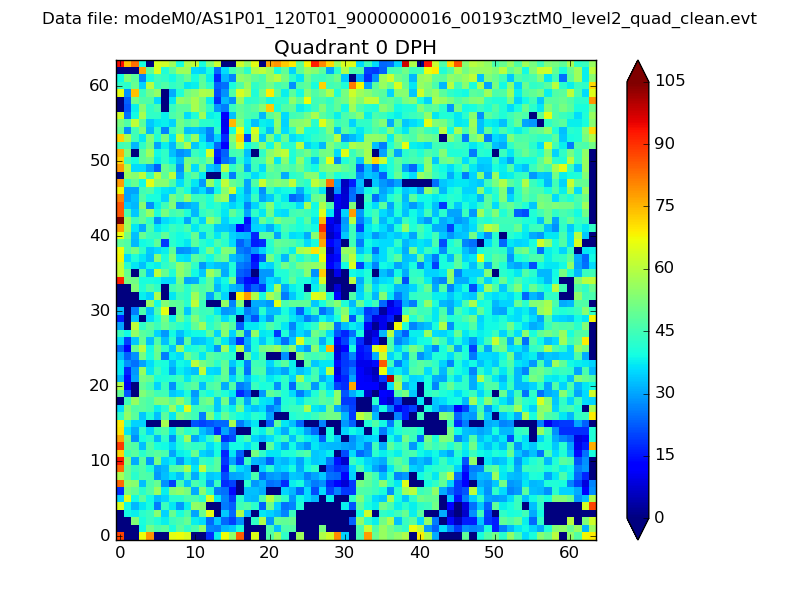 |
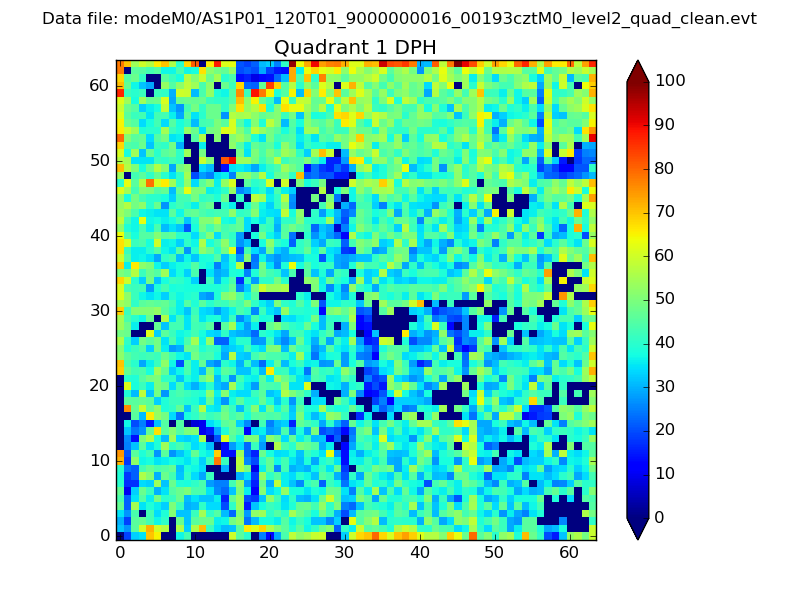 |
Quadrant B |
|---|---|---|---|
| Quadrant D | 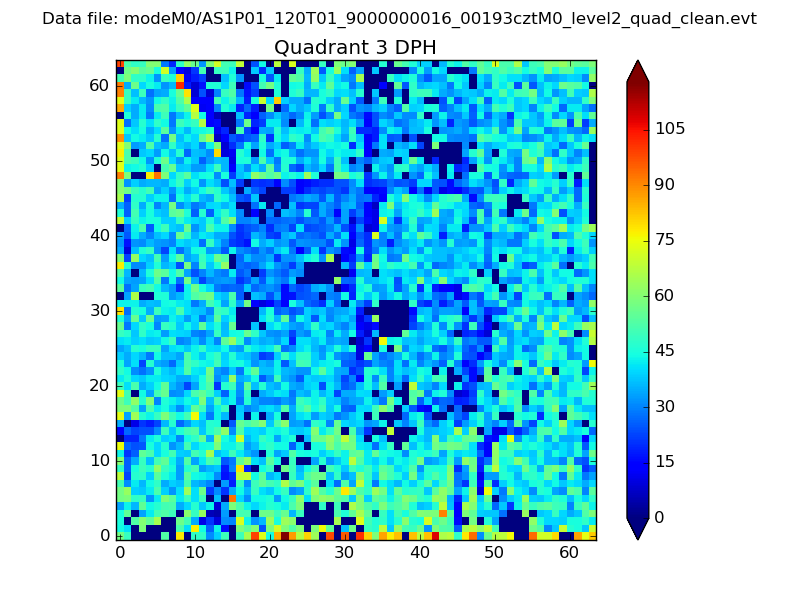 |
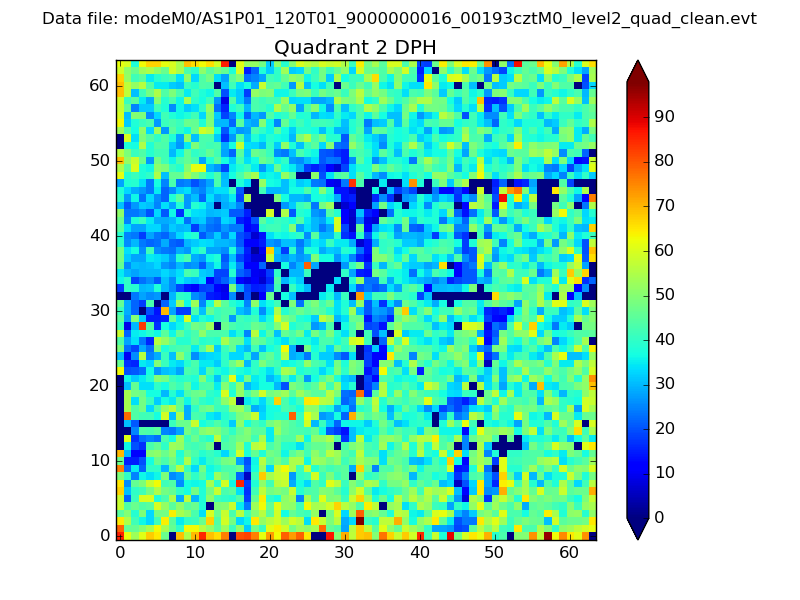 |
Quadrant C |
| Plot type | Count rate plots | Images |
|---|---|---|
| Comparison with Poisson distribution Blue bars denote a histogram of data divided into 1 sec bins. Red curve is a Poisson curve with rate = median count rate of data. |
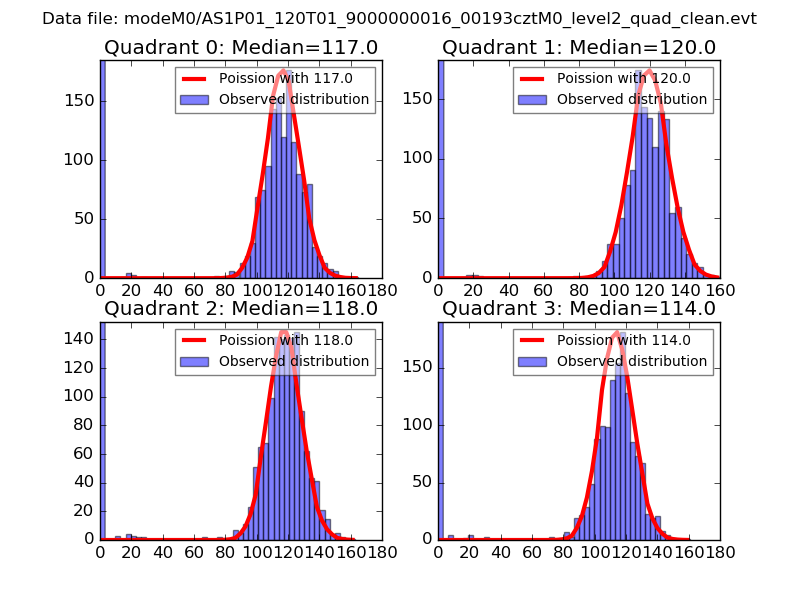 |
 |
| Quadrant-wise count rates Data is divided into 100 sec bins |
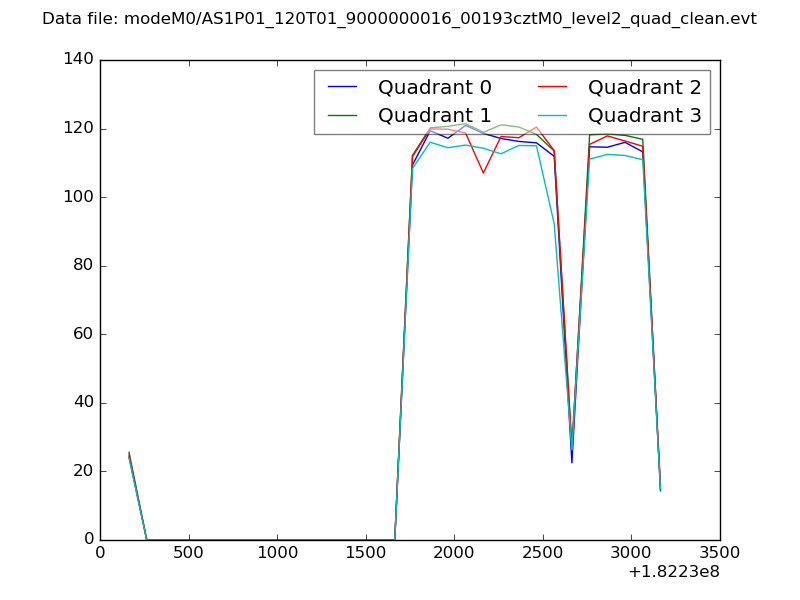 |
|
| Module-wise count rates for Quadrant A Data is divided into 100 sec bins |
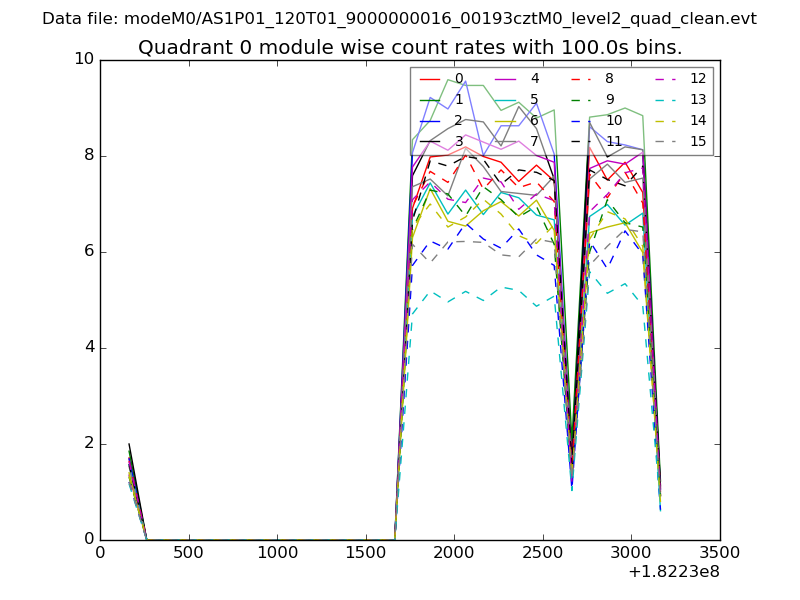 |
 |
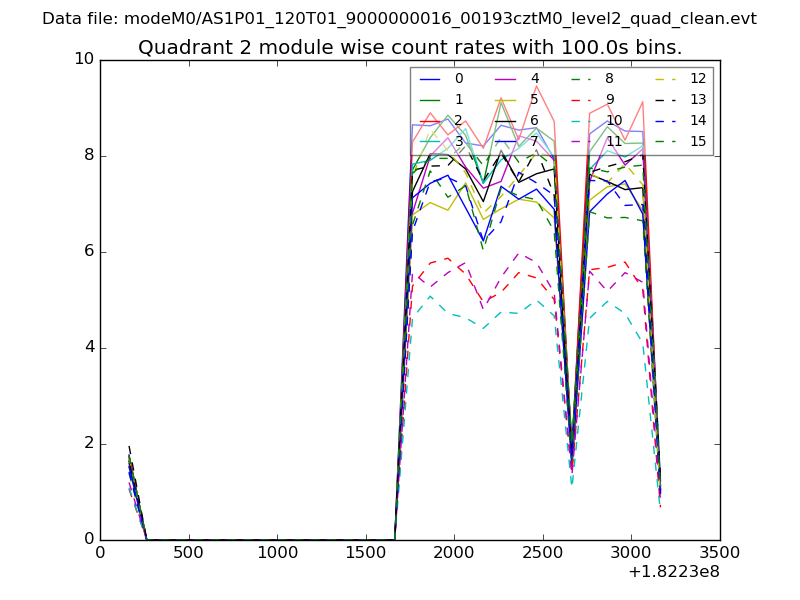
| Module-wise count rates for Quadrant B Data is divided into 100 sec bins |
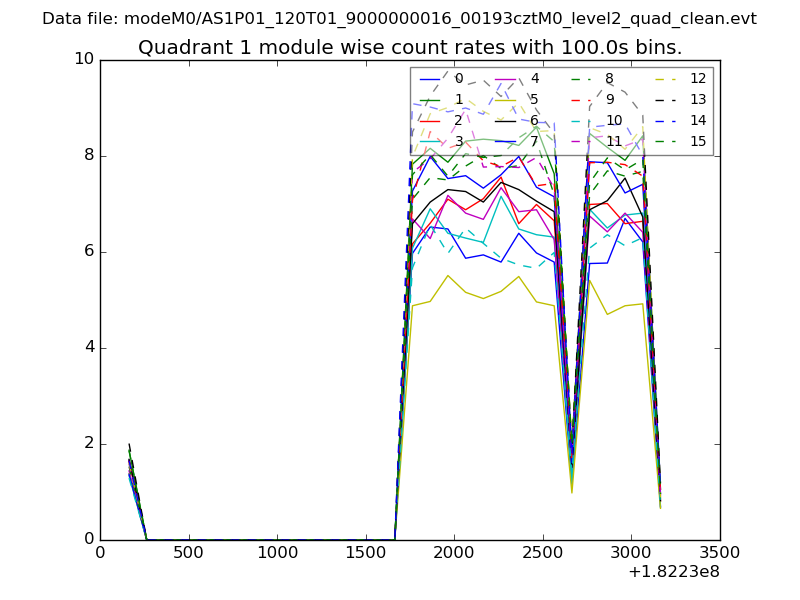 |
 |
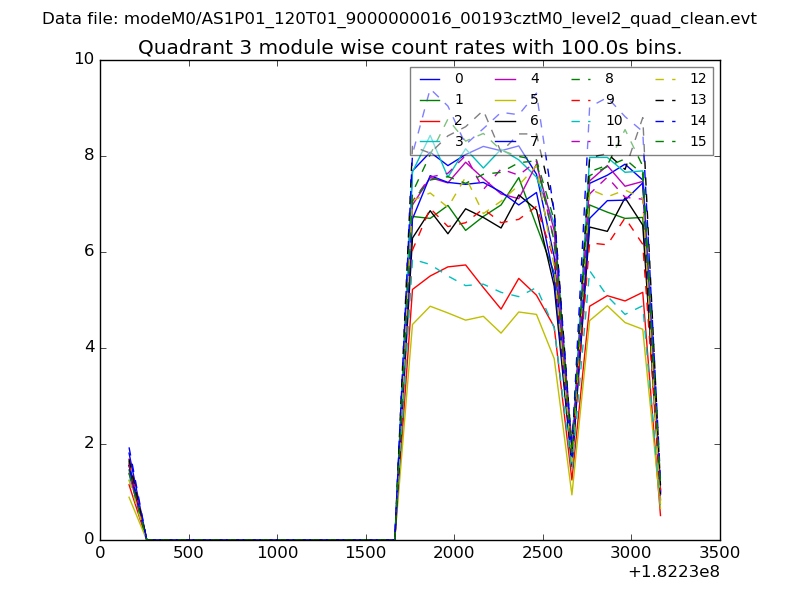
| Module-wise count rates for Quadrant C Data is divided into 100 sec bins |
 |
 |
| Module-wise count rates for Quadrant D Data is divided into 100 sec bins |
 |
 |
| Parameter | Plot |
|---|---|
| CZT HV Monitor | 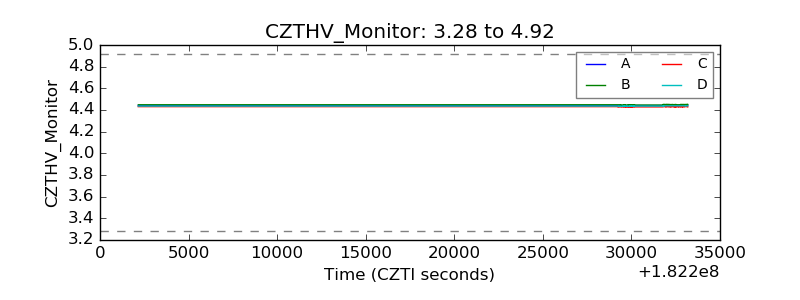 |
| D_VDD | 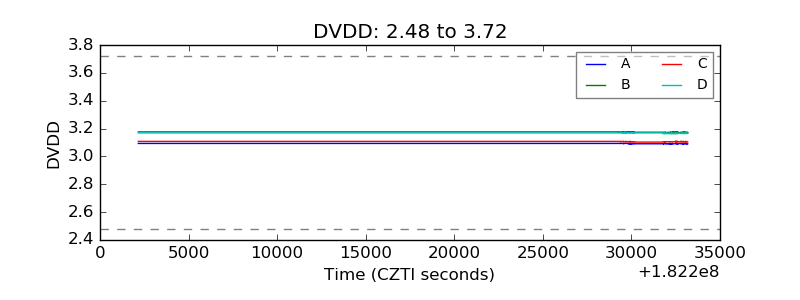 |
| Temperature 1 | 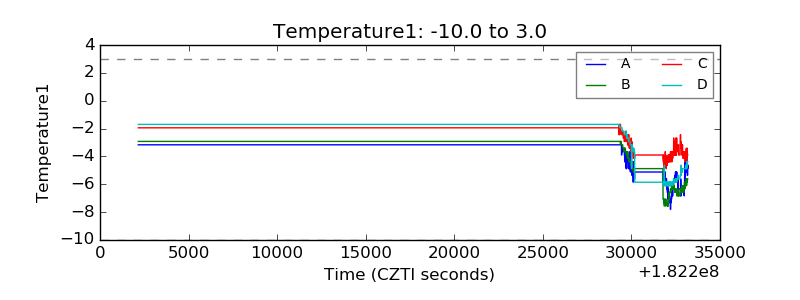 |
| Veto HV Monitor | 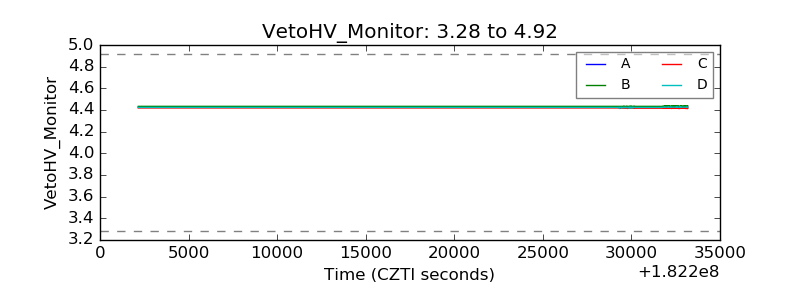 |
| Veto LLD | 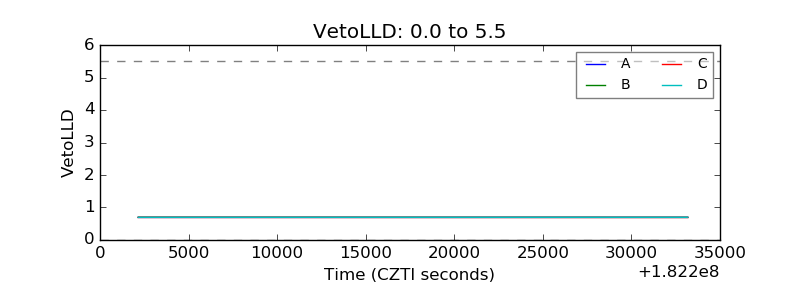 |
| Alpha Counter | 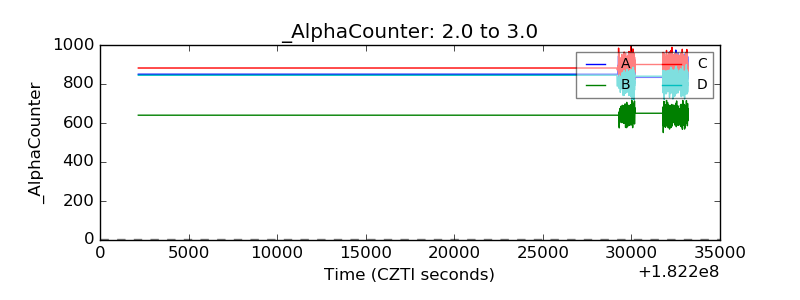 |
| _CPM_Rate | 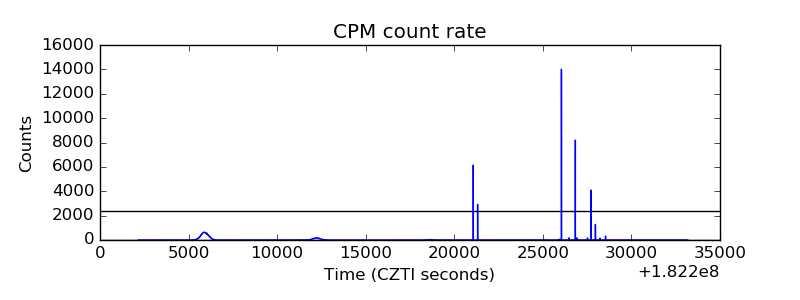 |
| CZT Counter | 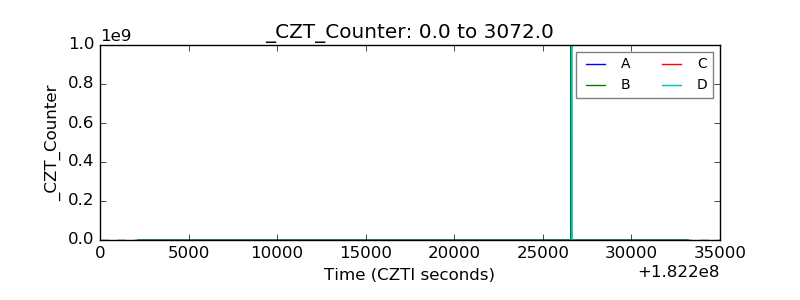 |
| +2.5 Volts monitor |  |
| +5 Volts monitor |  |
| _ROLL_ROT | 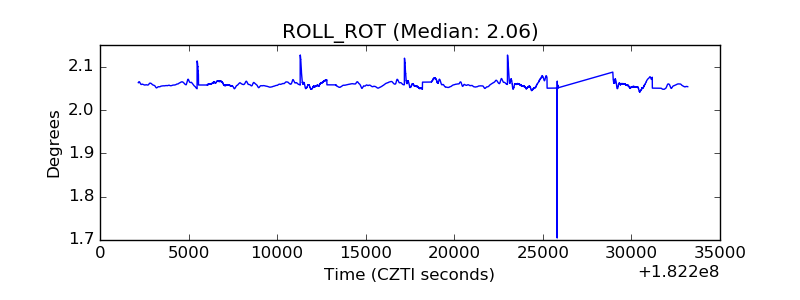 |
| _Roll_DEC | 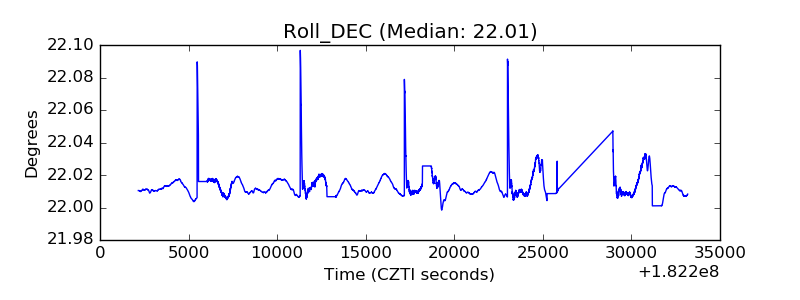 |
| _Roll_RA | 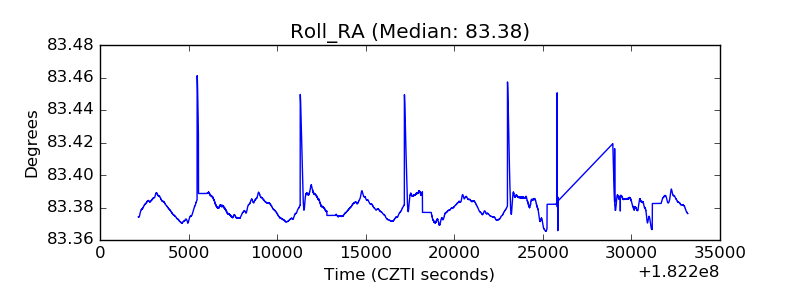 |
| Veto Counter | 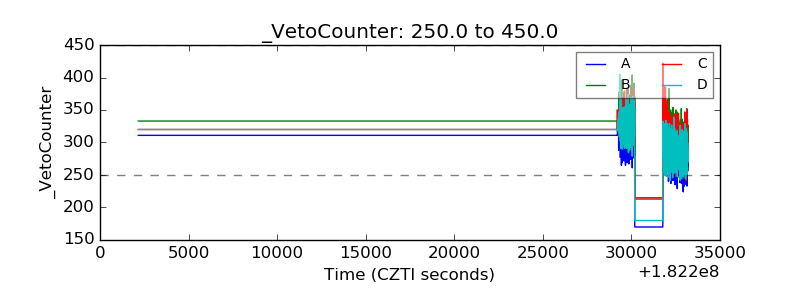 |