| Param | Original file | Final file |
|---|---|---|
| Filename | modeM0/AS1P01_120T01_9000000016_00194cztM0_level2.evt | modeM0/AS1P01_120T01_9000000016_00194cztM0_level2_quad_clean.evt |
| Size (bytes) | 810,593,280 | 48,165,120 |
| Size | 773.0 MB | 45.9 MB |
| Events in quadrant A | 5,591,424 | 286,524 |
| Events in quadrant B | 7,503,790 | 281,090 |
| Events in quadrant C | 5,355,078 | 288,752 |
| Events in quadrant D | 5,788,023 | 273,250 |
| Mode SS | |||
|---|---|---|---|
| Quadrant | BADHDUFLAG | Total packets | Discarded packets |
| A | 0 | 188 | 94 |
| B | 0 | 188 | 94 |
| C | 0 | 188 | 94 |
| D | 0 | 188 | 94 |
| Mode M0 | |||
|---|---|---|---|
| Quadrant | BADHDUFLAG | Total packets | Discarded packets |
| A | 0 | 39818 | 19910 |
| B | 0 | 51438 | 25723 |
| C | 0 | 38476 | 19239 |
| D | 0 | 41076 | 20539 |
| Mode M9 | |||
|---|---|---|---|
| Quadrant | BADHDUFLAG | Total packets | Discarded packets |
| A | 0 | 4 | 2 |
| B | 0 | 4 | 2 |
| C | 0 | 4 | 2 |
| D | 0 | 6 | 3 |
| Quadrant | Total seconds | Saturated seconds | Saturation percentage |
|---|---|---|---|
| A | 4679 | 3 | 0.064116% |
| B | 4678 | 677 | 14.471997% |
| C | 4679 | 15 | 0.320581% |
| D | 4679 | 96 | 2.051720% |
Noise dominated data is calculated using 1-second bins in cleaned event files. If a bin has >2000 counts, and if more than 50% of those come from <1% of pixels, then it is considered to be noise-dominated and hence unusable.
| Quadrant | # 1 sec bins | Bins with >0 counts | Bins with >2000 counts | High rate bins dominated by noise | Noise dominated (total time) | Noise dominated (detector-on time) | Marked lightcurve |
|---|---|---|---|---|---|---|---|
| A | 4680 | 4680 | 99 | 99 | 2.12% | 2.12% | 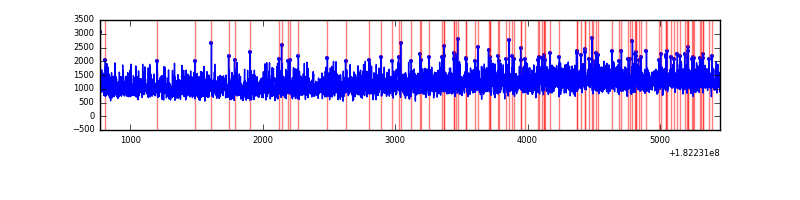 |
| B | 4680 | 4680 | 1265 | 1265 | 27.03% | 27.03% | 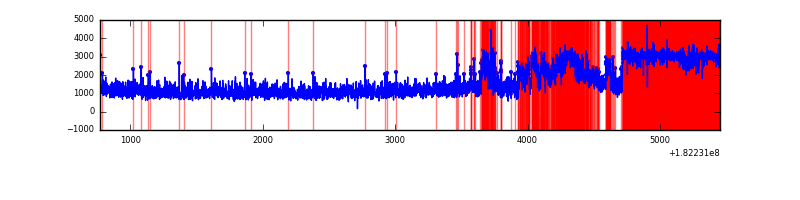 |
| C | 4680 | 4680 | 73 | 73 | 1.56% | 1.56% | 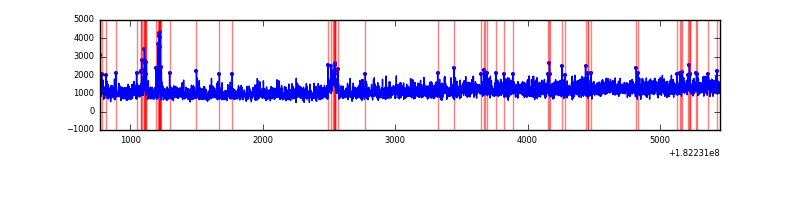 |
| D | 4680 | 4680 | 241 | 241 | 5.15% | 5.15% | 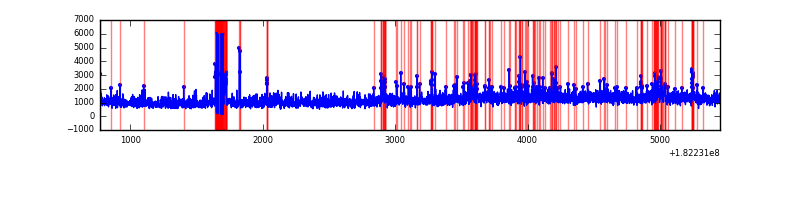 |
Top three noisy pixels from each quadrant. If the there are fewer than three noisy pixels in the level2.evt file, extra rows are filled as -1
| Pixel properties | Quadrant properties | ||||||
|---|---|---|---|---|---|---|---|
| Quadrant | DetID | PixID | Counts | Sigma | Mean | Median | Sigma |
| A | 12 | 189 | 14225 | 40.13 | 1436 | 1422 | 319.0 |
| A | 0 | 253 | 7841 | 20.12 | 1436 | 1422 | 319.0 |
| A | 13 | 239 | 7831 | 20.09 | 1436 | 1422 | 319.0 |
| B | 0 | 247 | 2163073 | 6702.42 | 1377 | 1386 | 322.5 |
| B | 0 | 217 | 18334 | 52.55 | 1377 | 1386 | 322.5 |
| B | 0 | 183 | 9685 | 25.73 | 1377 | 1386 | 322.5 |
| C | 0 | 202 | 140401 | 384.83 | 1288 | 1333 | 361.4 |
| C | 1 | 192 | 125357 | 343.2 | 1288 | 1333 | 361.4 |
| C | 0 | 188 | 11235 | 27.4 | 1288 | 1333 | 361.4 |
| D | 10 | 229 | 339416 | 859.77 | 1290 | 1337 | 393.2 |
| D | 13 | 88 | 75962 | 189.78 | 1290 | 1337 | 393.2 |
| D | 9 | 51 | 71825 | 179.26 | 1290 | 1337 | 393.2 |
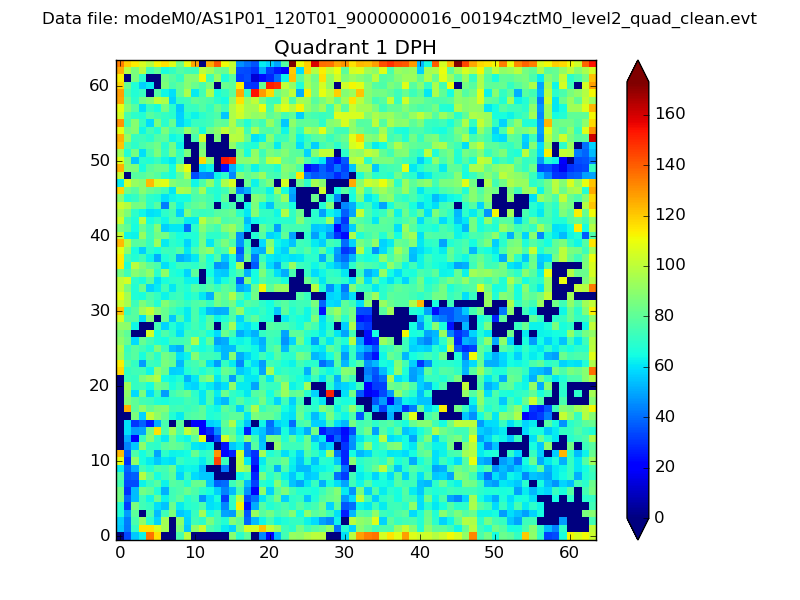
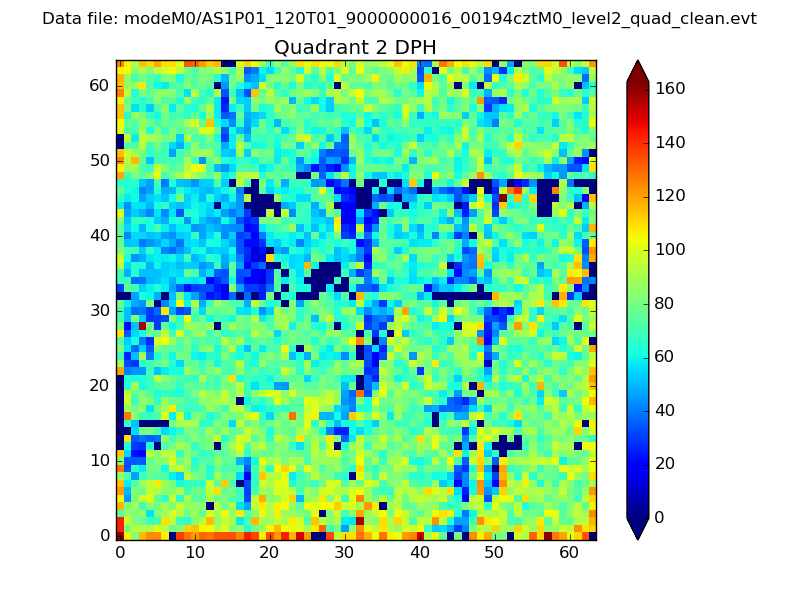
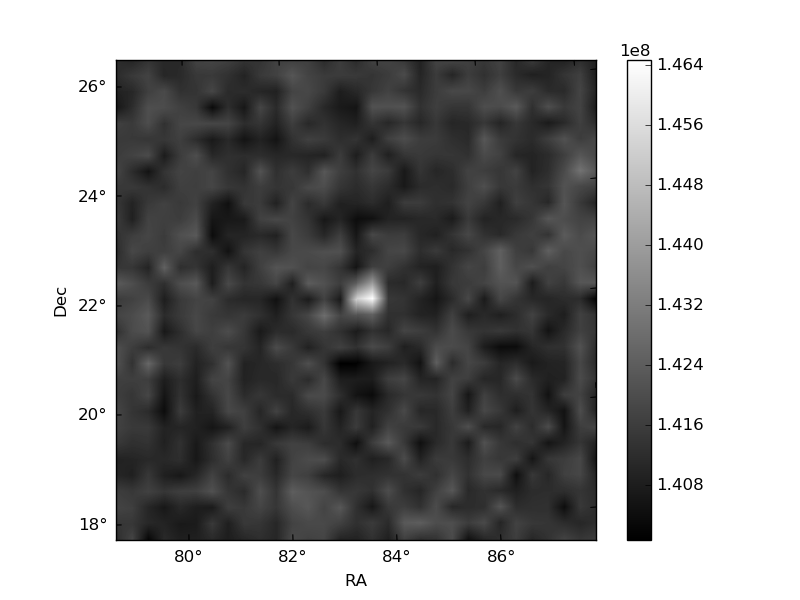
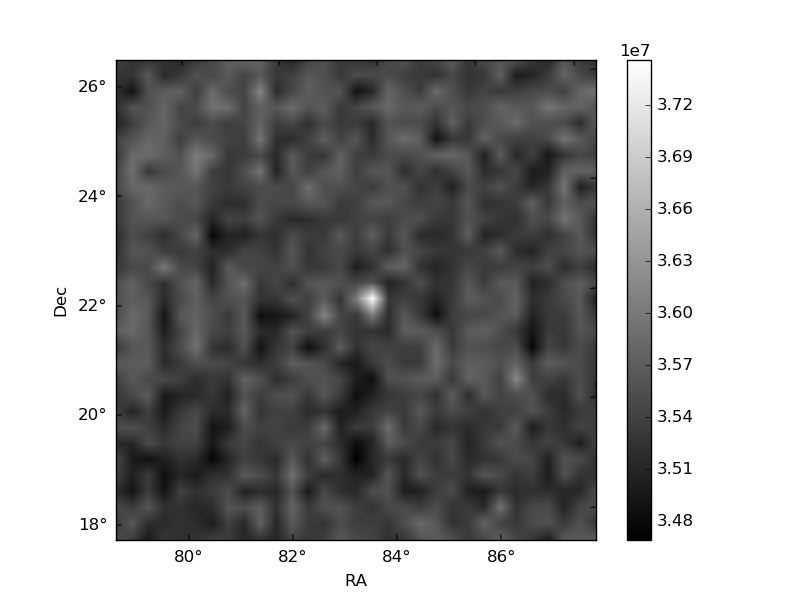
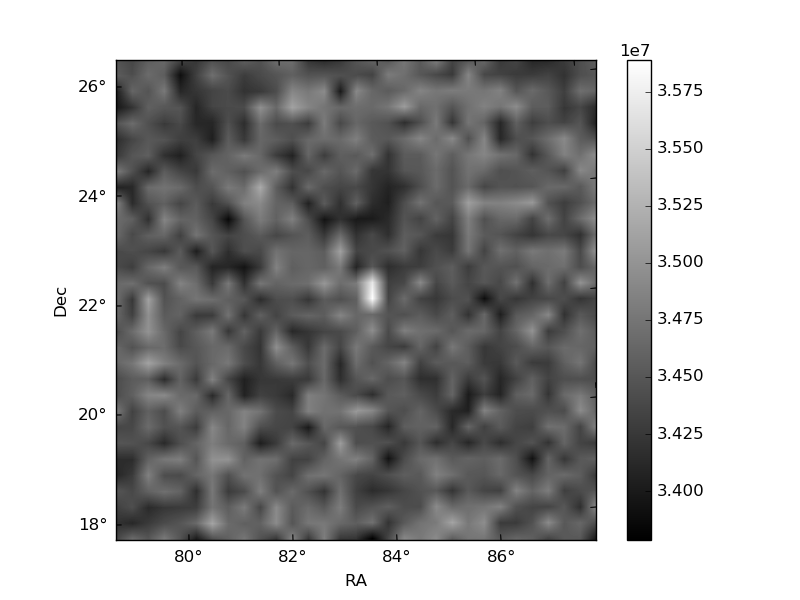
Histogram calculated using DETX and DETY for each event in the final _common_clean file
| Quadrant A |  |
 |
Quadrant B |
|---|---|---|---|
| Quadrant D | 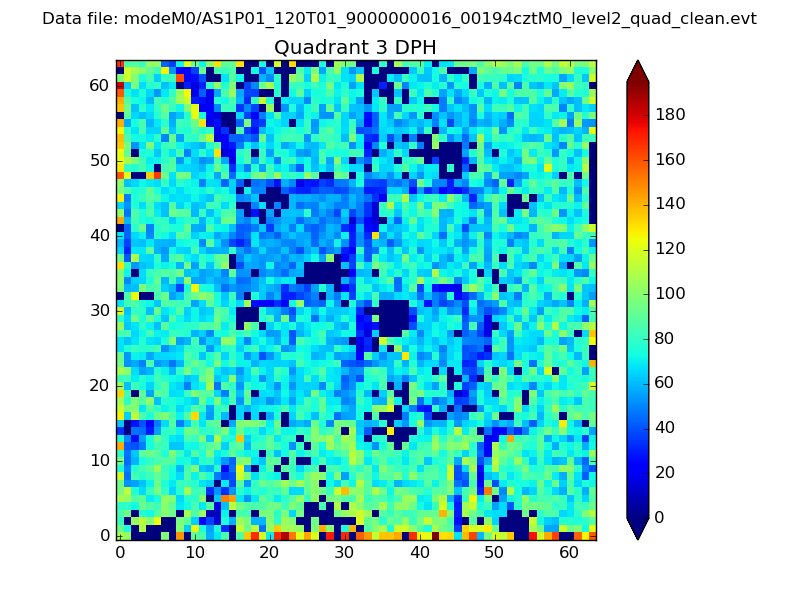 |
 |
Quadrant C |
| Plot type | Count rate plots | Images |
|---|---|---|
| Comparison with Poisson distribution Blue bars denote a histogram of data divided into 1 sec bins. Red curve is a Poisson curve with rate = median count rate of data. |
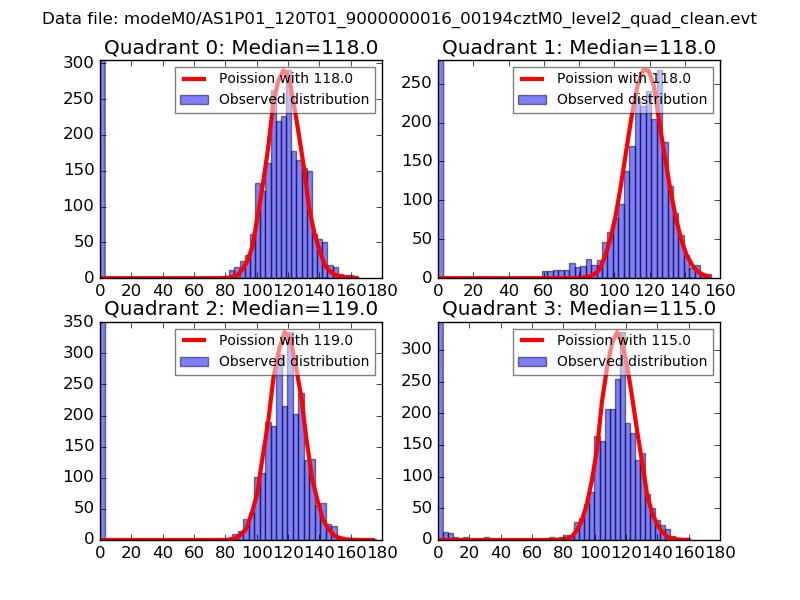 |
 |
| Quadrant-wise count rates Data is divided into 100 sec bins |
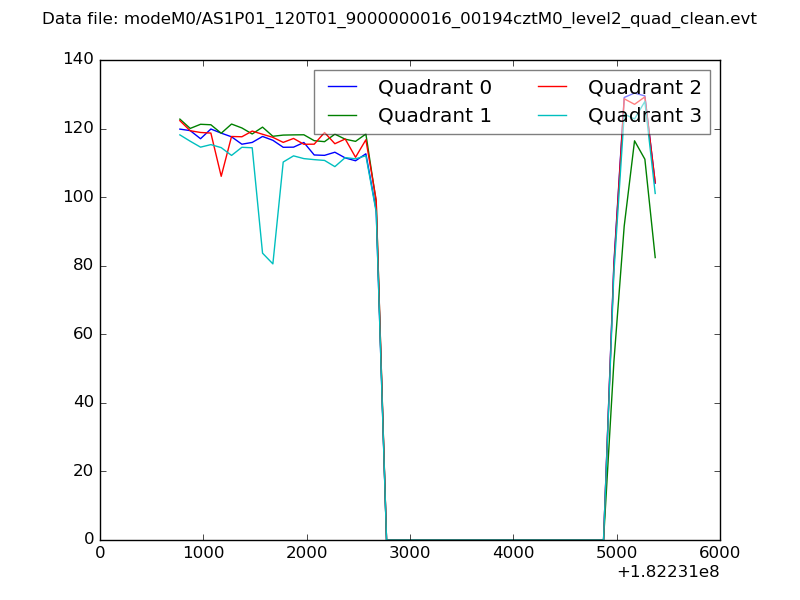 |
|
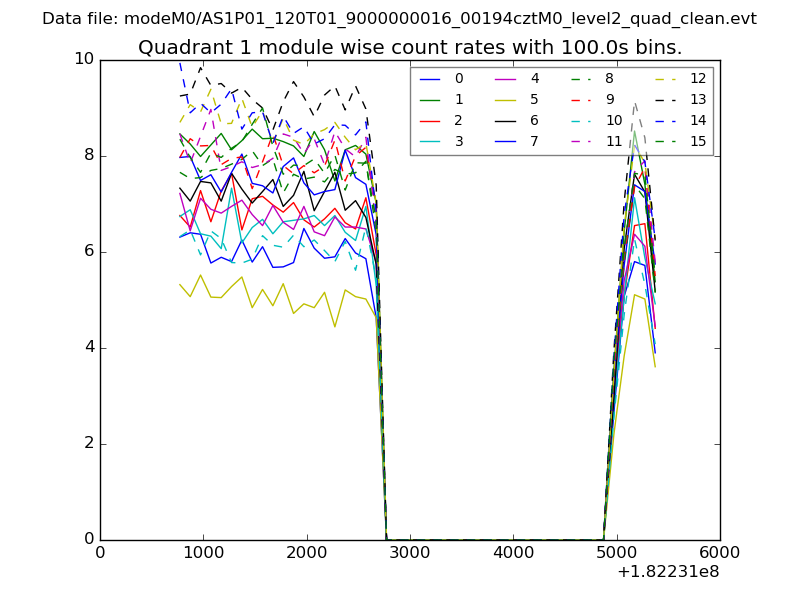
| Module-wise count rates for Quadrant A Data is divided into 100 sec bins |
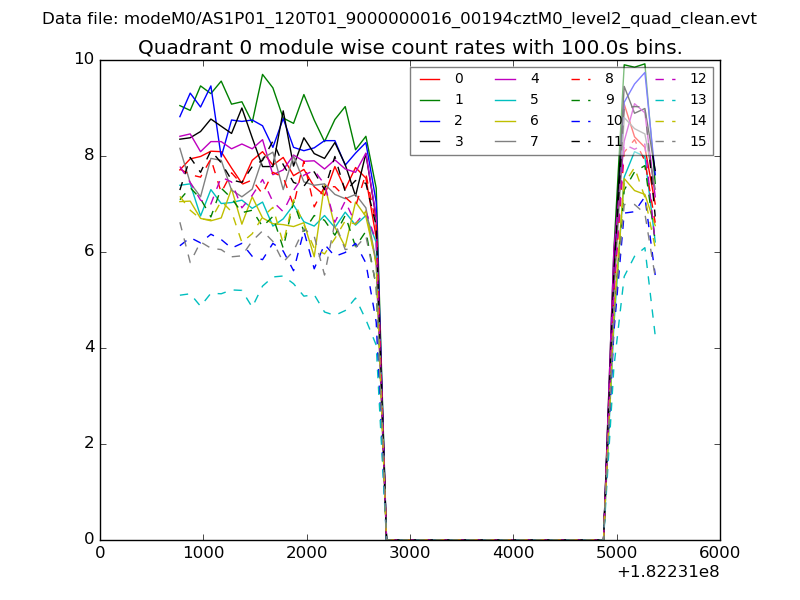 |
 |
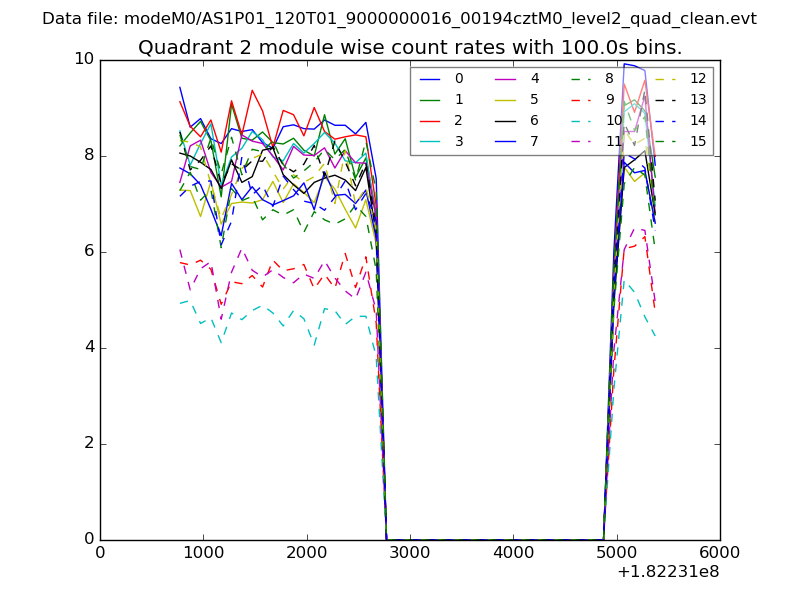
| Module-wise count rates for Quadrant B Data is divided into 100 sec bins |
 |
 |
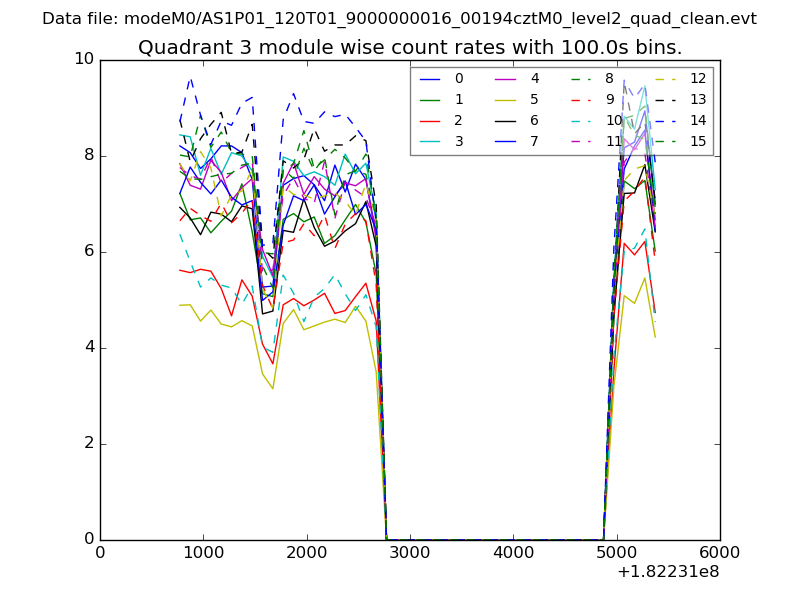
| Module-wise count rates for Quadrant C Data is divided into 100 sec bins |
 |
 |
| Module-wise count rates for Quadrant D Data is divided into 100 sec bins |
 |
 |
| Parameter | Plot |
|---|---|
| CZT HV Monitor | 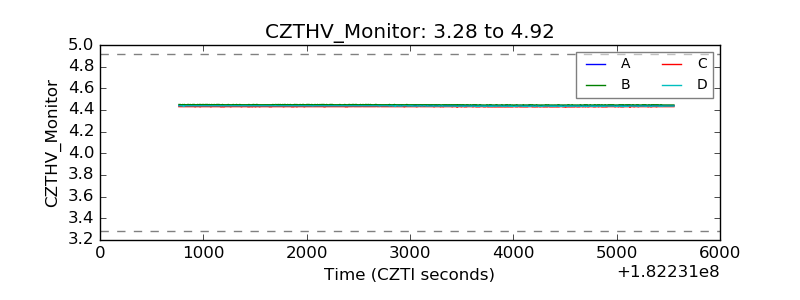 |
| D_VDD | 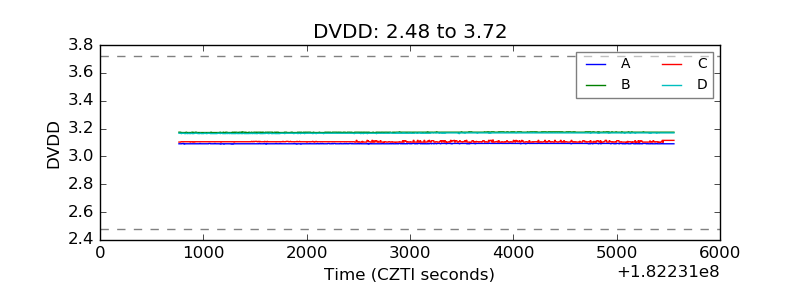 |
| Temperature 1 | 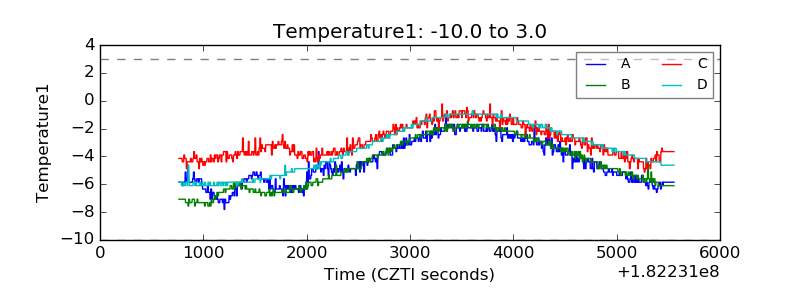 |
| Veto HV Monitor | 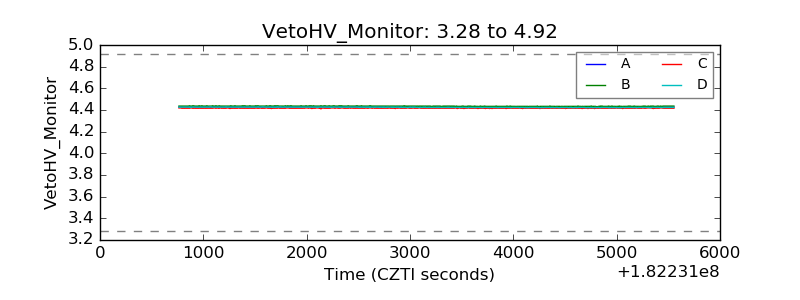 |
| Veto LLD | 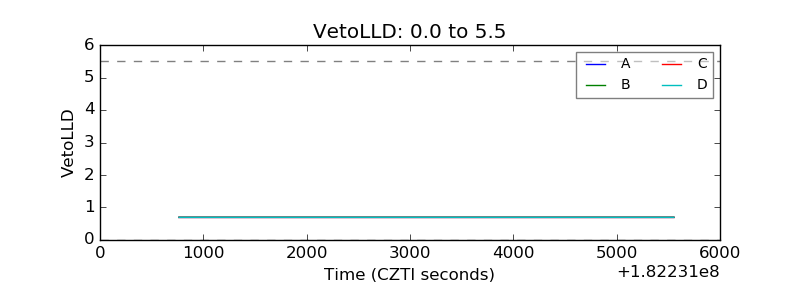 |
| Alpha Counter | 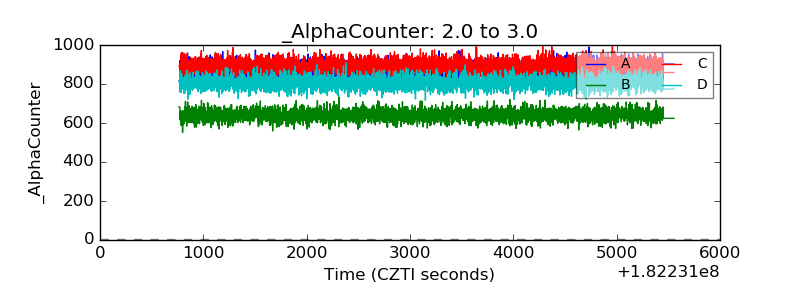 |
| _CPM_Rate | 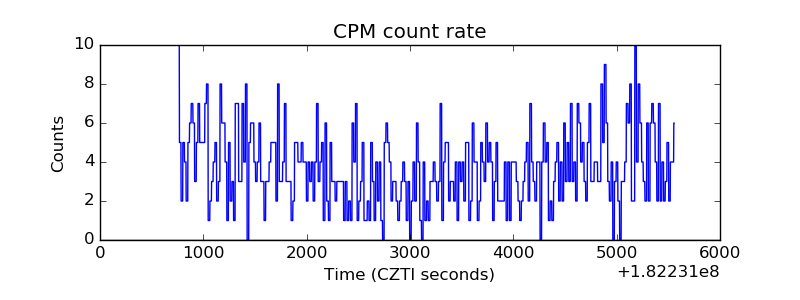 |
| CZT Counter | 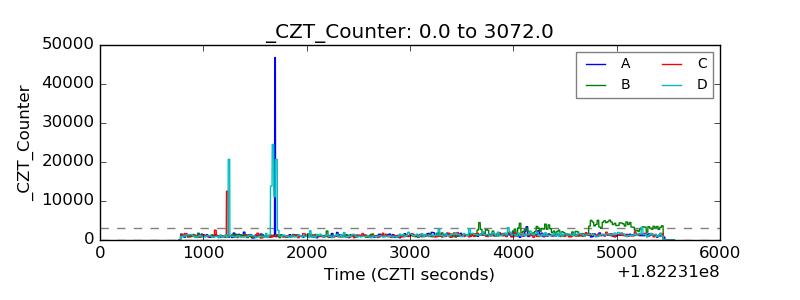 |
| +2.5 Volts monitor |  |
| +5 Volts monitor |  |
| _ROLL_ROT | 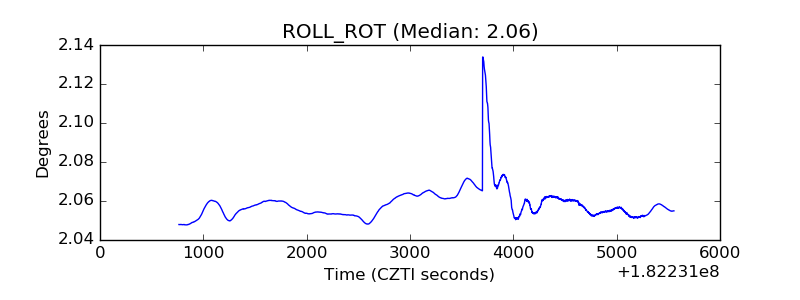 |
| _Roll_DEC | 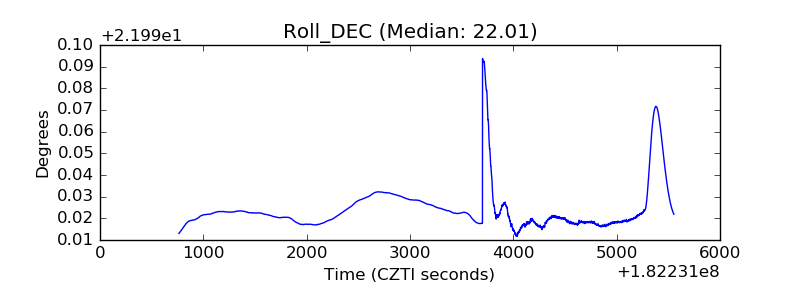 |
| _Roll_RA | 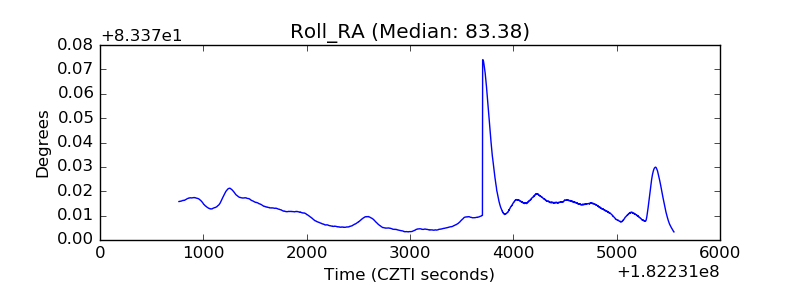 |
| Veto Counter | 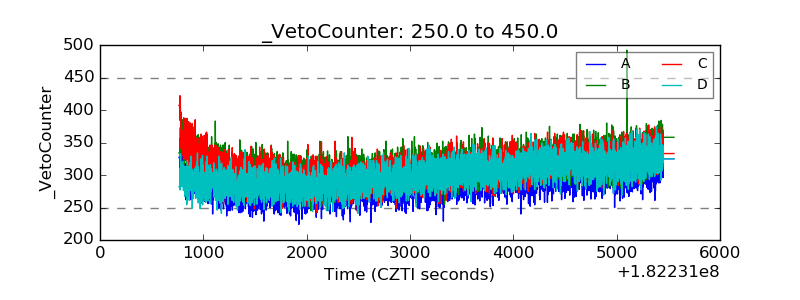 |