| Param | Original file | Final file |
|---|---|---|
| Filename | modeM0/AS1P01_136T01_9000000014_00182cztM0_level2.evt | modeM0/AS1P01_136T01_9000000014_00182cztM0_level2_quad_clean.evt |
| Size (bytes) | 1,128,090,240 | 46,491,840 |
| Size | 1.1 GB | 44.3 MB |
| Events in quadrant A | 9,057,617 | 245,989 |
| Events in quadrant B | 9,362,229 | 257,661 |
| Events in quadrant C | 6,998,639 | 252,670 |
| Events in quadrant D | 8,358,056 | 239,573 |
| Mode M0 | |||
|---|---|---|---|
| Quadrant | BADHDUFLAG | Total packets | Discarded packets |
| A | 0 | 31186 | 2 |
| B | 0 | 32066 | 1 |
| C | 0 | 25087 | 1 |
| D | 0 | 29105 | 1 |
| Mode M9 | |||
|---|---|---|---|
| Quadrant | BADHDUFLAG | Total packets | Discarded packets |
| A | 0 | 16 | 0 |
| B | 0 | 16 | 0 |
| C | 0 | 16 | 0 |
| D | 0 | 16 | 0 |
| Mode SS | |||
|---|---|---|---|
| Quadrant | BADHDUFLAG | Total packets | Discarded packets |
| A | 0 | 120 | 0 |
| B | 0 | 120 | 0 |
| C | 0 | 120 | 0 |
| D | 0 | 120 | 0 |
| Quadrant | Total seconds | Saturated seconds | Saturation percentage |
|---|---|---|---|
| A | 5844 | 265 | 4.534565% |
| B | 5870 | 176 | 2.998296% |
| C | 5893 | 37 | 0.627864% |
| D | 5943 | 184 | 3.096079% |
Noise dominated data is calculated using 1-second bins in cleaned event files. If a bin has >2000 counts, and if more than 50% of those come from <1% of pixels, then it is considered to be noise-dominated and hence unusable.
| Quadrant | # 1 sec bins | Bins with >0 counts | Bins with >2000 counts | High rate bins dominated by noise | Noise dominated (total time) | Noise dominated (detector-on time) | Marked lightcurve |
|---|---|---|---|---|---|---|---|
| A | 7535 | 5846 | 1017 | 1017 | 13.50% | 17.40% | 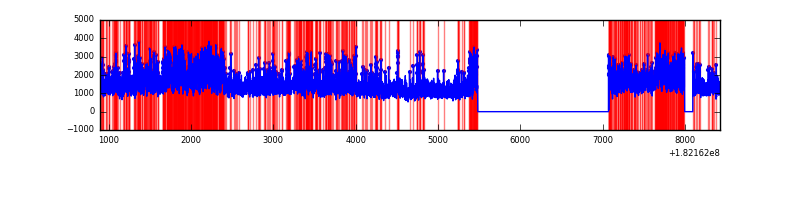 |
| B | 7535 | 5873 | 1175 | 1175 | 15.59% | 20.01% | 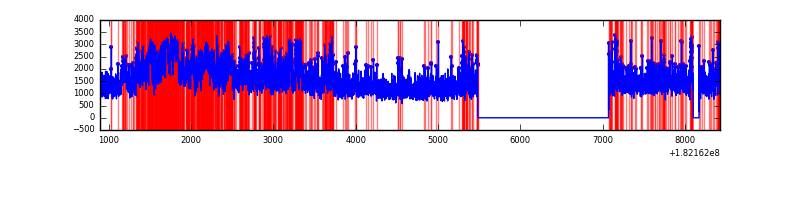 |
| C | 7535 | 5896 | 143 | 143 | 1.90% | 2.43% | 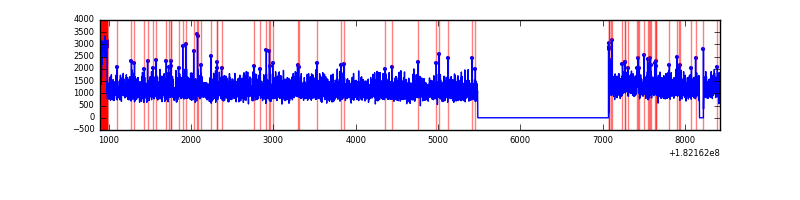 |
| D | 7535 | 5945 | 537 | 537 | 7.13% | 9.03% | 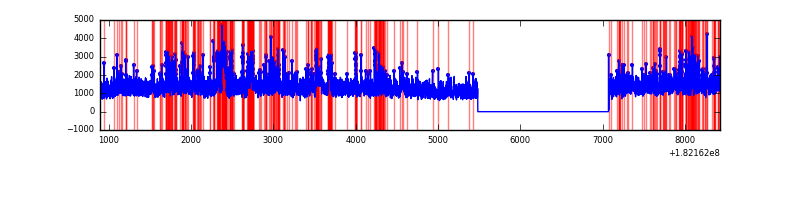 |
Top three noisy pixels from each quadrant. If the there are fewer than three noisy pixels in the level2.evt file, extra rows are filled as -1
| Pixel properties | Quadrant properties | ||||||
|---|---|---|---|---|---|---|---|
| Quadrant | DetID | PixID | Counts | Sigma | Mean | Median | Sigma |
| A | 7 | 128 | 1345718 | 3276.8 | 1851 | 1838 | 410.1 |
| A | 14 | 10 | 416592 | 1011.3 | 1851 | 1838 | 410.1 |
| A | 15 | 79 | 34927 | 80.68 | 1851 | 1838 | 410.1 |
| B | 0 | 247 | 1489980 | 3436.18 | 1846 | 1859 | 433.1 |
| B | 10 | 199 | 528989 | 1217.18 | 1846 | 1859 | 433.1 |
| B | 3 | 204 | 86017 | 194.33 | 1846 | 1859 | 433.1 |
| C | 0 | 202 | 139784 | 286.64 | 1703 | 1769 | 481.5 |
| C | 9 | 201 | 52403 | 105.16 | 1703 | 1769 | 481.5 |
| C | 0 | 188 | 44556 | 88.86 | 1703 | 1769 | 481.5 |
| D | 13 | 89 | 779182 | 1469.92 | 1713 | 1770 | 528.9 |
| D | 12 | 14 | 264877 | 497.48 | 1713 | 1770 | 528.9 |
| D | 13 | 255 | 262809 | 493.57 | 1713 | 1770 | 528.9 |
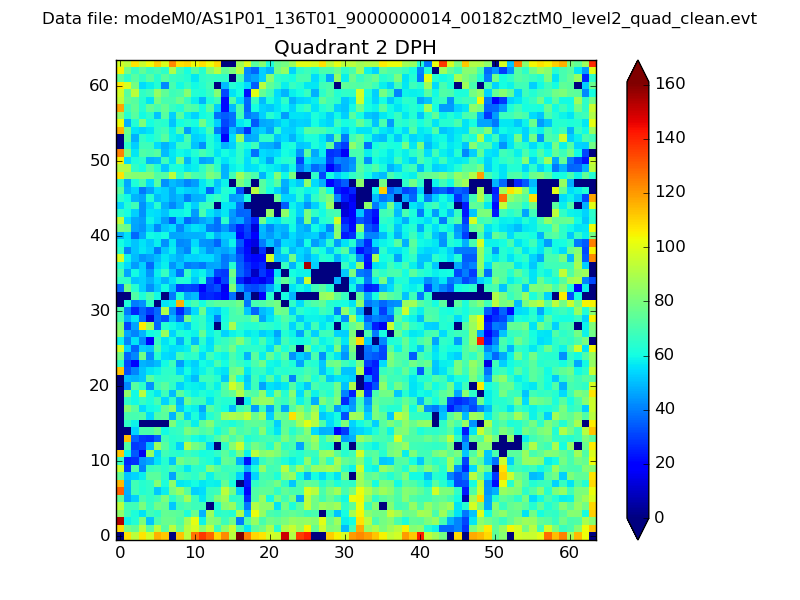
Histogram calculated using DETX and DETY for each event in the final _common_clean file
| Quadrant A | 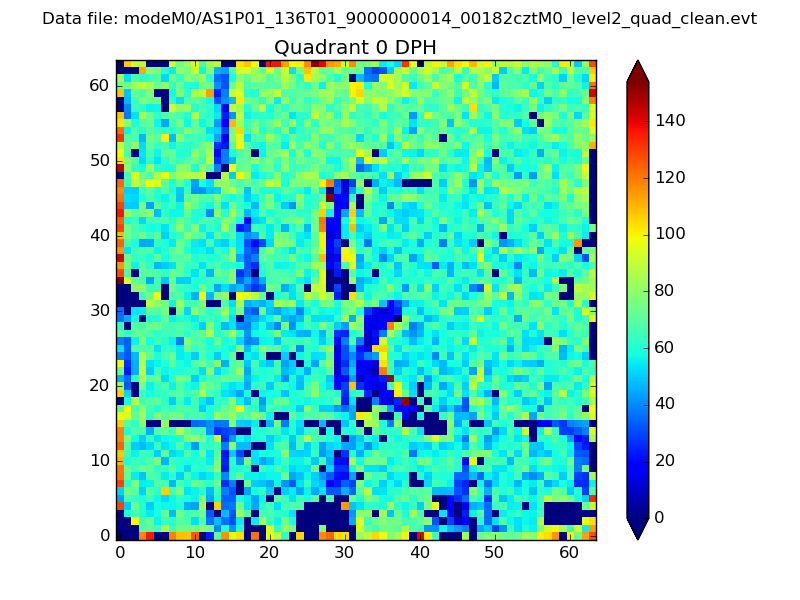 |
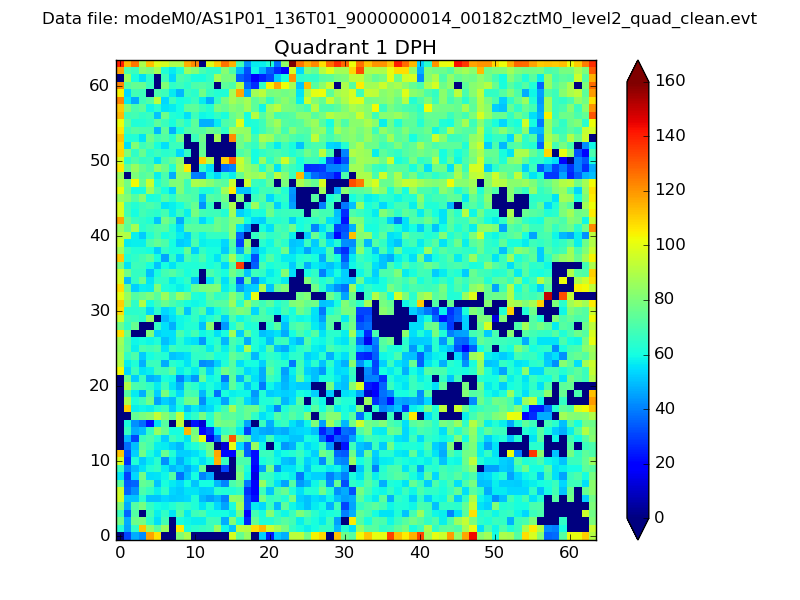 |
Quadrant B |
|---|---|---|---|
| Quadrant D | 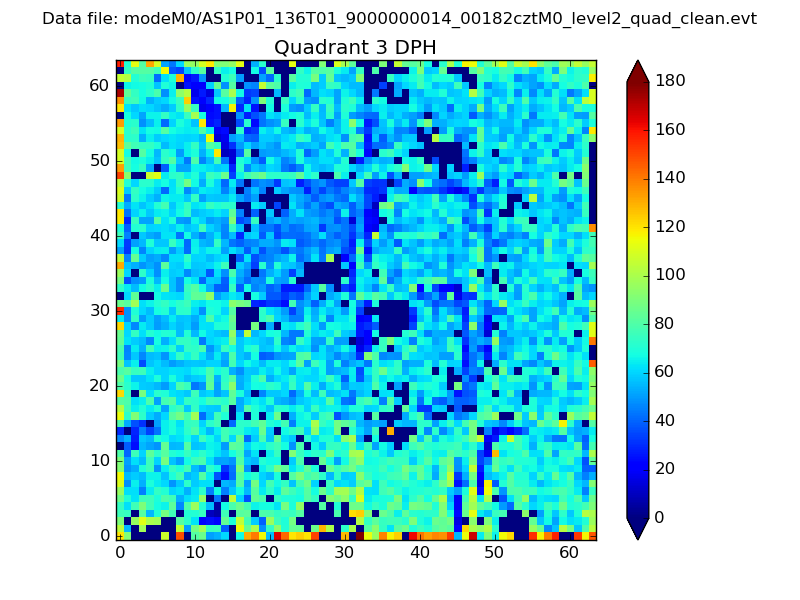 |
 |
Quadrant C |
| Plot type | Count rate plots | Images |
|---|---|---|
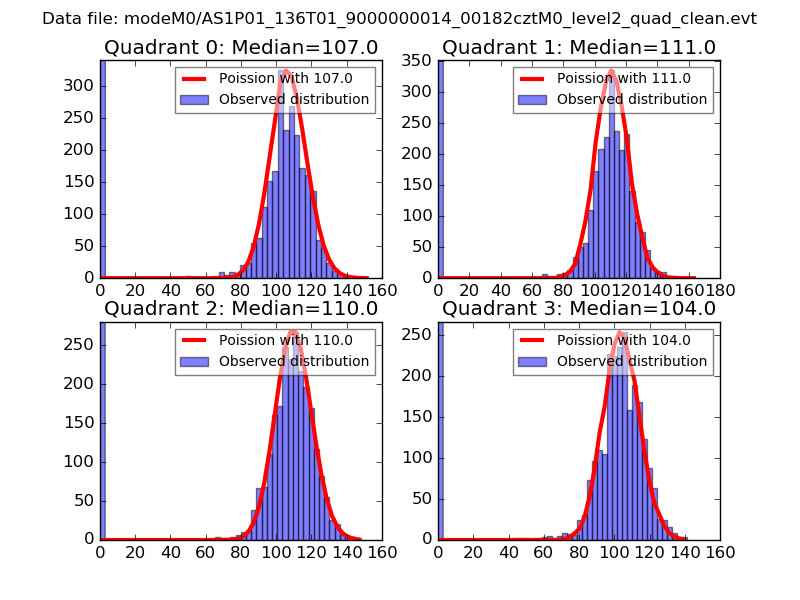
| Comparison with Poisson distribution Blue bars denote a histogram of data divided into 1 sec bins. Red curve is a Poisson curve with rate = median count rate of data. |
 |
 |
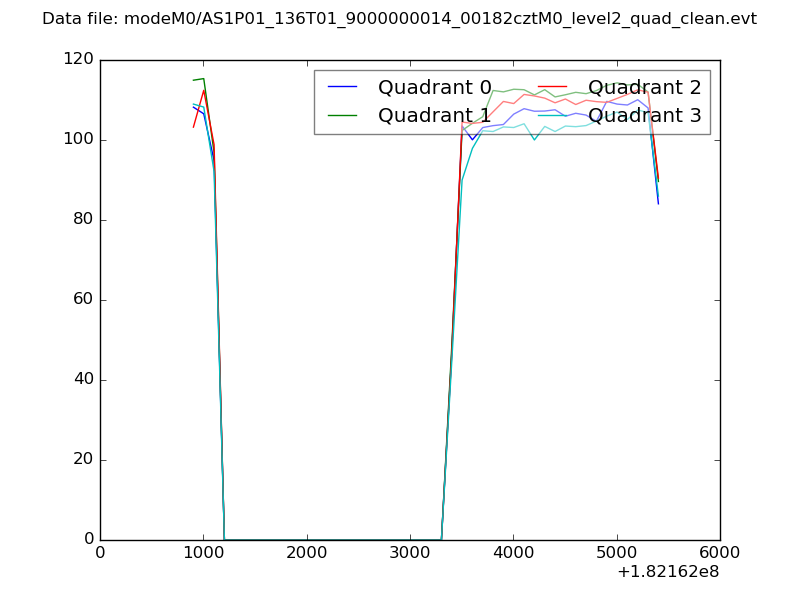
| Quadrant-wise count rates Data is divided into 100 sec bins |
 |
|
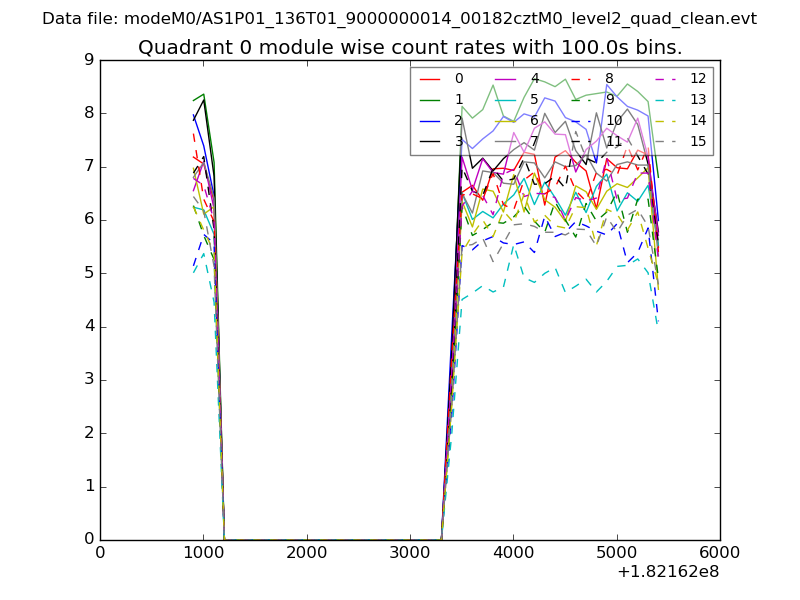
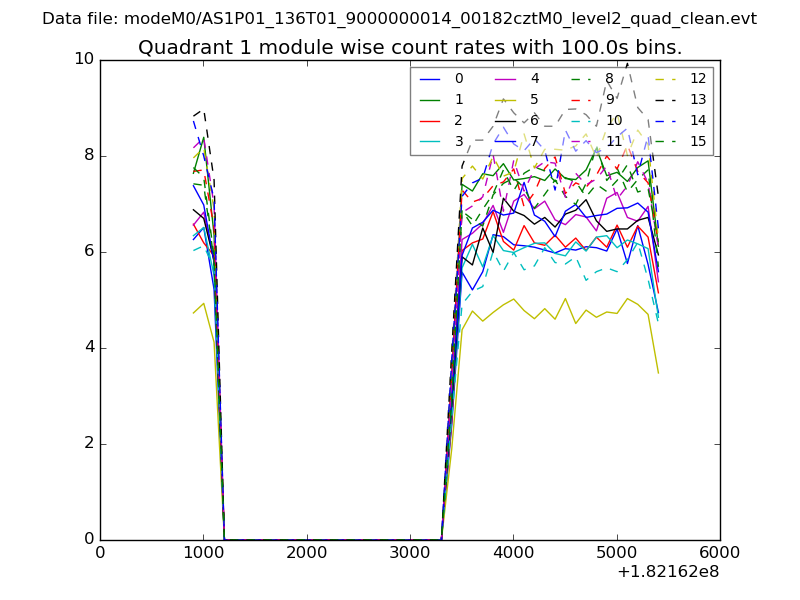
| Module-wise count rates for Quadrant A Data is divided into 100 sec bins |
 |
 |
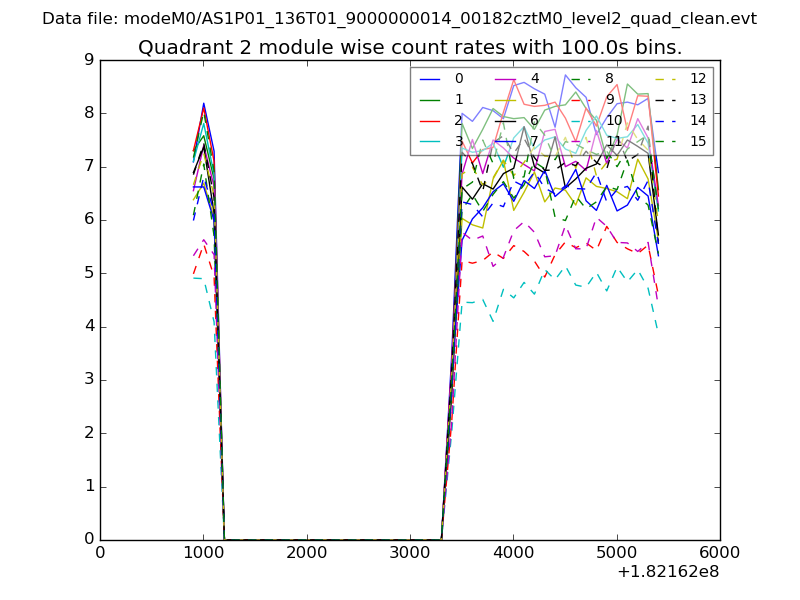
| Module-wise count rates for Quadrant B Data is divided into 100 sec bins |
 |
 |
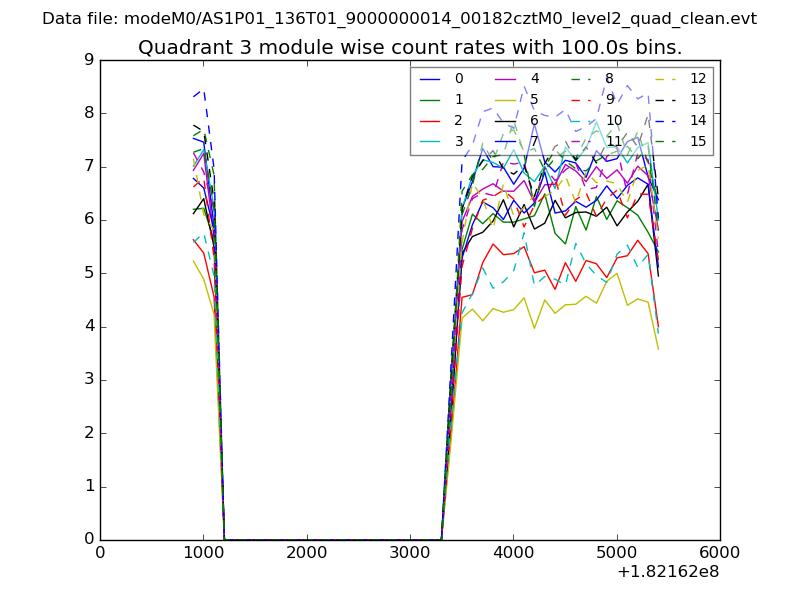
| Module-wise count rates for Quadrant C Data is divided into 100 sec bins |
 |
 |
| Module-wise count rates for Quadrant D Data is divided into 100 sec bins |
 |
 |
| Parameter | Plot |
|---|---|
| CZT HV Monitor | 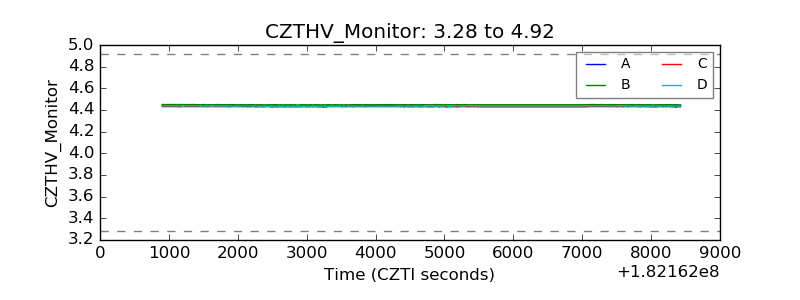 |
| D_VDD | 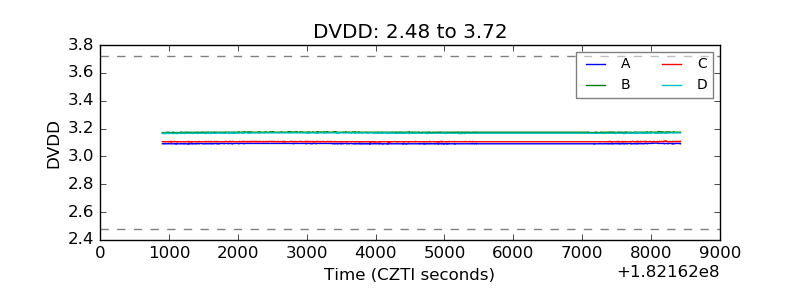 |
| Temperature 1 | 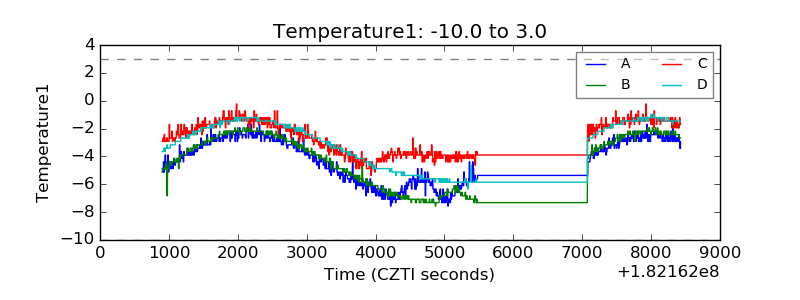 |
| Veto HV Monitor | 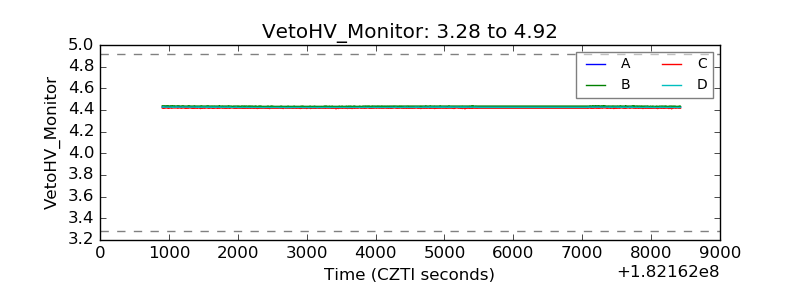 |
| Veto LLD | 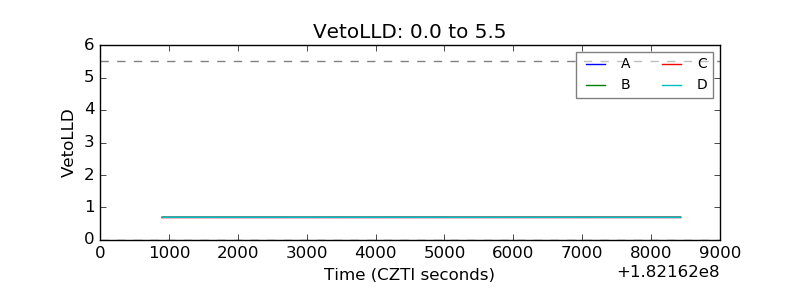 |
| Alpha Counter | 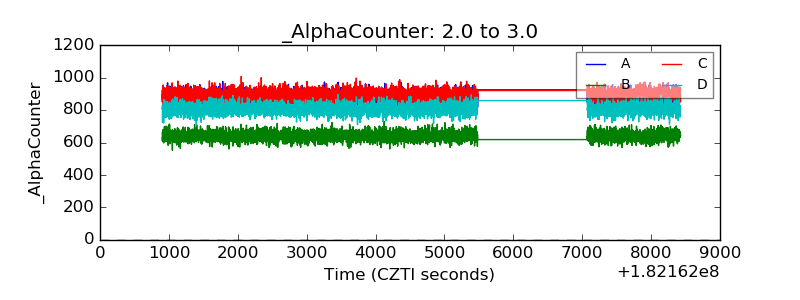 |
| _CPM_Rate | 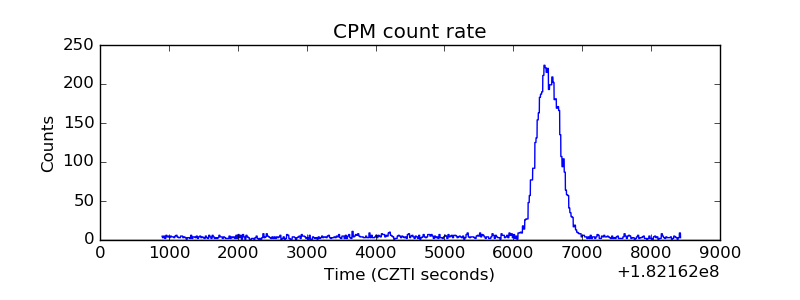 |
| CZT Counter | 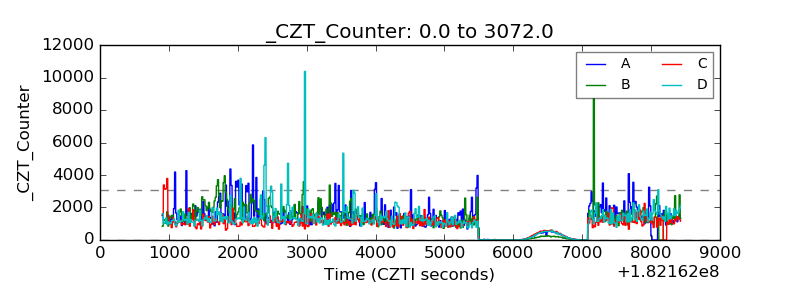 |
| +2.5 Volts monitor |  |
| +5 Volts monitor |  |
| _ROLL_ROT | 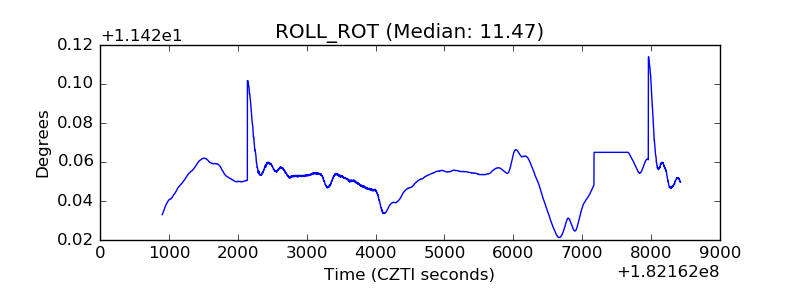 |
| _Roll_DEC |  |
| _Roll_RA | 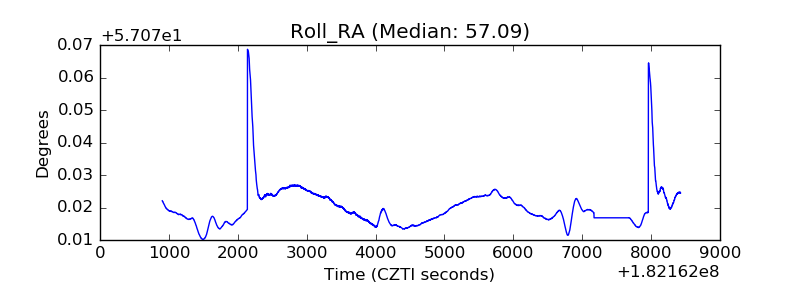 |
| Veto Counter | 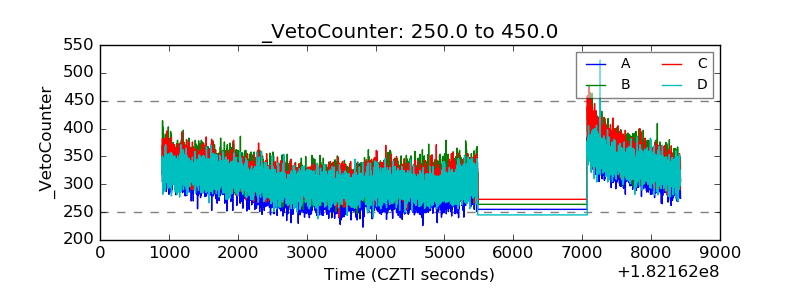 |