| Param | Original file | Final file |
|---|---|---|
| Filename | modeM0/AS1P01_136T01_9000000014_00183cztM0_level2.evt | modeM0/AS1P01_136T01_9000000014_00183cztM0_level2_quad_clean.evt |
| Size (bytes) | 858,306,240 | 46,923,840 |
| Size | 818.5 MB | 44.8 MB |
| Events in quadrant A | 6,692,138 | 261,883 |
| Events in quadrant B | 6,664,198 | 271,159 |
| Events in quadrant C | 6,082,226 | 264,583 |
| Events in quadrant D | 6,208,175 | 256,381 |
| Mode M0 | |||
|---|---|---|---|
| Quadrant | BADHDUFLAG | Total packets | Discarded packets |
| A | 0 | 23692 | 2 |
| B | 0 | 23647 | 1 |
| C | 0 | 21925 | 1 |
| D | 0 | 22268 | 1 |
| Mode M9 | |||
|---|---|---|---|
| Quadrant | BADHDUFLAG | Total packets | Discarded packets |
| A | 0 | 16 | 0 |
| B | 0 | 16 | 0 |
| C | 0 | 16 | 0 |
| D | 0 | 16 | 0 |
| Mode SS | |||
|---|---|---|---|
| Quadrant | BADHDUFLAG | Total packets | Discarded packets |
| A | 0 | 108 | 0 |
| B | 0 | 108 | 0 |
| C | 0 | 108 | 0 |
| D | 0 | 108 | 0 |
| Quadrant | Total seconds | Saturated seconds | Saturation percentage |
|---|---|---|---|
| A | 5246 | 39 | 0.743424% |
| B | 5272 | 18 | 0.341426% |
| C | 5295 | 4 | 0.075543% |
| D | 5123 | 46 | 0.897911% |
Noise dominated data is calculated using 1-second bins in cleaned event files. If a bin has >2000 counts, and if more than 50% of those come from <1% of pixels, then it is considered to be noise-dominated and hence unusable.
| Quadrant | # 1 sec bins | Bins with >0 counts | Bins with >2000 counts | High rate bins dominated by noise | Noise dominated (total time) | Noise dominated (detector-on time) | Marked lightcurve |
|---|---|---|---|---|---|---|---|
| A | 6936 | 5248 | 274 | 274 | 3.95% | 5.22% | 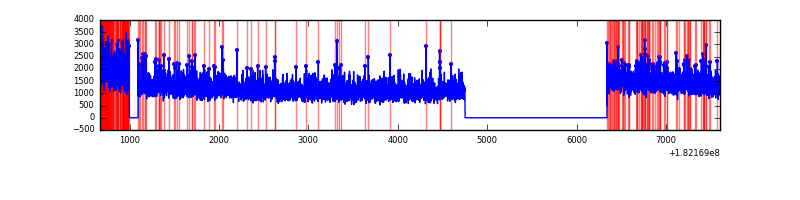 |
| B | 6936 | 5275 | 171 | 171 | 2.47% | 3.24% | 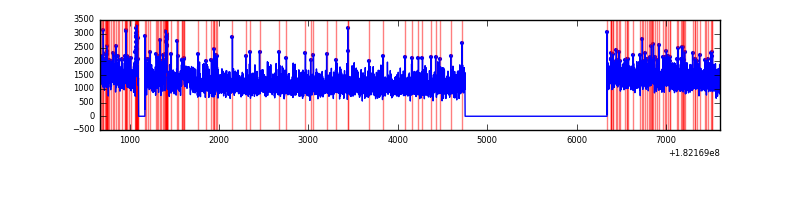 |
| C | 6936 | 5298 | 53 | 53 | 0.76% | 1.00% | 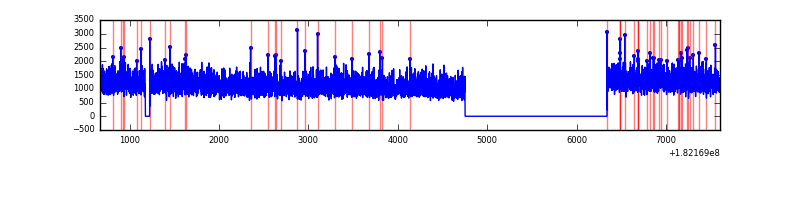 |
| D | 6936 | 5126 | 215 | 215 | 3.10% | 4.19% | 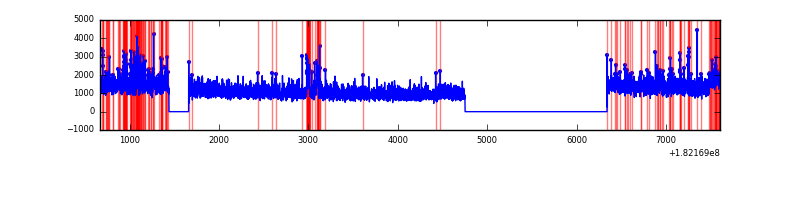 |
Top three noisy pixels from each quadrant. If the there are fewer than three noisy pixels in the level2.evt file, extra rows are filled as -1
| Pixel properties | Quadrant properties | ||||||
|---|---|---|---|---|---|---|---|
| Quadrant | DetID | PixID | Counts | Sigma | Mean | Median | Sigma |
| A | 7 | 128 | 131083 | 347.31 | 1666 | 1647 | 372.7 |
| A | 14 | 10 | 59335 | 154.79 | 1666 | 1647 | 372.7 |
| A | 0 | 253 | 13717 | 32.39 | 1666 | 1647 | 372.7 |
| B | 10 | 199 | 70192 | 174.36 | 1670 | 1680 | 392.9 |
| B | 3 | 204 | 55587 | 137.19 | 1670 | 1680 | 392.9 |
| B | 0 | 247 | 27496 | 65.7 | 1670 | 1680 | 392.9 |
| C | 0 | 188 | 24479 | 53.01 | 1532 | 1588 | 431.8 |
| C | 0 | 202 | 12701 | 25.74 | 1532 | 1588 | 431.8 |
| C | 10 | 33 | 8164 | 15.23 | 1532 | 1588 | 431.8 |
| D | 13 | 89 | 153972 | 335.33 | 1475 | 1523 | 454.6 |
| D | 12 | 249 | 58865 | 126.13 | 1475 | 1523 | 454.6 |
| D | 12 | 14 | 58047 | 124.33 | 1475 | 1523 | 454.6 |
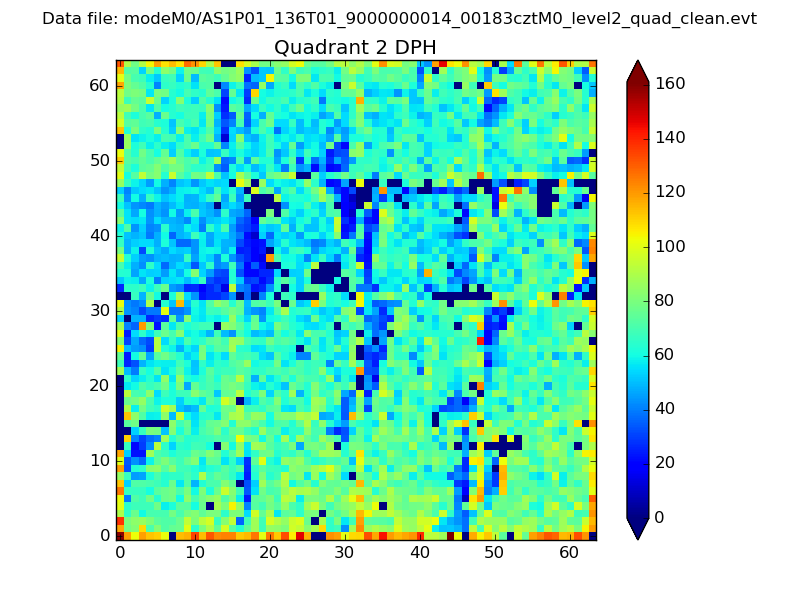
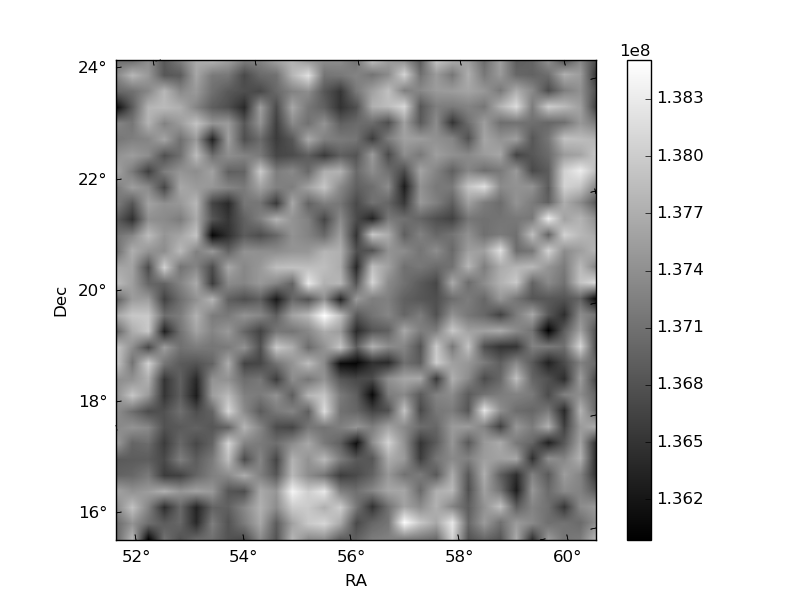
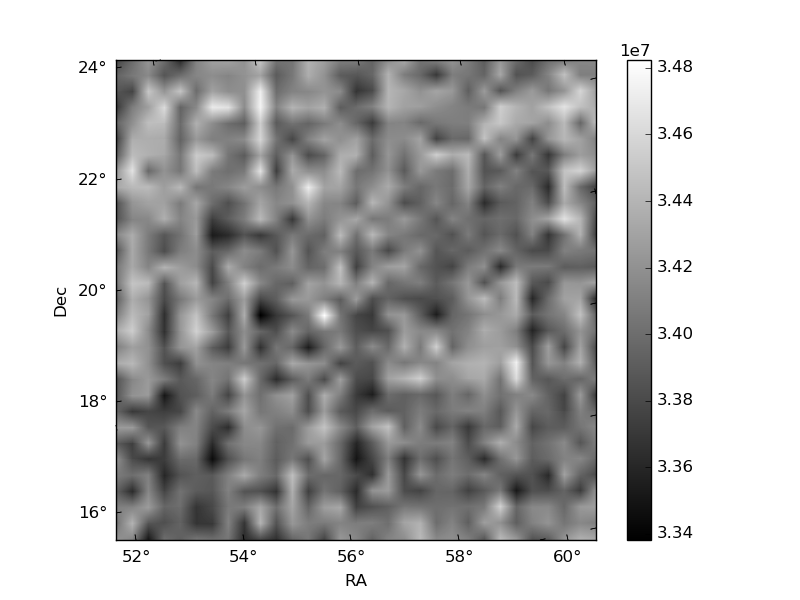
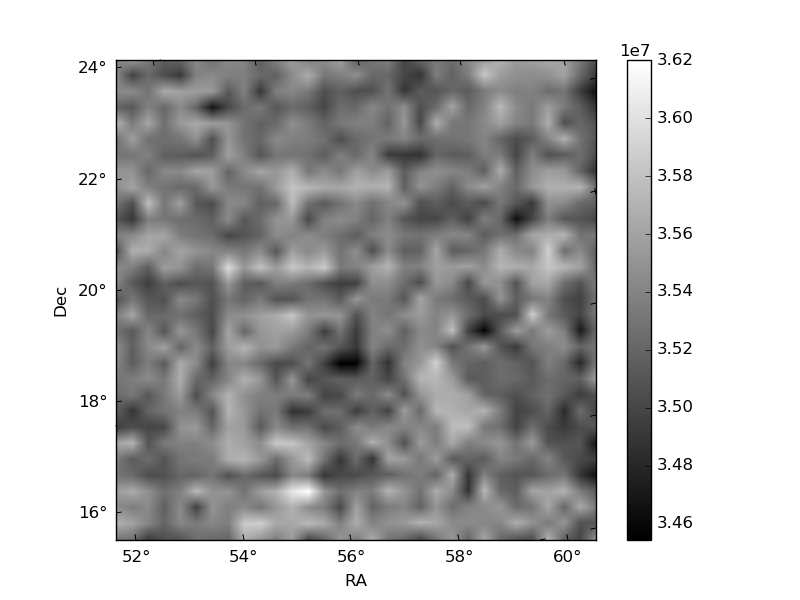
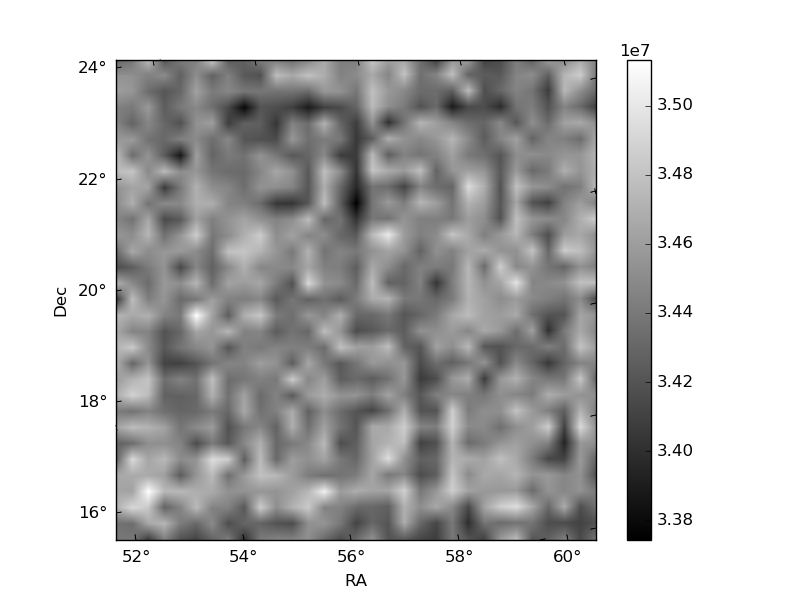
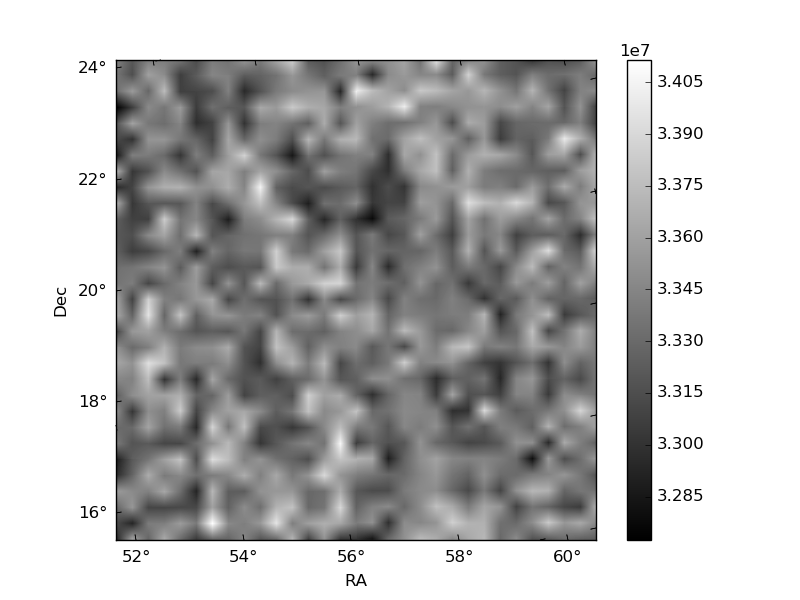
Histogram calculated using DETX and DETY for each event in the final _common_clean file
| Quadrant A | 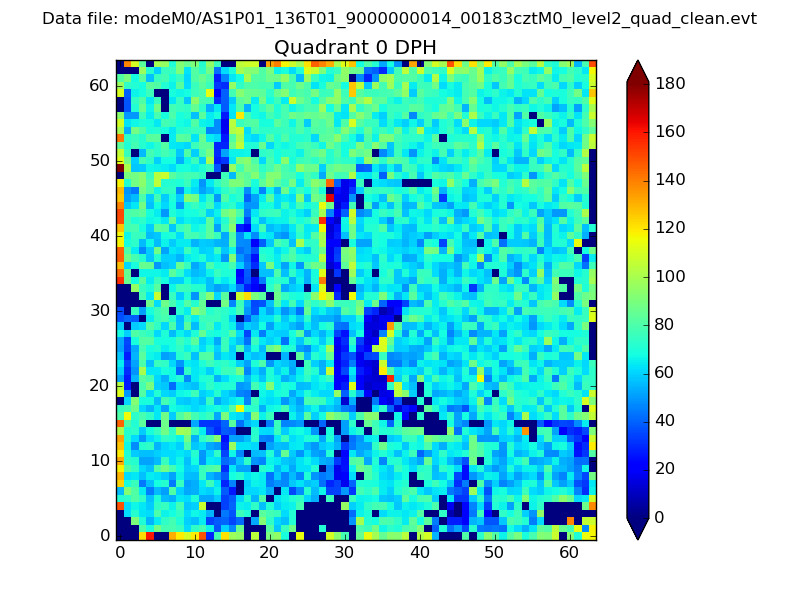 |
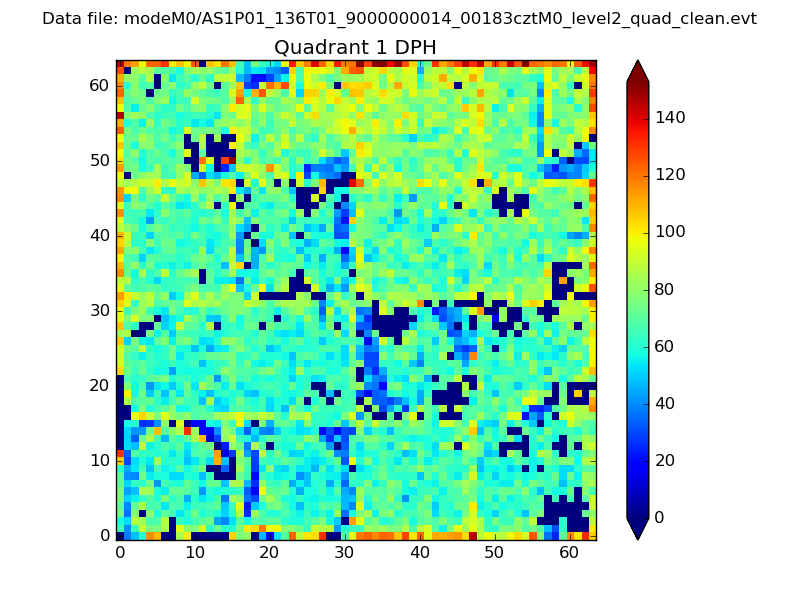 |
Quadrant B |
|---|---|---|---|
| Quadrant D | 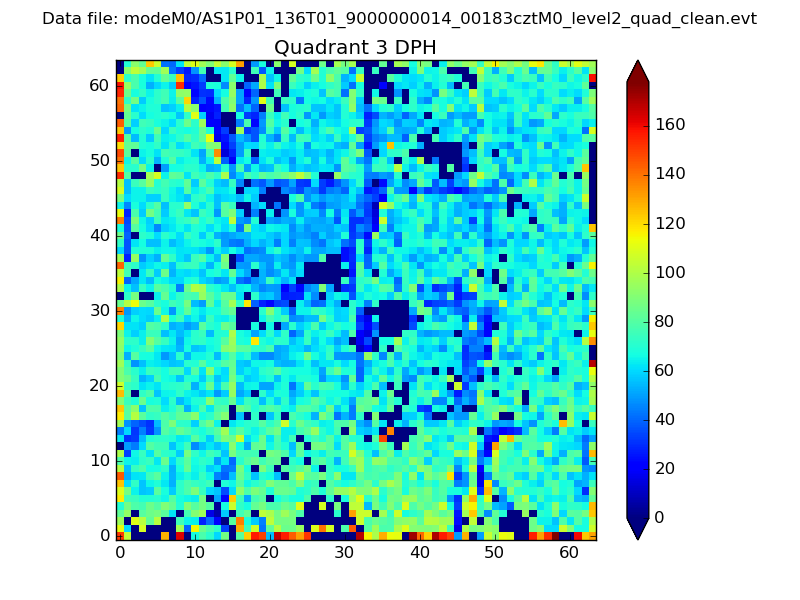 |
 |
Quadrant C |
| Plot type | Count rate plots | Images |
|---|---|---|
| Comparison with Poisson distribution Blue bars denote a histogram of data divided into 1 sec bins. Red curve is a Poisson curve with rate = median count rate of data. |
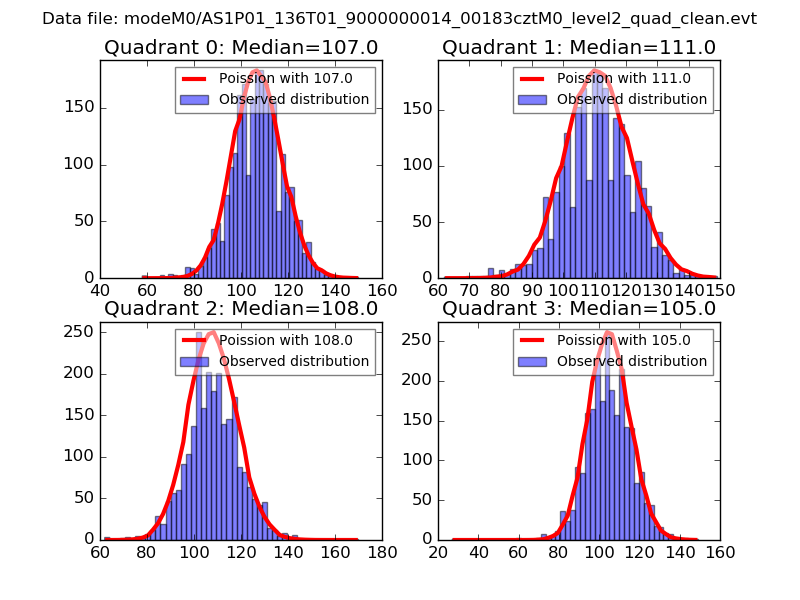 |
 |
| Quadrant-wise count rates Data is divided into 100 sec bins |
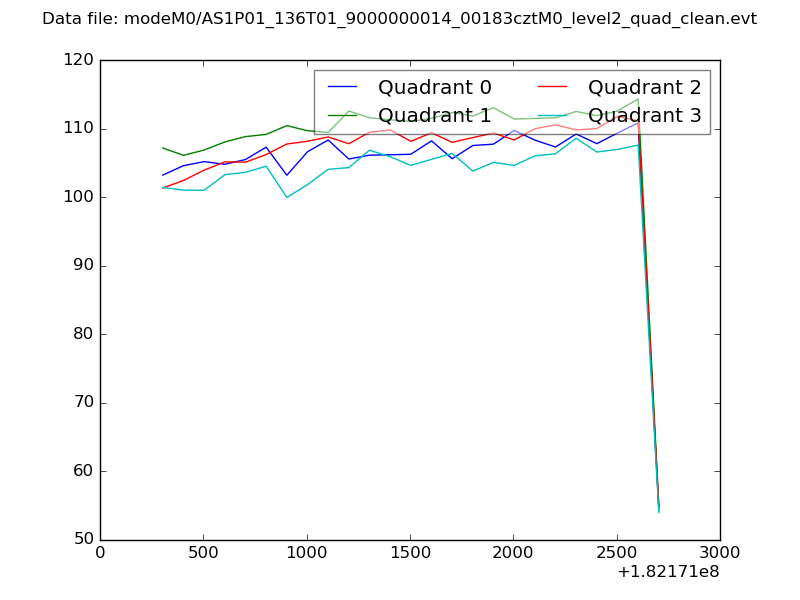 |
|
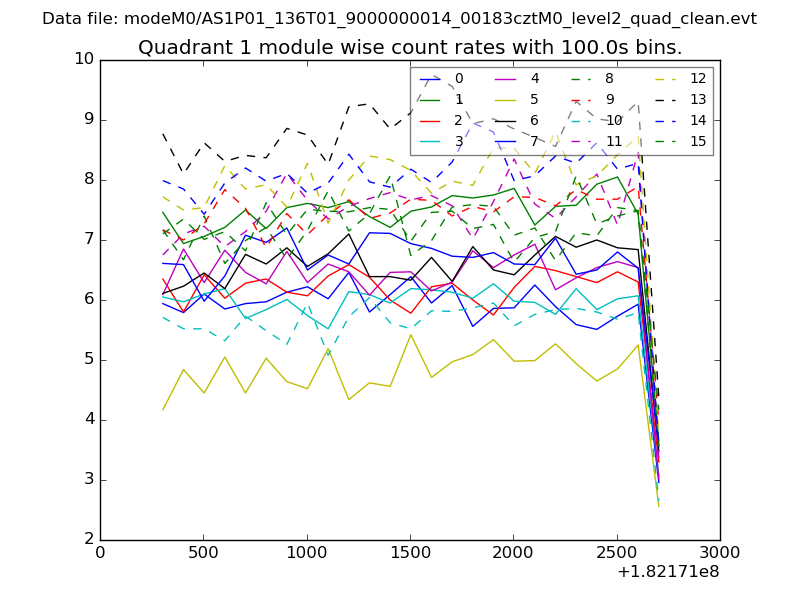
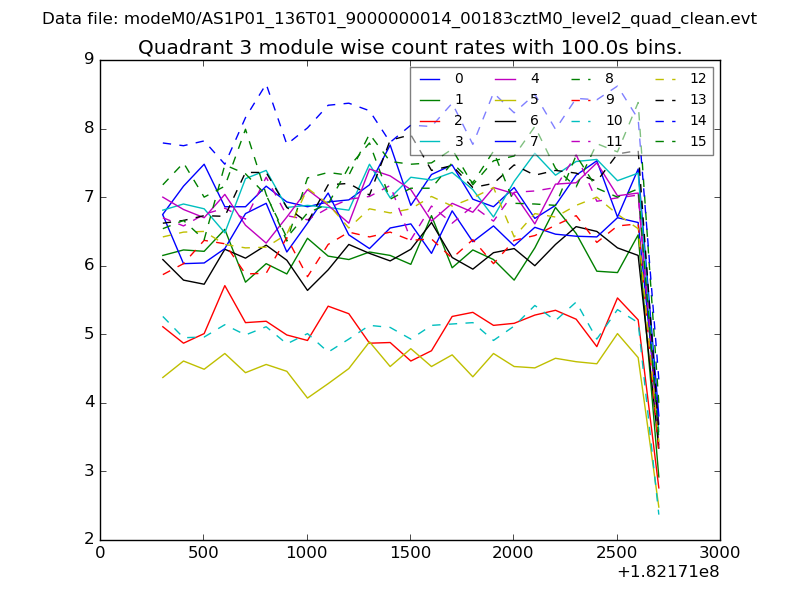
| Module-wise count rates for Quadrant A Data is divided into 100 sec bins |
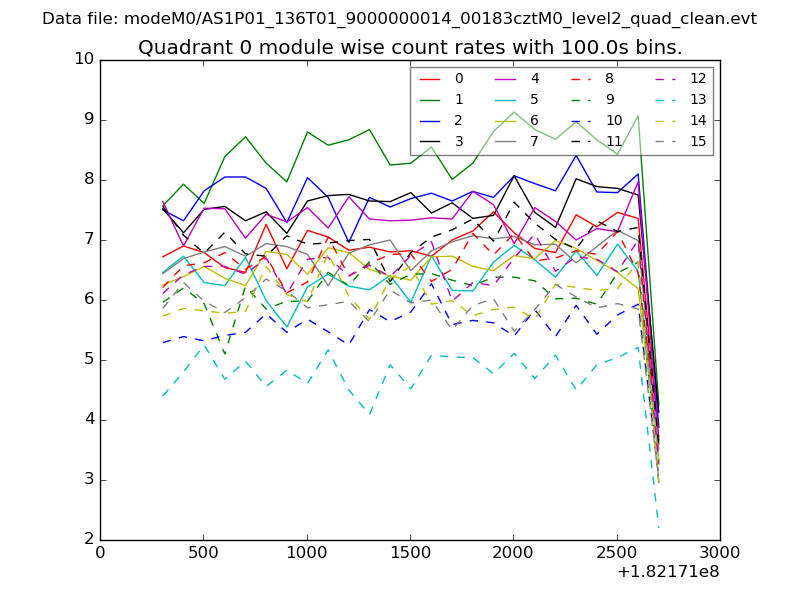 |
 |
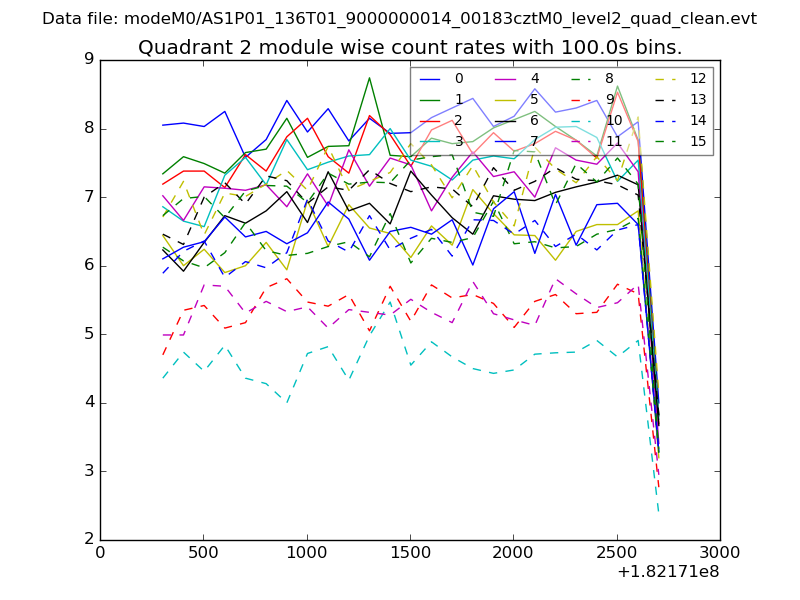
| Module-wise count rates for Quadrant B Data is divided into 100 sec bins |
 |
 |
| Module-wise count rates for Quadrant C Data is divided into 100 sec bins |
 |
 |
| Module-wise count rates for Quadrant D Data is divided into 100 sec bins |
 |
 |
| Parameter | Plot |
|---|---|
| CZT HV Monitor | 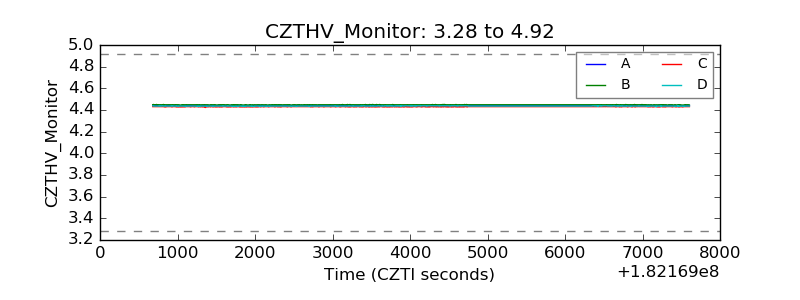 |
| D_VDD | 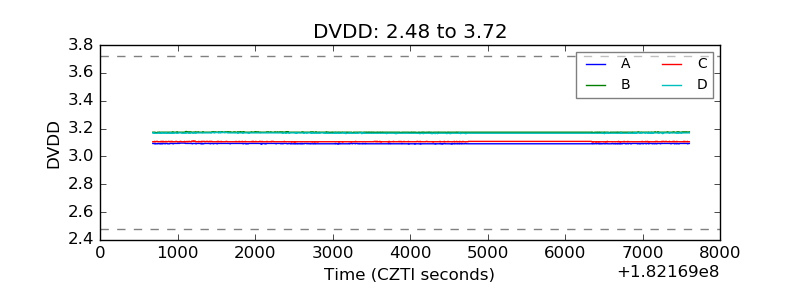 |
| Temperature 1 | 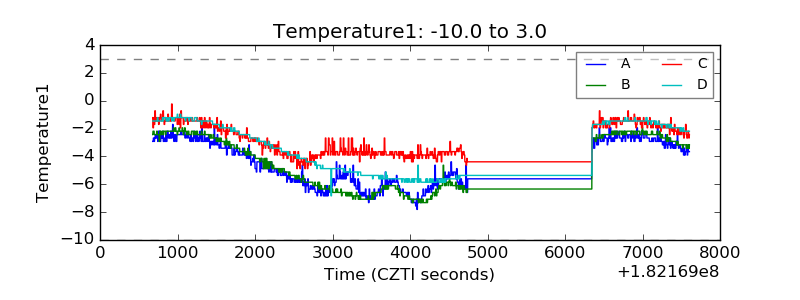 |
| Veto HV Monitor | 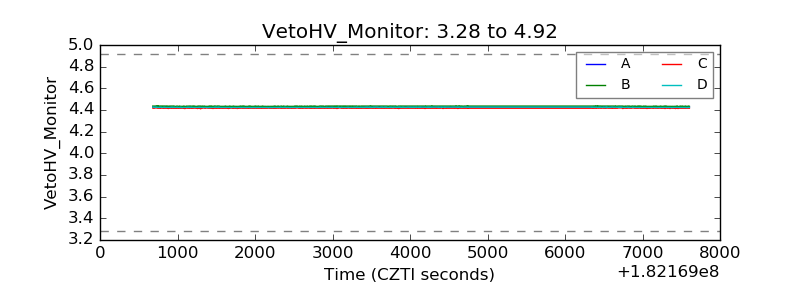 |
| Veto LLD | 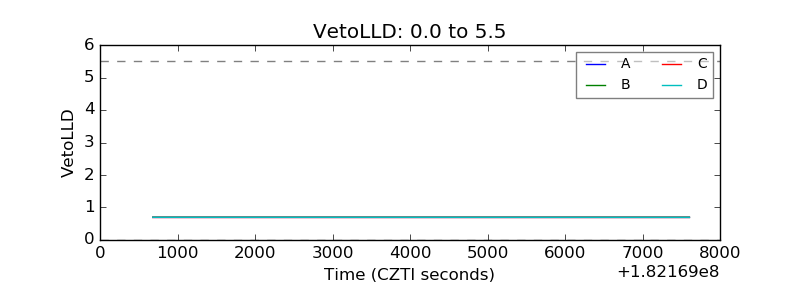 |
| Alpha Counter | 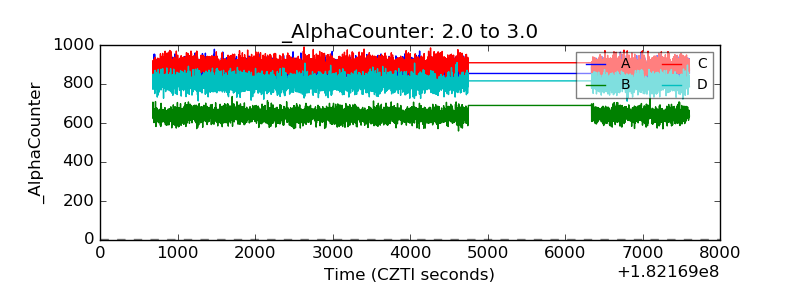 |
| _CPM_Rate | 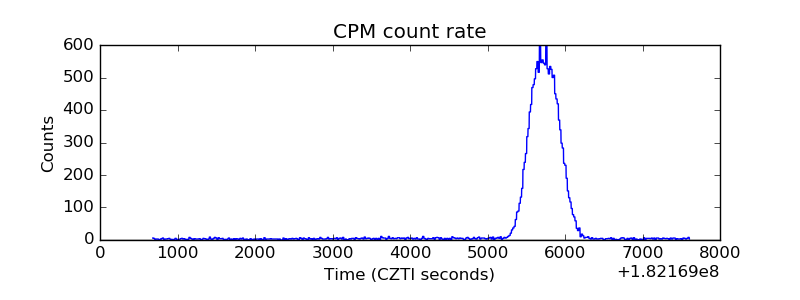 |
| CZT Counter | 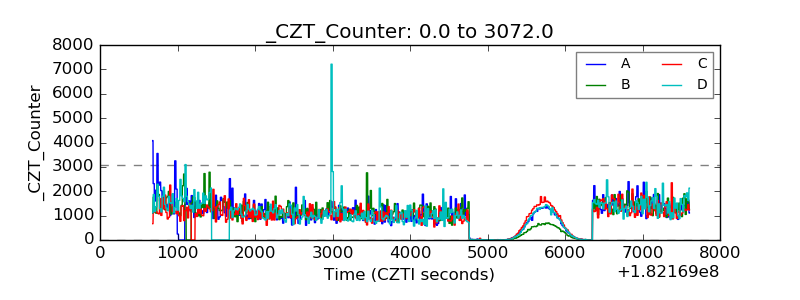 |
| +2.5 Volts monitor |  |
| +5 Volts monitor |  |
| _ROLL_ROT | 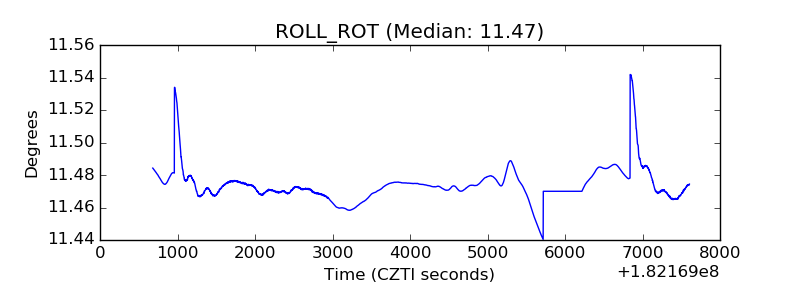 |
| _Roll_DEC | 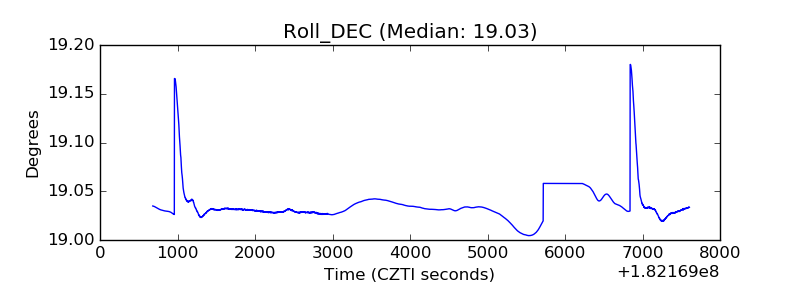 |
| _Roll_RA | 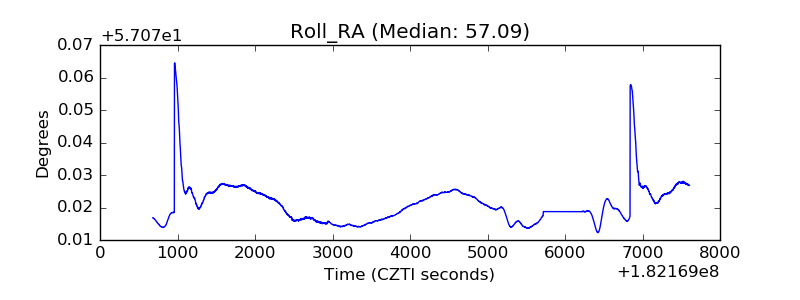 |
| Veto Counter | 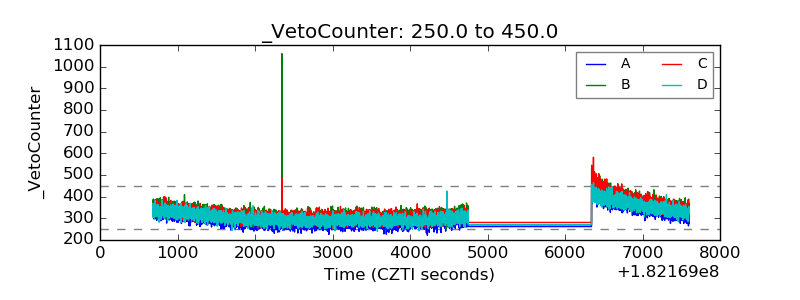 |