| Param | Original file | Final file |
|---|---|---|
| Filename | modeM0/AS1P01_136T01_9000000014_00184cztM0_level2.evt | modeM0/AS1P01_136T01_9000000014_00184cztM0_level2_quad_clean.evt |
| Size (bytes) | 1,069,706,880 | 54,000,000 |
| Size | 1020.2 MB | 51.5 MB |
| Events in quadrant A | 7,412,672 | 309,826 |
| Events in quadrant B | 7,342,330 | 320,911 |
| Events in quadrant C | 6,879,002 | 312,531 |
| Events in quadrant D | 10,372,262 | 279,437 |
| Mode M0 | |||
|---|---|---|---|
| Quadrant | BADHDUFLAG | Total packets | Discarded packets |
| A | 0 | 26186 | 3 |
| B | 0 | 26000 | 2 |
| C | 0 | 24654 | 2 |
| D | 0 | 35209 | 2 |
| Mode M9 | |||
|---|---|---|---|
| Quadrant | BADHDUFLAG | Total packets | Discarded packets |
| A | 0 | 16 | 0 |
| B | 0 | 16 | 0 |
| C | 0 | 16 | 0 |
| D | 0 | 17 | 0 |
| Mode SS | |||
|---|---|---|---|
| Quadrant | BADHDUFLAG | Total packets | Discarded packets |
| A | 0 | 120 | 0 |
| B | 0 | 120 | 0 |
| C | 0 | 120 | 0 |
| D | 0 | 120 | 0 |
| Quadrant | Total seconds | Saturated seconds | Saturation percentage |
|---|---|---|---|
| A | 5891 | 6 | 0.101850% |
| B | 5891 | 6 | 0.101850% |
| C | 5891 | 18 | 0.305551% |
| D | 5891 | 1361 | 23.103039% |
Noise dominated data is calculated using 1-second bins in cleaned event files. If a bin has >2000 counts, and if more than 50% of those come from <1% of pixels, then it is considered to be noise-dominated and hence unusable.
| Quadrant | # 1 sec bins | Bins with >0 counts | Bins with >2000 counts | High rate bins dominated by noise | Noise dominated (total time) | Noise dominated (detector-on time) | Marked lightcurve |
|---|---|---|---|---|---|---|---|
| A | 7482 | 5893 | 230 | 230 | 3.07% | 3.90% | 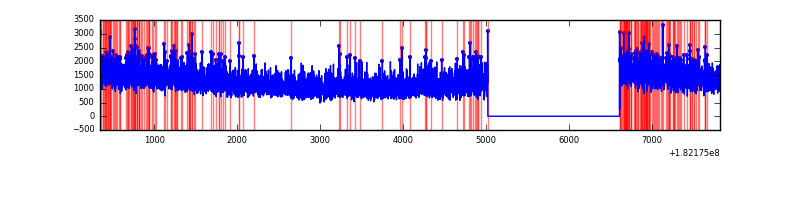 |
| B | 7482 | 5893 | 168 | 168 | 2.25% | 2.85% | 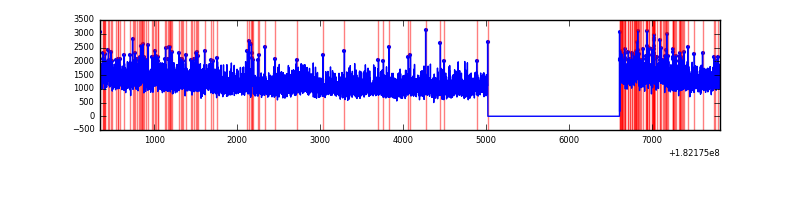 |
| C | 7482 | 5893 | 107 | 107 | 1.43% | 1.82% | 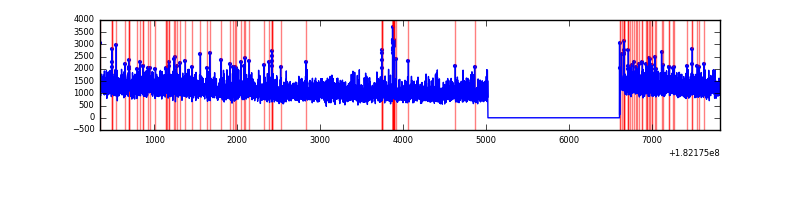 |
| D | 7482 | 5893 | 1877 | 1877 | 25.09% | 31.85% | 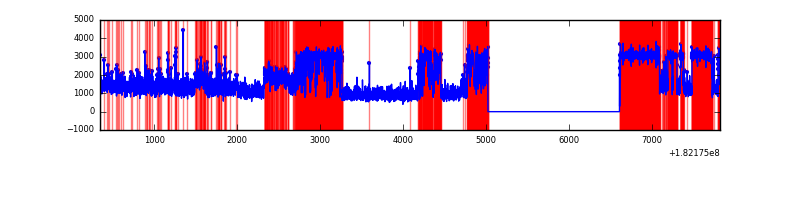 |
Top three noisy pixels from each quadrant. If the there are fewer than three noisy pixels in the level2.evt file, extra rows are filled as -1
| Pixel properties | Quadrant properties | ||||||
|---|---|---|---|---|---|---|---|
| Quadrant | DetID | PixID | Counts | Sigma | Mean | Median | Sigma |
| A | 5 | 244 | 30394 | 68.67 | 1889 | 1869 | 415.4 |
| A | 14 | 233 | 14524 | 30.47 | 1889 | 1869 | 415.4 |
| A | 0 | 253 | 14220 | 29.73 | 1889 | 1869 | 415.4 |
| B | 5 | 85 | 60099 | 131.7 | 1886 | 1897 | 441.9 |
| B | 8 | 5 | 21020 | 43.27 | 1886 | 1897 | 441.9 |
| B | 0 | 217 | 12874 | 24.84 | 1886 | 1897 | 441.9 |
| C | 9 | 128 | 47243 | 94.63 | 1723 | 1786 | 480.4 |
| C | 0 | 202 | 14204 | 25.85 | 1723 | 1786 | 480.4 |
| C | 0 | 188 | 12497 | 22.3 | 1723 | 1786 | 480.4 |
| D | 12 | 249 | 4151649 | 8898.58 | 1542 | 1591 | 466.4 |
| D | 4 | 114 | 88396 | 186.13 | 1542 | 1591 | 466.4 |
| D | 13 | 6 | 39947 | 82.24 | 1542 | 1591 | 466.4 |
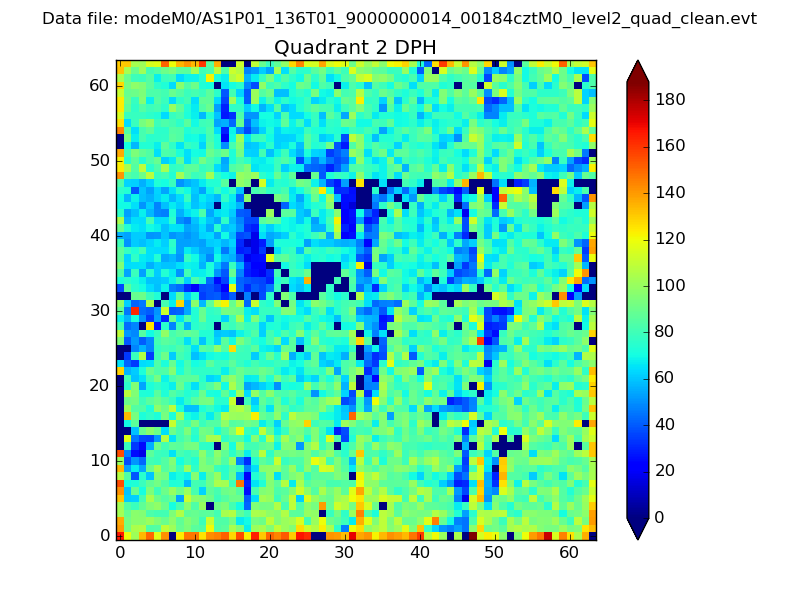
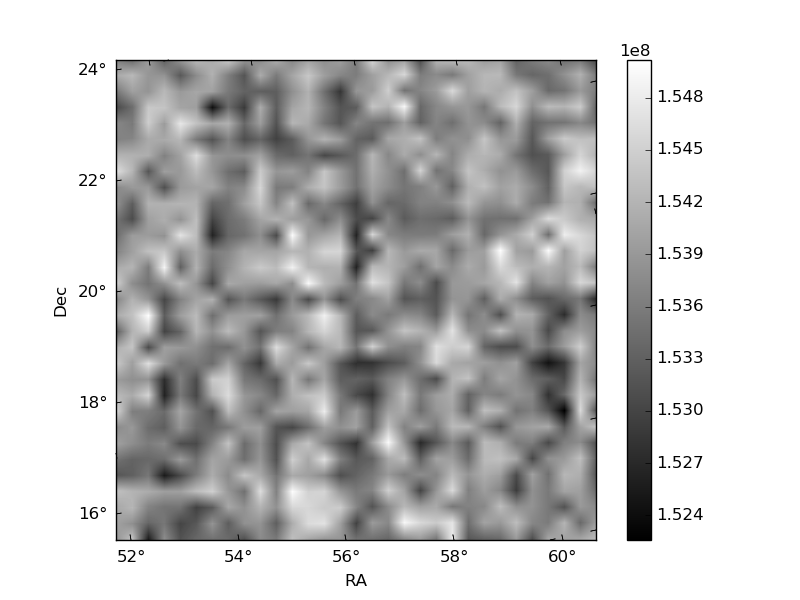
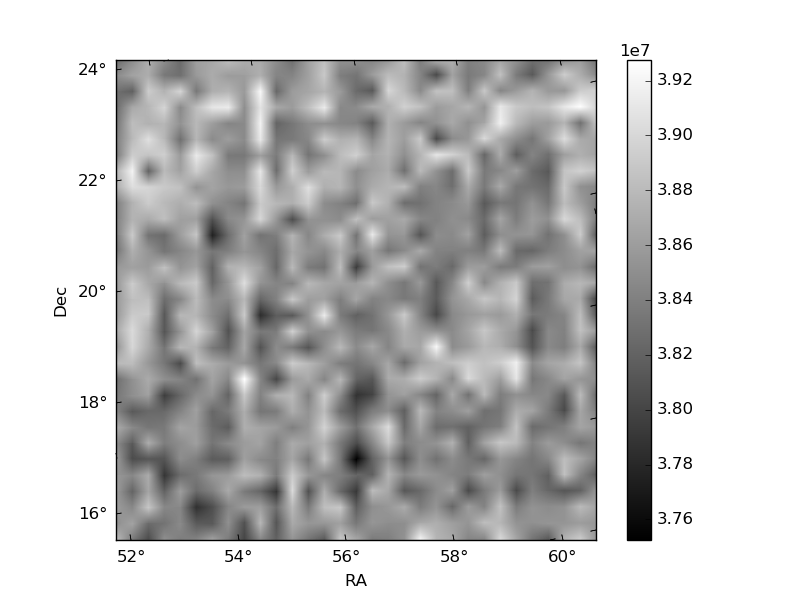
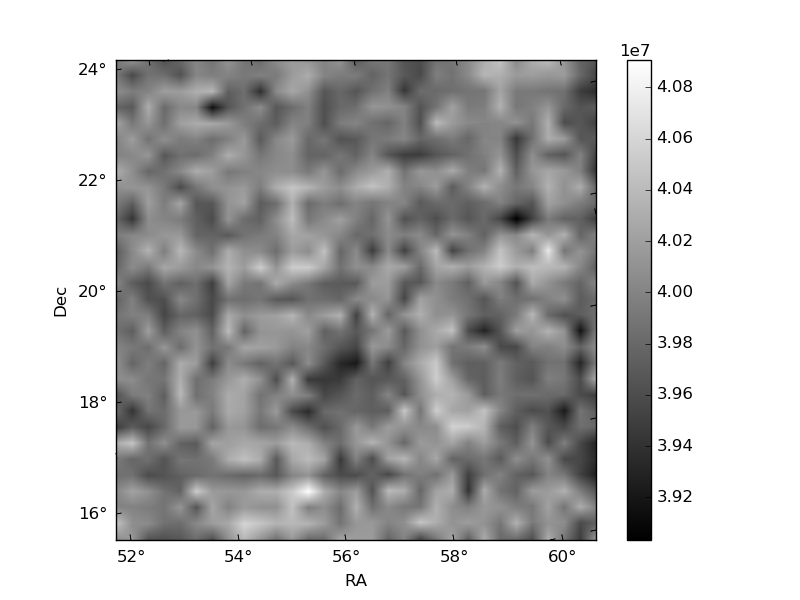
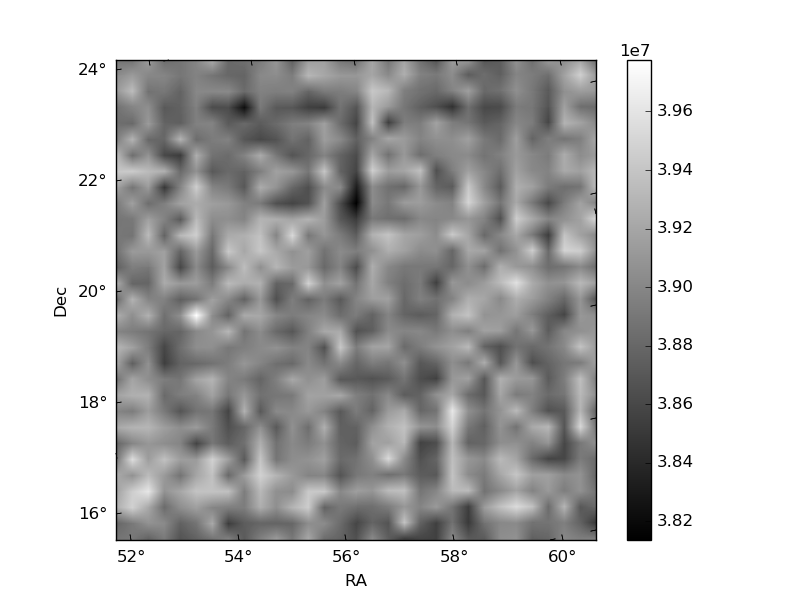
Histogram calculated using DETX and DETY for each event in the final _common_clean file
| Quadrant A | 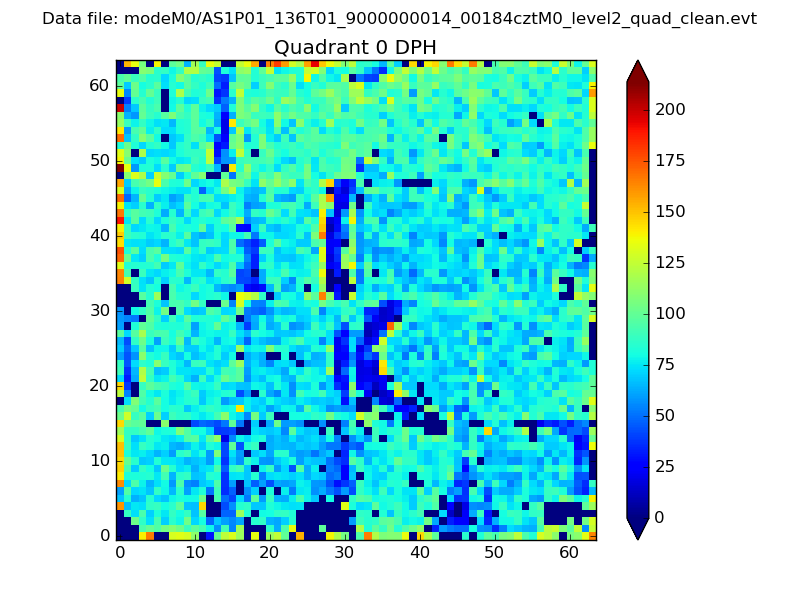 |
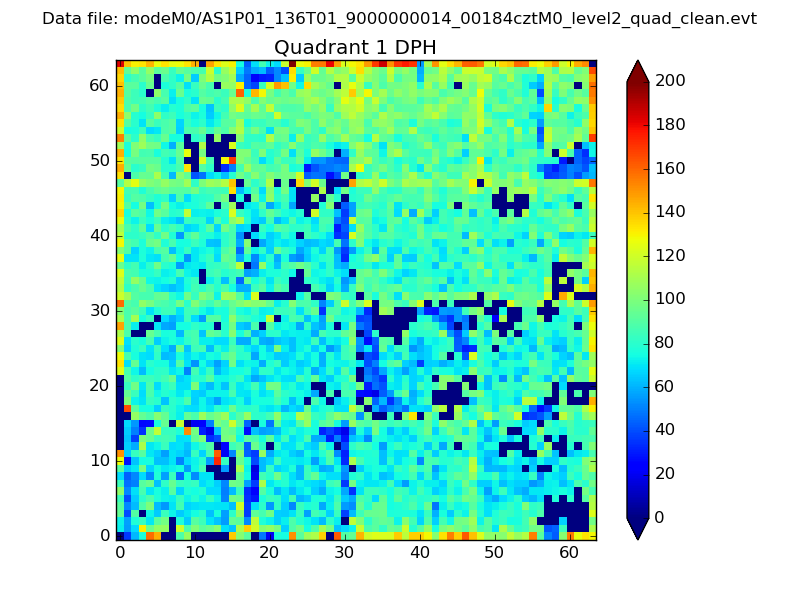 |
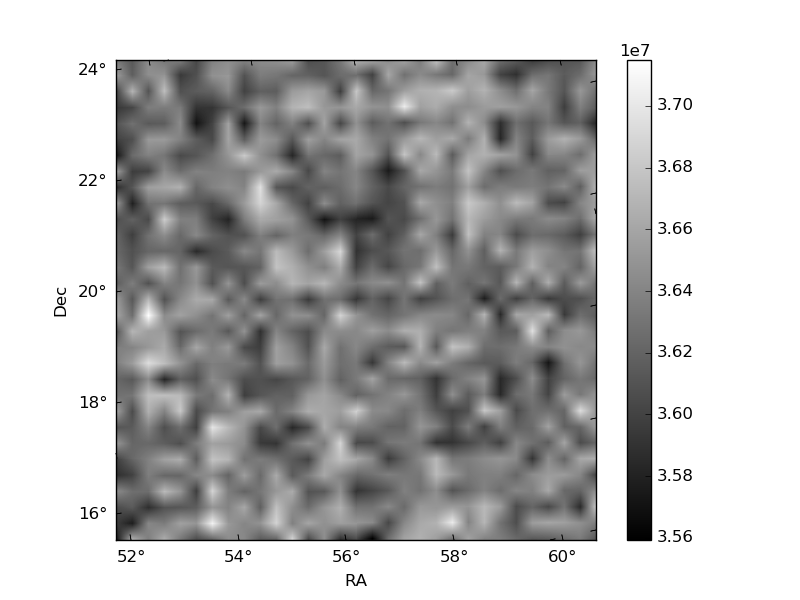
Quadrant B |
|---|---|---|---|
| Quadrant D | 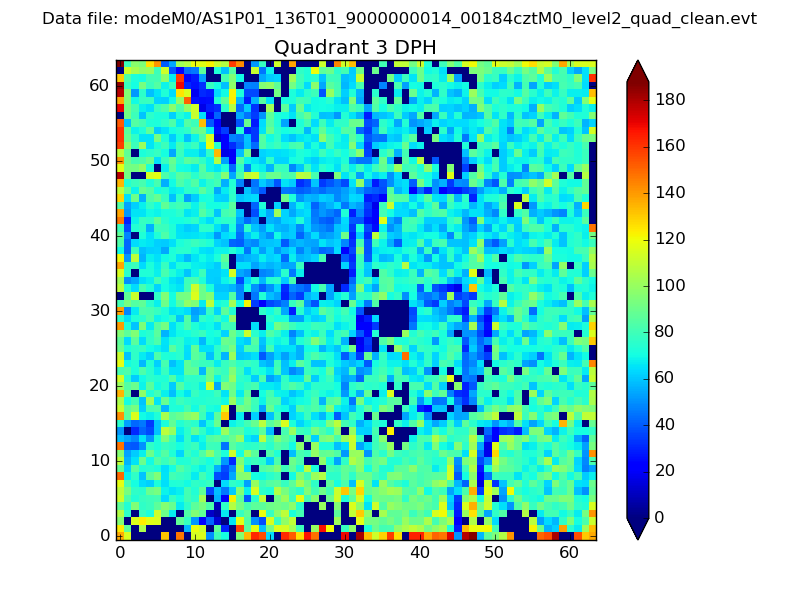 |
 |
Quadrant C |
| Plot type | Count rate plots | Images |
|---|---|---|
| Comparison with Poisson distribution Blue bars denote a histogram of data divided into 1 sec bins. Red curve is a Poisson curve with rate = median count rate of data. |
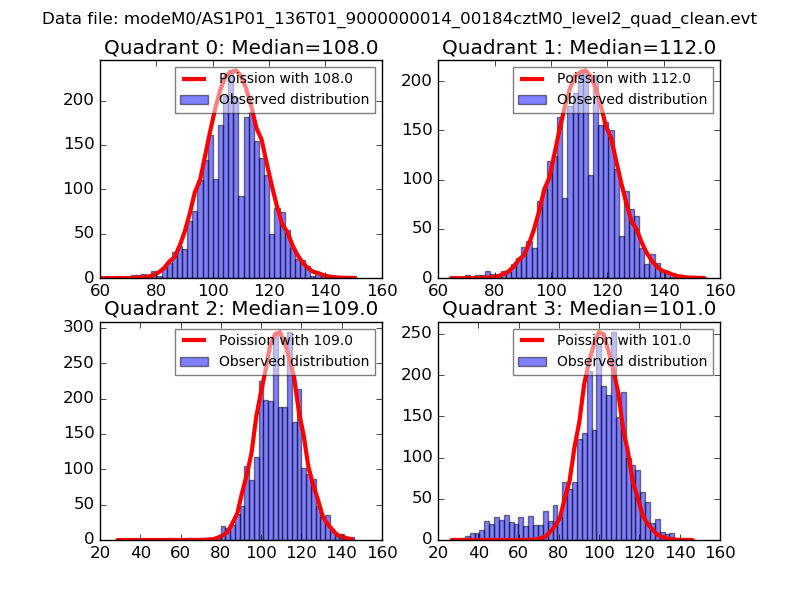 |
 |
| Quadrant-wise count rates Data is divided into 100 sec bins |
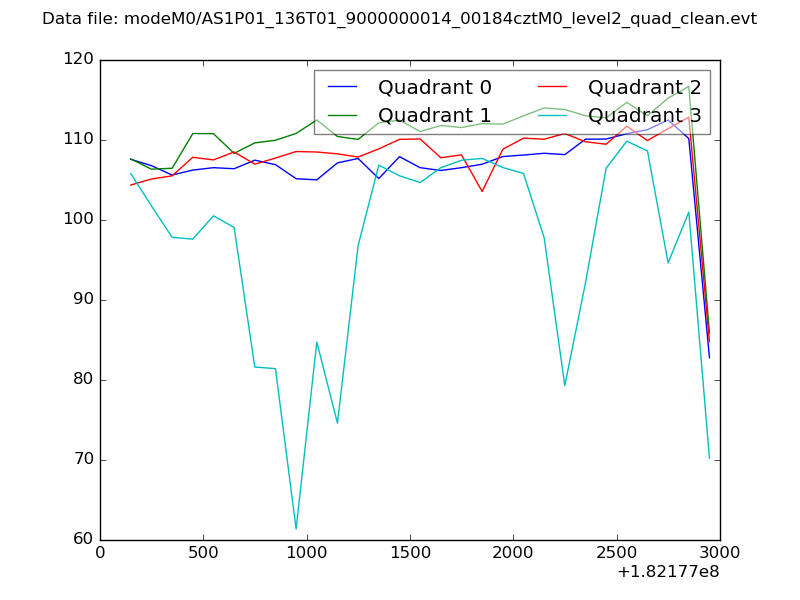 |
|
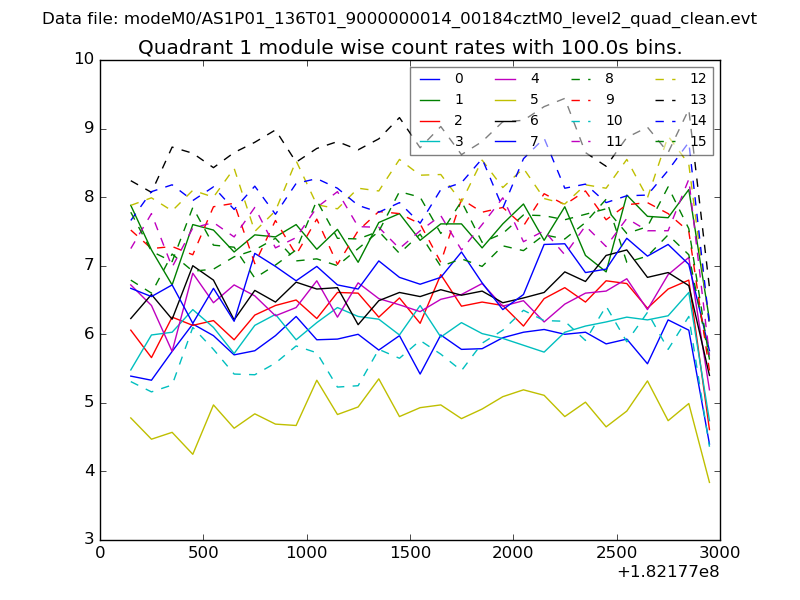
| Module-wise count rates for Quadrant A Data is divided into 100 sec bins |
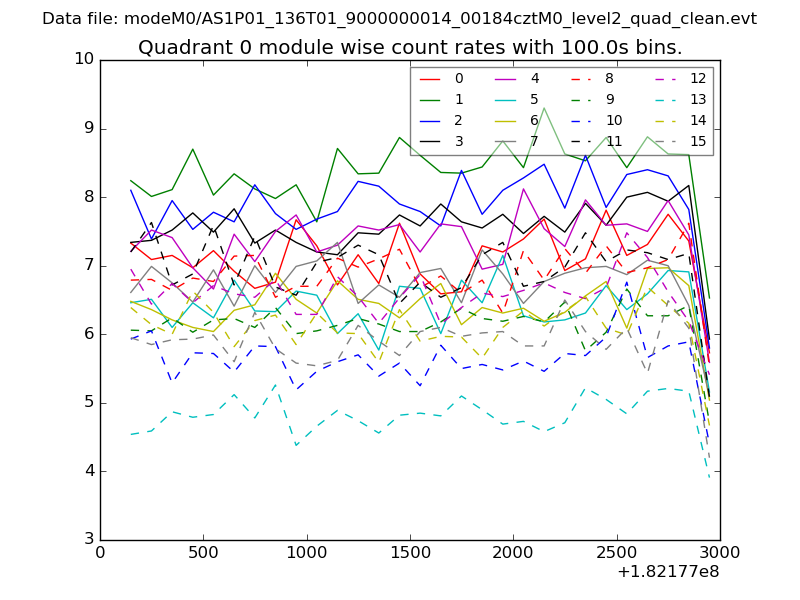 |
 |
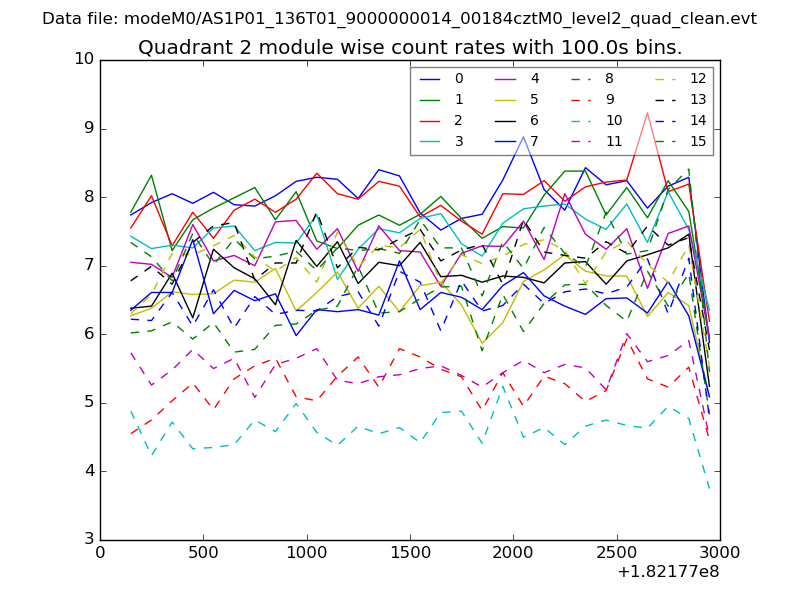
| Module-wise count rates for Quadrant B Data is divided into 100 sec bins |
 |
 |
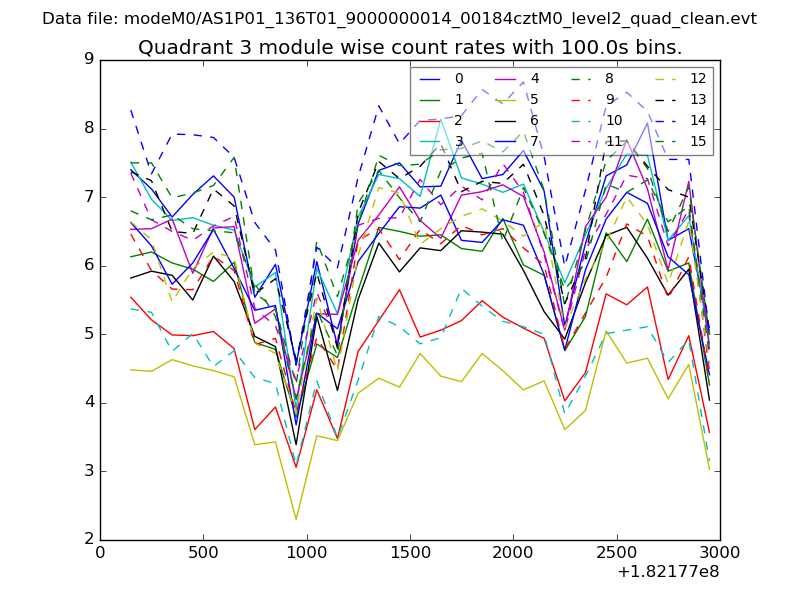
| Module-wise count rates for Quadrant C Data is divided into 100 sec bins |
 |
 |
| Module-wise count rates for Quadrant D Data is divided into 100 sec bins |
 |
 |
| Parameter | Plot |
|---|---|
| CZT HV Monitor | 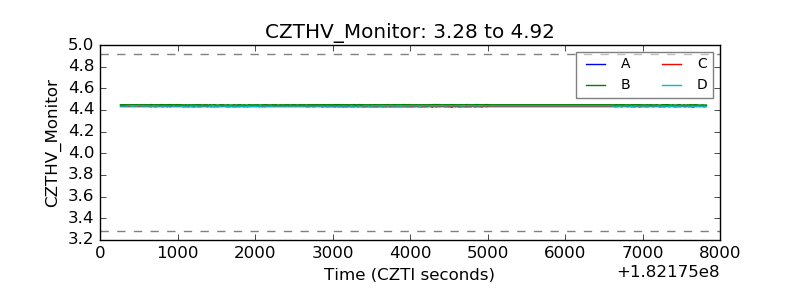 |
| D_VDD | 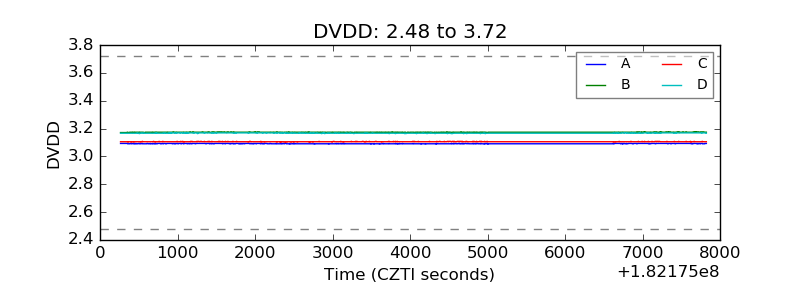 |
| Temperature 1 |  |
| Veto HV Monitor | 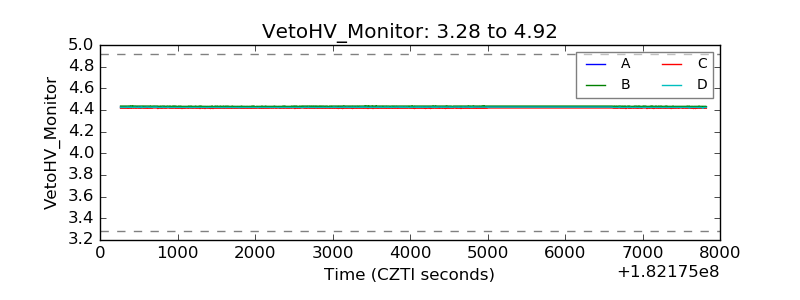 |
| Veto LLD | 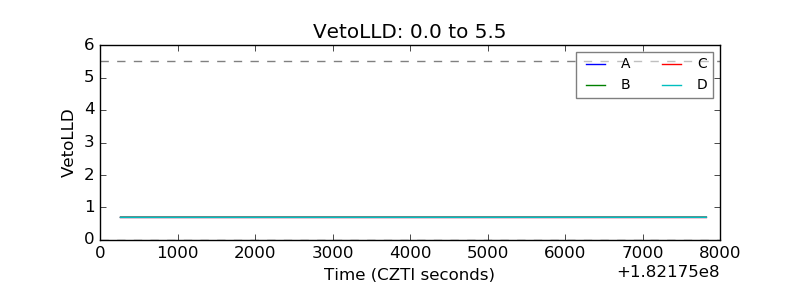 |
| Alpha Counter | 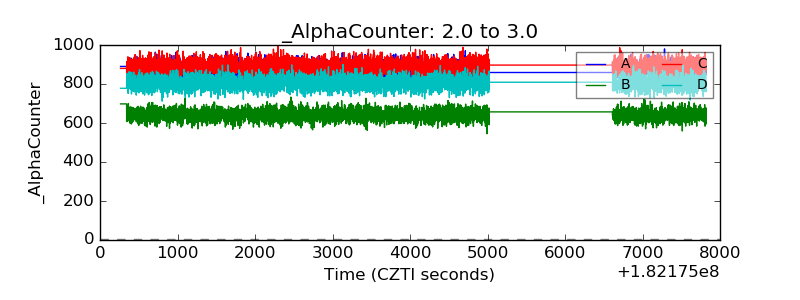 |
| _CPM_Rate | 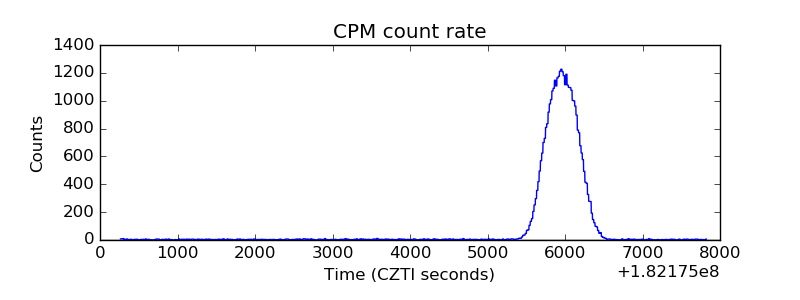 |
| CZT Counter | 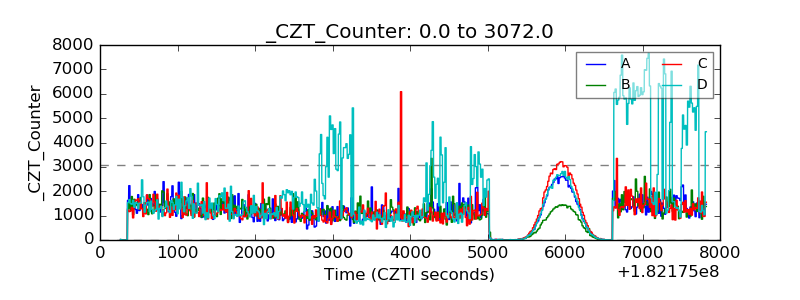 |
| +2.5 Volts monitor |  |
| +5 Volts monitor |  |
| _ROLL_ROT | 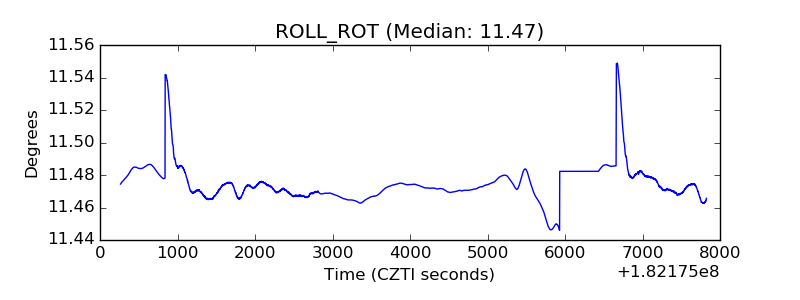 |
| _Roll_DEC | 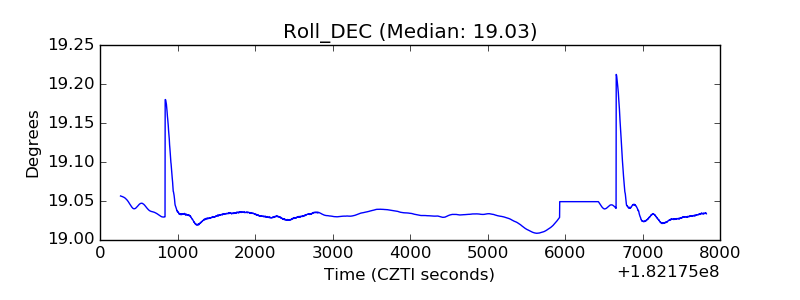 |
| _Roll_RA | 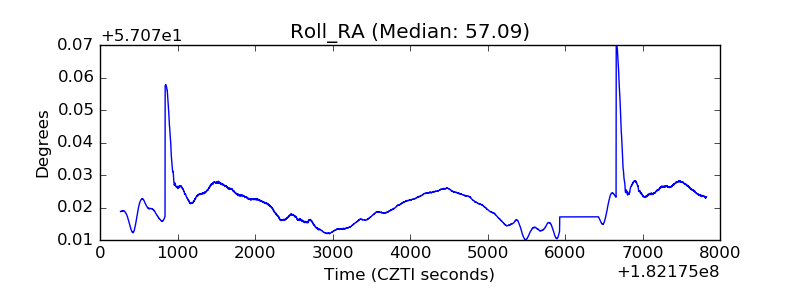 |
| Veto Counter | 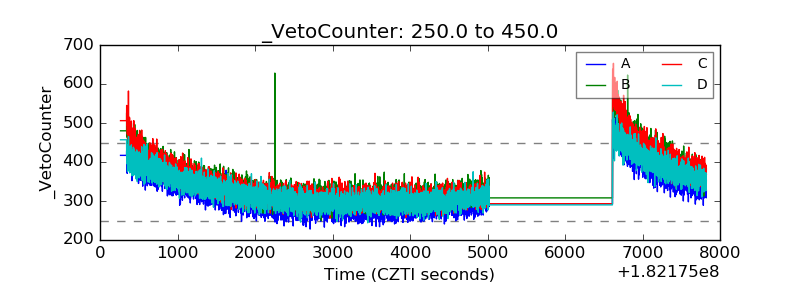 |