| Param | Original file | Final file |
|---|---|---|
| Filename | modeM0/AS1P01_136T01_9000000014_00186cztM0_level2.evt | modeM0/AS1P01_136T01_9000000014_00186cztM0_level2_quad_clean.evt |
| Size (bytes) | 871,548,480 | 58,573,440 |
| Size | 831.2 MB | 55.9 MB |
| Events in quadrant A | 5,558,317 | 367,431 |
| Events in quadrant B | 5,587,338 | 382,922 |
| Events in quadrant C | 5,243,605 | 373,494 |
| Events in quadrant D | 9,694,763 | 320,298 |
| Mode M0 | |||
|---|---|---|---|
| Quadrant | BADHDUFLAG | Total packets | Discarded packets |
| A | 0 | 19853 | 1 |
| B | 0 | 19936 | 1 |
| C | 0 | 18903 | 1 |
| D | 0 | 32369 | 1 |
| Mode M9 | |||
|---|---|---|---|
| Quadrant | BADHDUFLAG | Total packets | Discarded packets |
| A | 0 | 14 | 0 |
| B | 0 | 14 | 0 |
| C | 0 | 14 | 0 |
| D | 0 | 15 | 0 |
| Mode SS | |||
|---|---|---|---|
| Quadrant | BADHDUFLAG | Total packets | Discarded packets |
| A | 0 | 96 | 0 |
| B | 0 | 96 | 0 |
| C | 0 | 96 | 0 |
| D | 0 | 96 | 0 |
| Quadrant | Total seconds | Saturated seconds | Saturation percentage |
|---|---|---|---|
| A | 4680 | 3 | 0.064103% |
| B | 4680 | 3 | 0.064103% |
| C | 4680 | 11 | 0.235043% |
| D | 4680 | 1705 | 36.431624% |
Noise dominated data is calculated using 1-second bins in cleaned event files. If a bin has >2000 counts, and if more than 50% of those come from <1% of pixels, then it is considered to be noise-dominated and hence unusable.
| Quadrant | # 1 sec bins | Bins with >0 counts | Bins with >2000 counts | High rate bins dominated by noise | Noise dominated (total time) | Noise dominated (detector-on time) | Marked lightcurve |
|---|---|---|---|---|---|---|---|
| A | 4681 | 4681 | 123 | 123 | 2.63% | 2.63% |  |
| B | 4681 | 4681 | 110 | 110 | 2.35% | 2.35% | 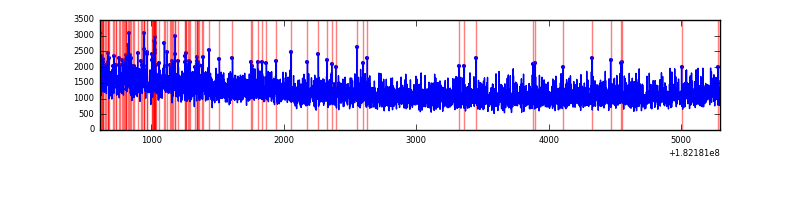 |
| C | 4681 | 4681 | 64 | 64 | 1.37% | 1.37% | 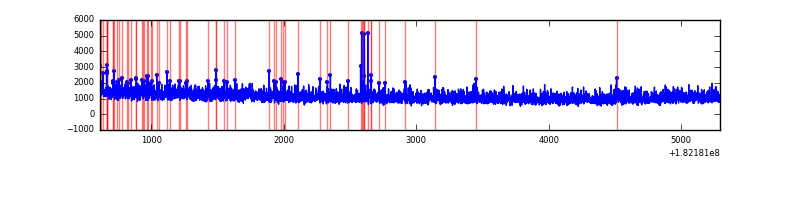 |
| D | 4681 | 4681 | 2302 | 2302 | 49.18% | 49.18% | 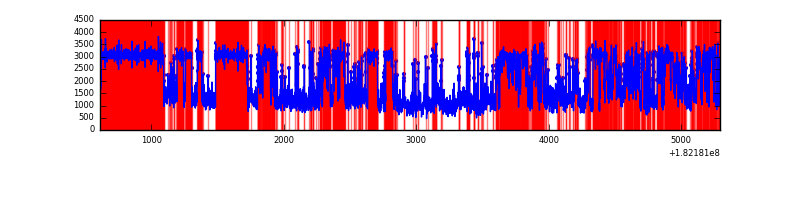 |
Top three noisy pixels from each quadrant. If the there are fewer than three noisy pixels in the level2.evt file, extra rows are filled as -1
| Pixel properties | Quadrant properties | ||||||
|---|---|---|---|---|---|---|---|
| Quadrant | DetID | PixID | Counts | Sigma | Mean | Median | Sigma |
| A | 5 | 244 | 20044 | 59.9 | 1425 | 1416 | 311.0 |
| A | 13 | 239 | 8593 | 23.08 | 1425 | 1416 | 311.0 |
| A | 0 | 253 | 8308 | 22.16 | 1425 | 1416 | 311.0 |
| B | 5 | 85 | 26085 | 72.42 | 1443 | 1451 | 340.2 |
| B | 0 | 247 | 22960 | 63.23 | 1443 | 1451 | 340.2 |
| B | 4 | 67 | 6275 | 14.18 | 1443 | 1451 | 340.2 |
| C | 0 | 202 | 32333 | 84.47 | 1317 | 1365 | 366.6 |
| C | 0 | 188 | 13081 | 31.96 | 1317 | 1365 | 366.6 |
| C | 7 | 159 | 7866 | 17.73 | 1317 | 1365 | 366.6 |
| D | 12 | 249 | 5371956 | 16303.79 | 1096 | 1134 | 329.4 |
| D | 13 | 21 | 23785 | 68.76 | 1096 | 1134 | 329.4 |
| D | 1 | 85 | 16356 | 46.21 | 1096 | 1134 | 329.4 |
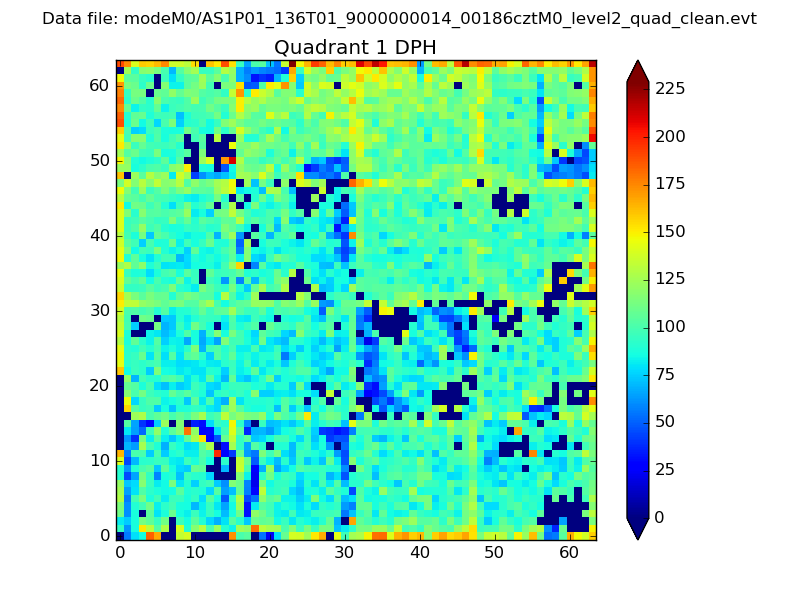
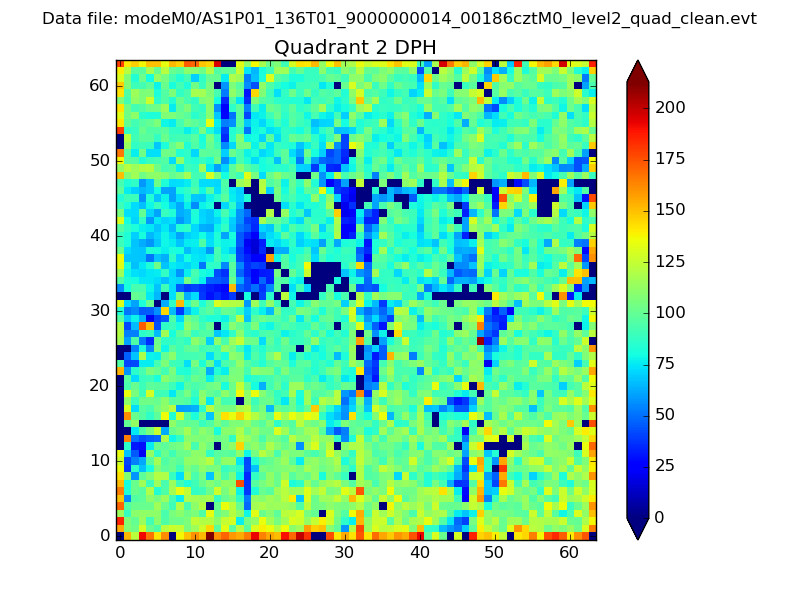
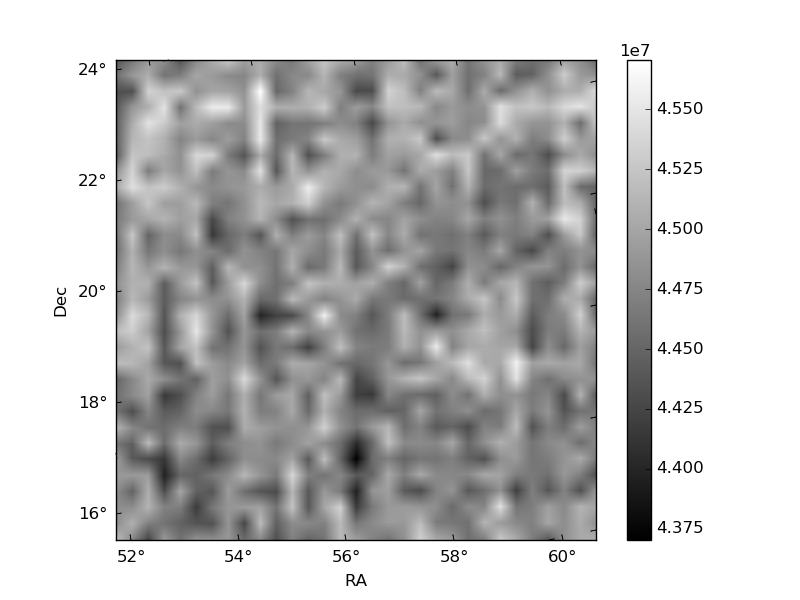
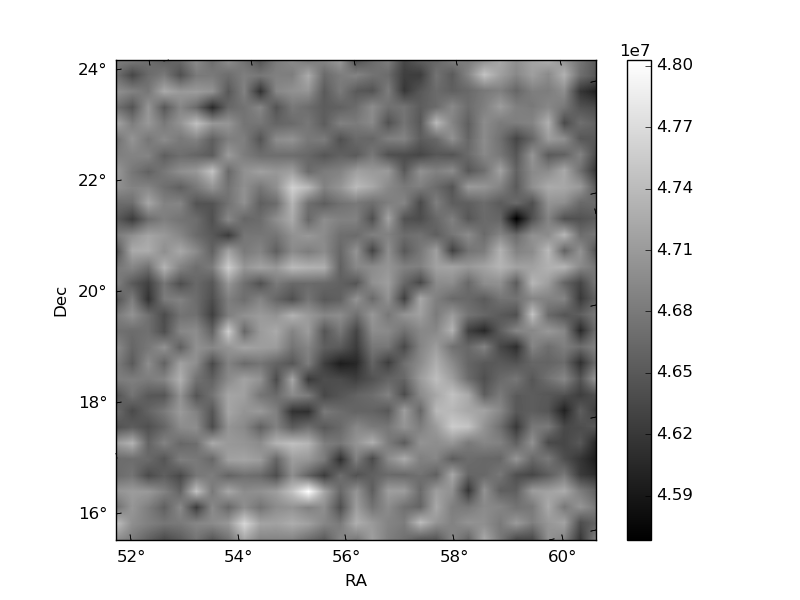
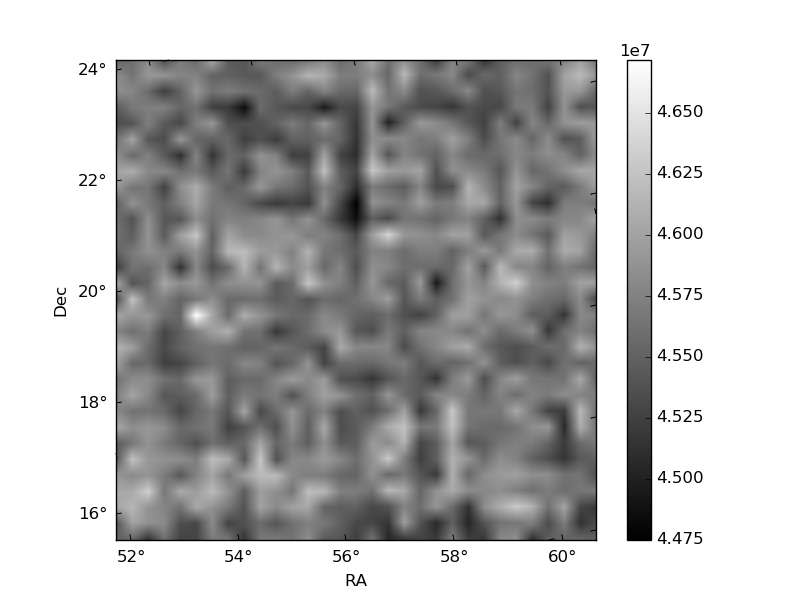
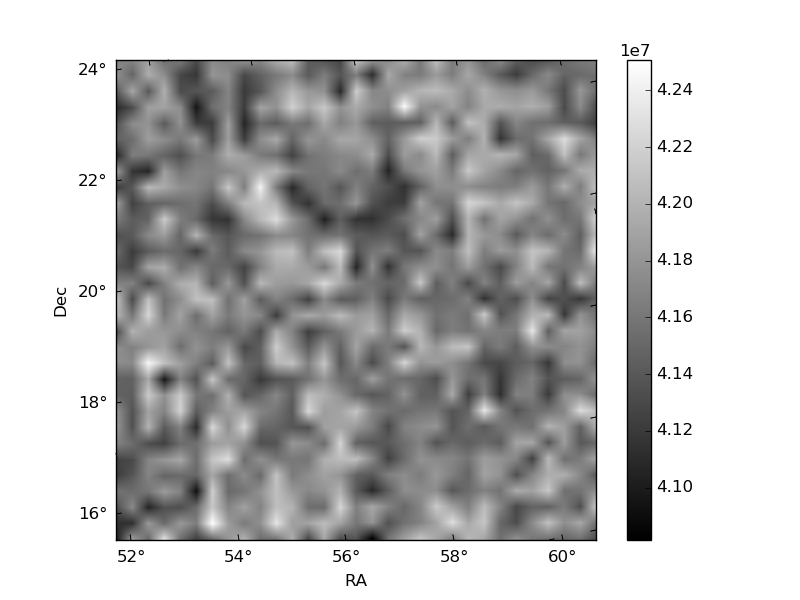
Histogram calculated using DETX and DETY for each event in the final _common_clean file
| Quadrant A | 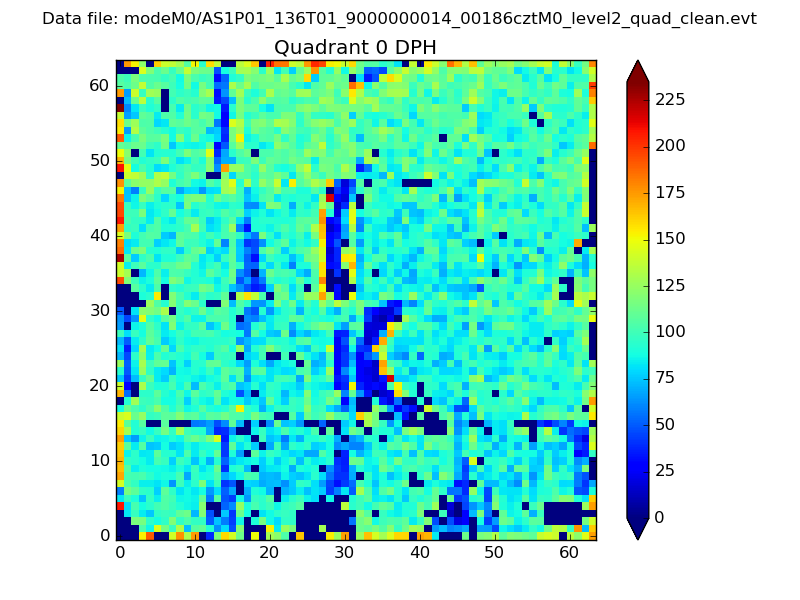 |
 |
Quadrant B |
|---|---|---|---|
| Quadrant D | 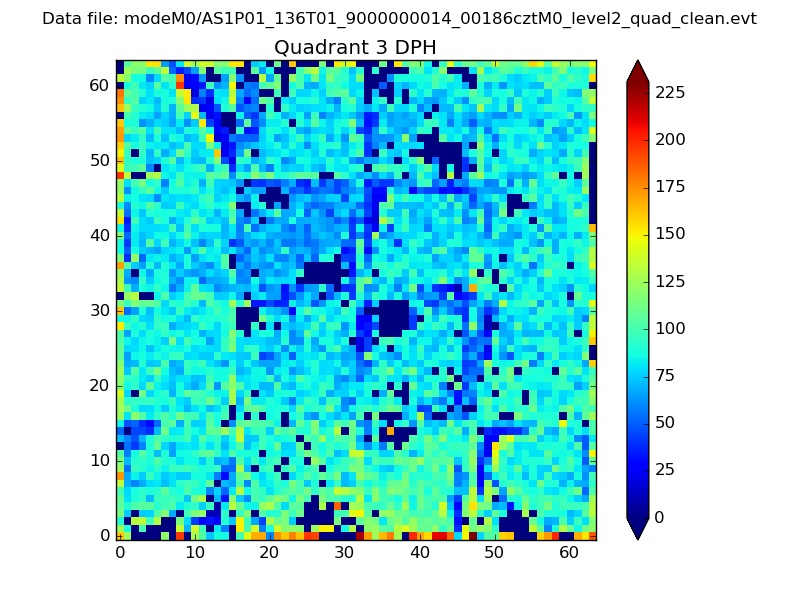 |
 |
Quadrant C |
| Plot type | Count rate plots | Images |
|---|---|---|
| Comparison with Poisson distribution Blue bars denote a histogram of data divided into 1 sec bins. Red curve is a Poisson curve with rate = median count rate of data. |
 |
 |
| Quadrant-wise count rates Data is divided into 100 sec bins |
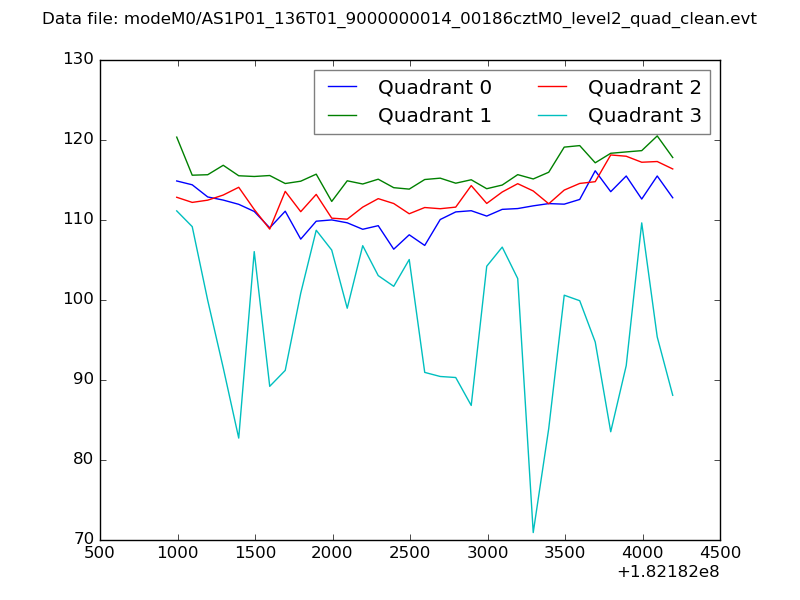 |
|
| Module-wise count rates for Quadrant A Data is divided into 100 sec bins |
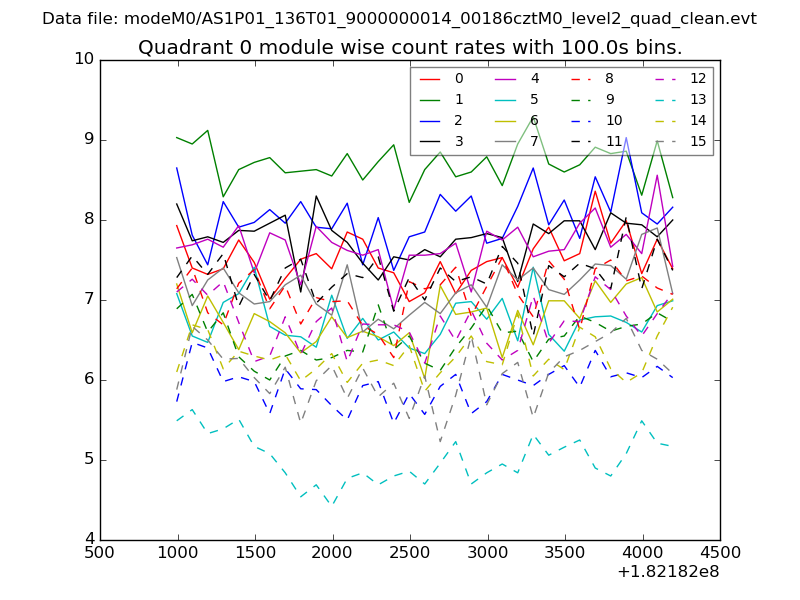 |
 |
| Module-wise count rates for Quadrant B Data is divided into 100 sec bins |
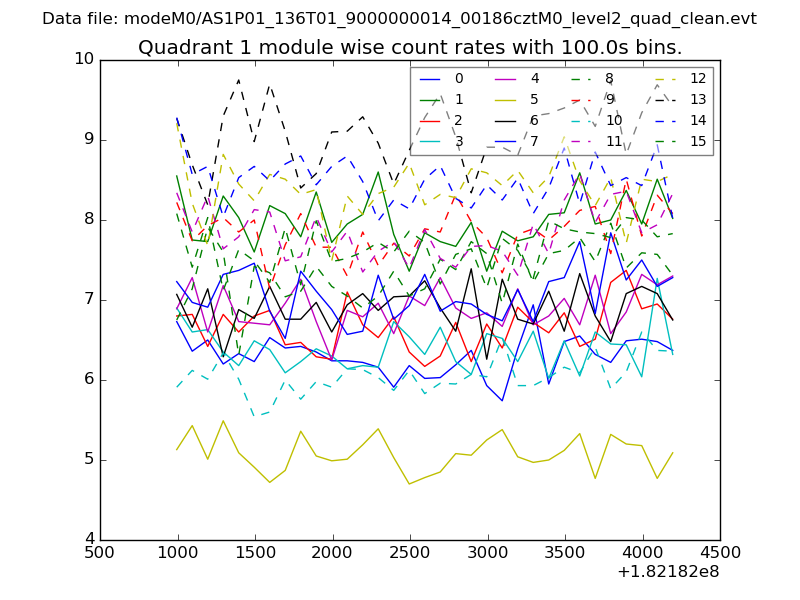 |
 |
| Module-wise count rates for Quadrant C Data is divided into 100 sec bins |
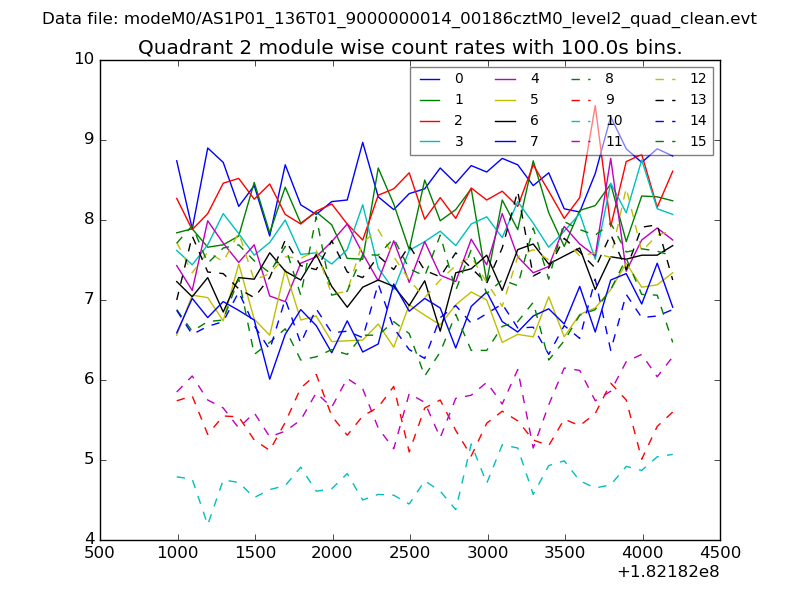 |
 |
| Module-wise count rates for Quadrant D Data is divided into 100 sec bins |
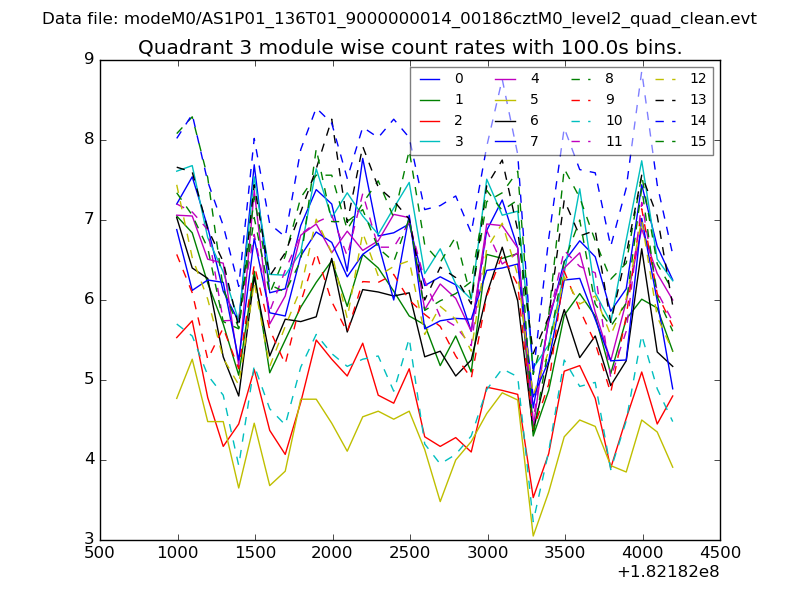 |
 |
| Parameter | Plot |
|---|---|
| CZT HV Monitor | 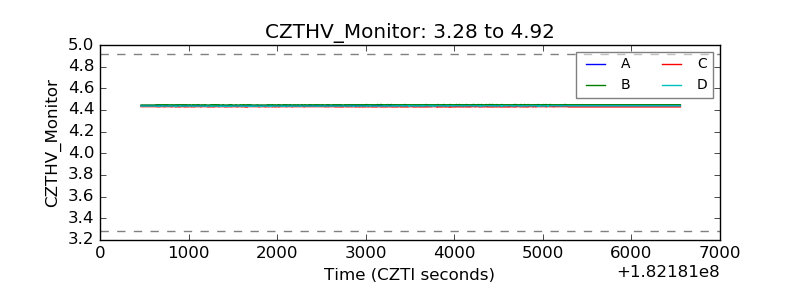 |
| D_VDD | 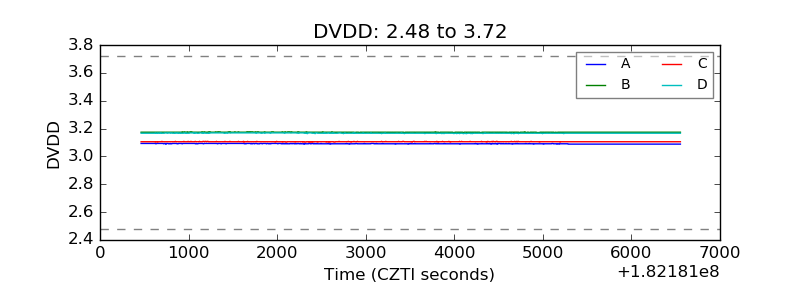 |
| Temperature 1 | 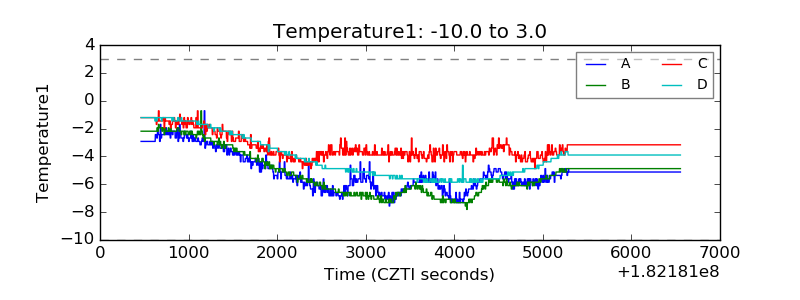 |
| Veto HV Monitor | 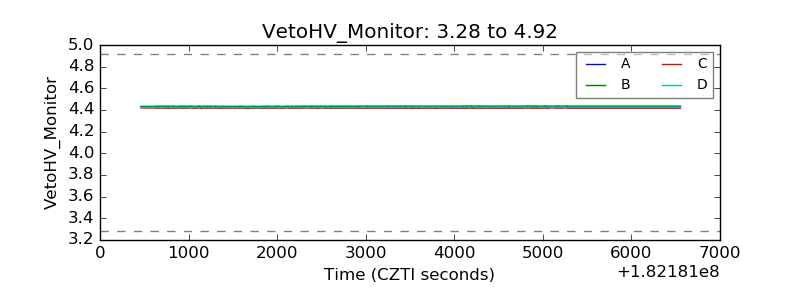 |
| Veto LLD | 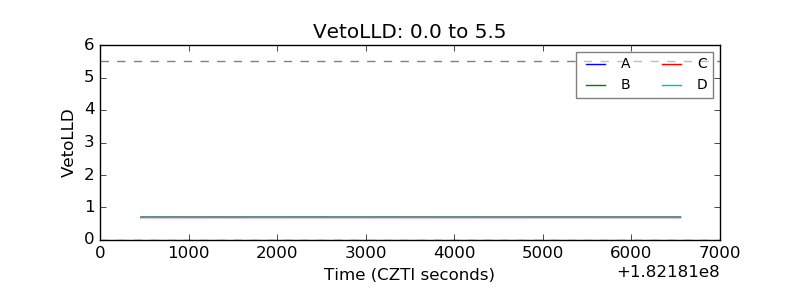 |
| Alpha Counter | 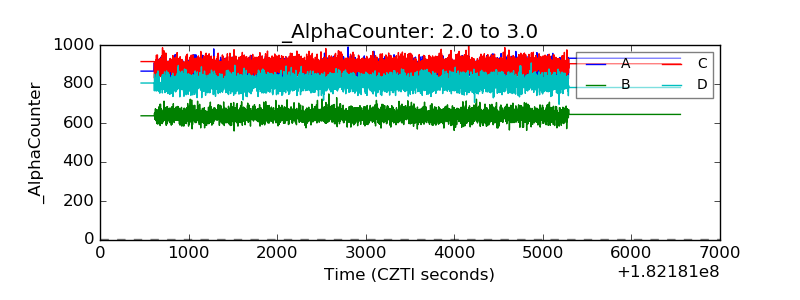 |
| _CPM_Rate | 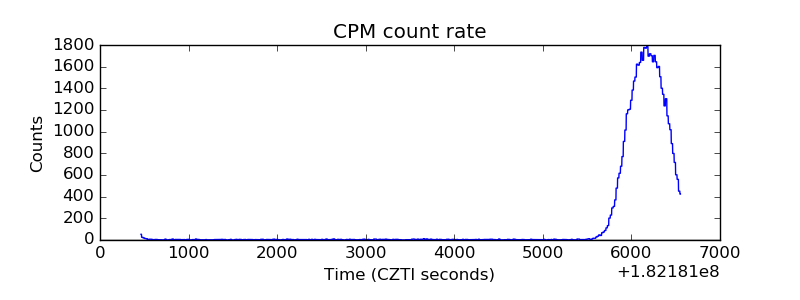 |
| CZT Counter | 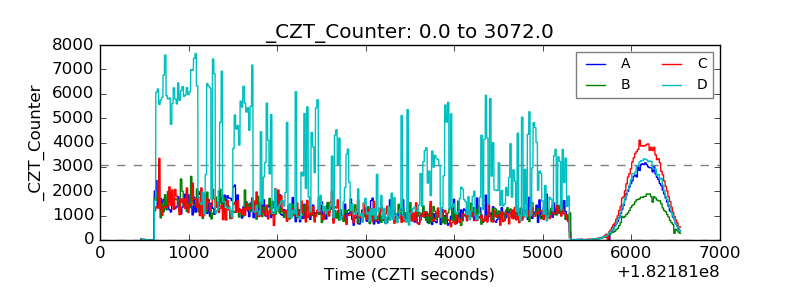 |
| +2.5 Volts monitor |  |
| +5 Volts monitor |  |
| _ROLL_ROT | 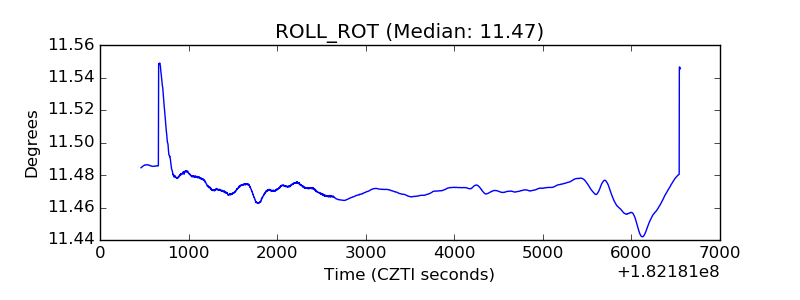 |
| _Roll_DEC | 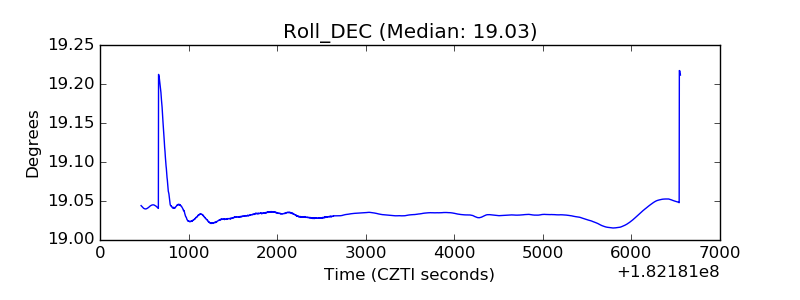 |
| _Roll_RA | 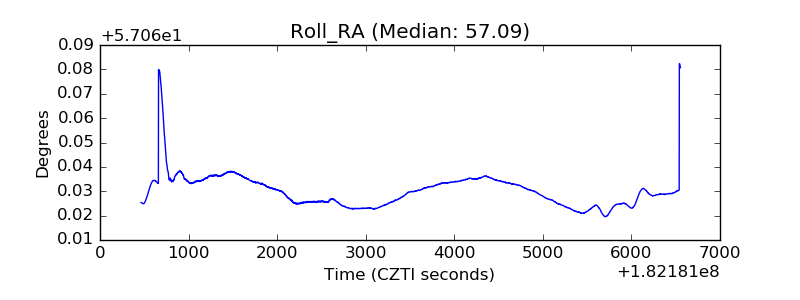 |
| Veto Counter | 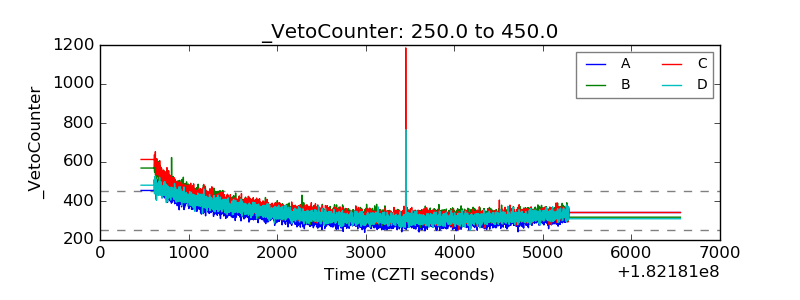 |