| Param | Original file | Final file |
|---|---|---|
| Filename | modeM0/AS1P01_140T01_9000000018_00195cztM0_level2.evt | modeM0/AS1P01_140T01_9000000018_00195cztM0_level2_quad_clean.evt |
| Size (bytes) | 1,038,038,400 | 62,190,720 |
| Size | 990.0 MB | 59.3 MB |
| Events in quadrant A | 7,537,894 | 374,965 |
| Events in quadrant B | 9,642,247 | 349,907 |
| Events in quadrant C | 6,778,362 | 375,263 |
| Events in quadrant D | 7,079,106 | 361,269 |
| Mode SS | |||
|---|---|---|---|
| Quadrant | BADHDUFLAG | Total packets | Discarded packets |
| A | 0 | 244 | 122 |
| B | 0 | 244 | 122 |
| C | 0 | 244 | 122 |
| D | 0 | 244 | 122 |
| Mode M9 | |||
|---|---|---|---|
| Quadrant | BADHDUFLAG | Total packets | Discarded packets |
| A | 0 | 36 | 18 |
| B | 0 | 36 | 18 |
| C | 0 | 36 | 18 |
| D | 0 | 38 | 19 |
| Mode M0 | |||
|---|---|---|---|
| Quadrant | BADHDUFLAG | Total packets | Discarded packets |
| A | 0 | 53255 | 26630 |
| B | 0 | 66050 | 33027 |
| C | 0 | 48762 | 24387 |
| D | 0 | 50700 | 25352 |
| Quadrant | Total seconds | Saturated seconds | Saturation percentage |
|---|---|---|---|
| A | 6032 | 16 | 0.265252% |
| B | 6032 | 731 | 12.118700% |
| C | 6031 | 5 | 0.082905% |
| D | 6032 | 27 | 0.447613% |
Noise dominated data is calculated using 1-second bins in cleaned event files. If a bin has >2000 counts, and if more than 50% of those come from <1% of pixels, then it is considered to be noise-dominated and hence unusable.
| Quadrant | # 1 sec bins | Bins with >0 counts | Bins with >2000 counts | High rate bins dominated by noise | Noise dominated (total time) | Noise dominated (detector-on time) | Marked lightcurve |
|---|---|---|---|---|---|---|---|
| A | 7652 | 6034 | 222 | 222 | 2.90% | 3.68% |  |
| B | 7652 | 6034 | 1191 | 1191 | 15.56% | 19.74% |  |
| C | 7652 | 6034 | 62 | 62 | 0.81% | 1.03% | 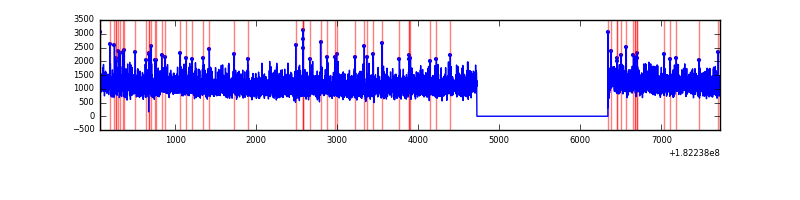 |
| D | 7652 | 6034 | 130 | 130 | 1.70% | 2.15% |  |
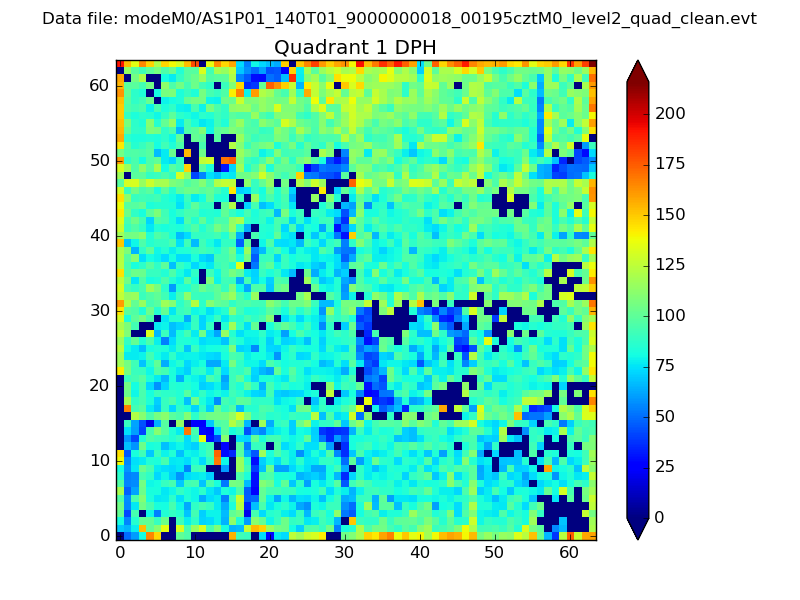
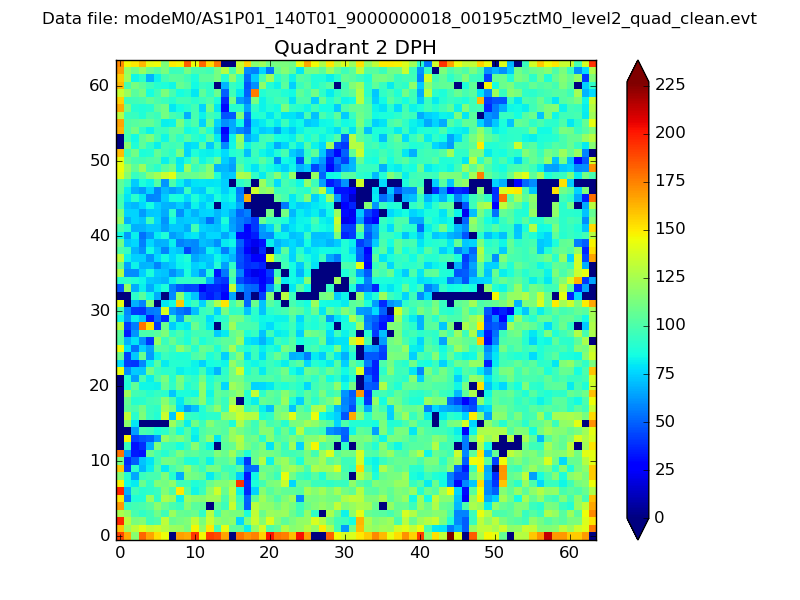
Top three noisy pixels from each quadrant. If the there are fewer than three noisy pixels in the level2.evt file, extra rows are filled as -1
| Pixel properties | Quadrant properties | ||||||
|---|---|---|---|---|---|---|---|
| Quadrant | DetID | PixID | Counts | Sigma | Mean | Median | Sigma |
| A | 12 | 150 | 54014 | 122.27 | 1914 | 1894 | 426.3 |
| A | 13 | 17 | 42219 | 94.6 | 1914 | 1894 | 426.3 |
| A | 0 | 253 | 20838 | 44.44 | 1914 | 1894 | 426.3 |
| B | 0 | 247 | 2520040 | 5767.96 | 1843 | 1851 | 436.6 |
| B | 0 | 183 | 17838 | 36.62 | 1843 | 1851 | 436.6 |
| B | 5 | 47 | 13720 | 27.19 | 1843 | 1851 | 436.6 |
| C | 1 | 192 | 63733 | 129.3 | 1695 | 1755 | 479.3 |
| C | 10 | 33 | 14872 | 27.36 | 1695 | 1755 | 479.3 |
| C | 9 | 188 | 11438 | 20.2 | 1695 | 1755 | 479.3 |
| D | 2 | 33 | 78682 | 146.29 | 1708 | 1759 | 525.8 |
| D | 10 | 154 | 50717 | 93.11 | 1708 | 1759 | 525.8 |
| D | 13 | 173 | 50154 | 92.04 | 1708 | 1759 | 525.8 |
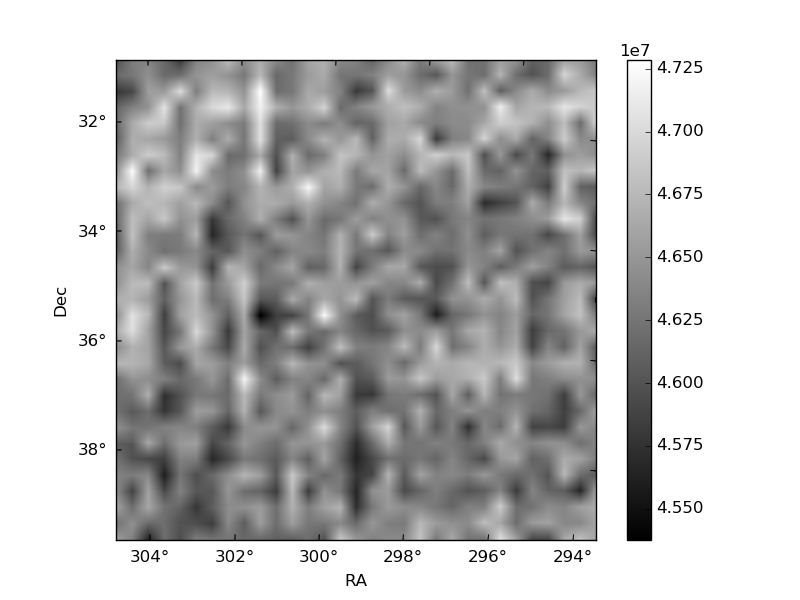
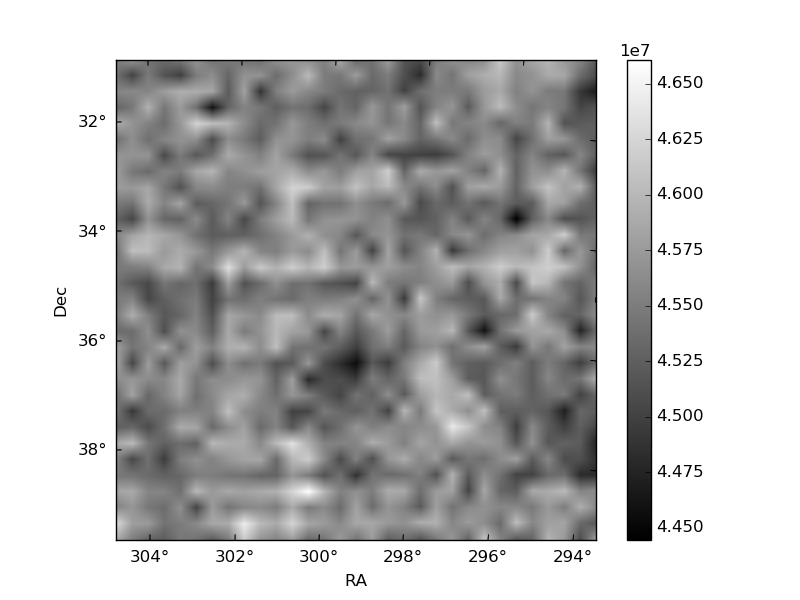
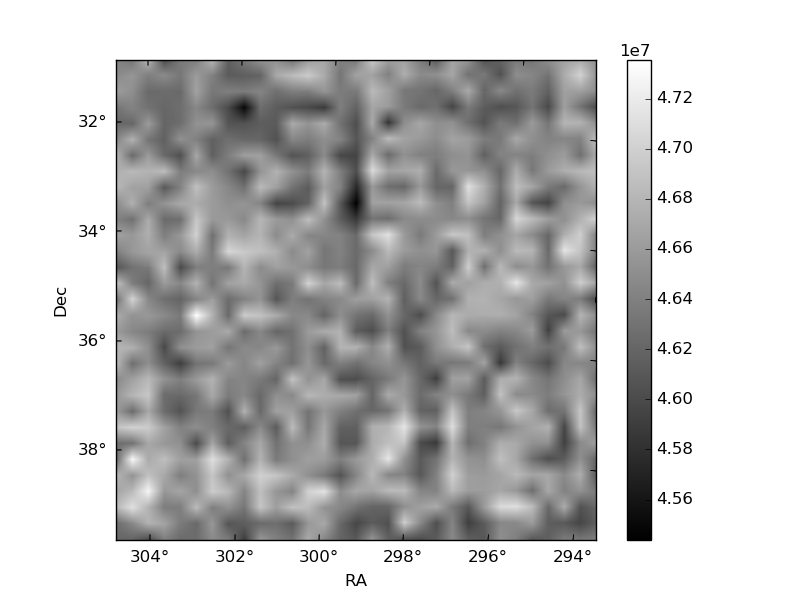
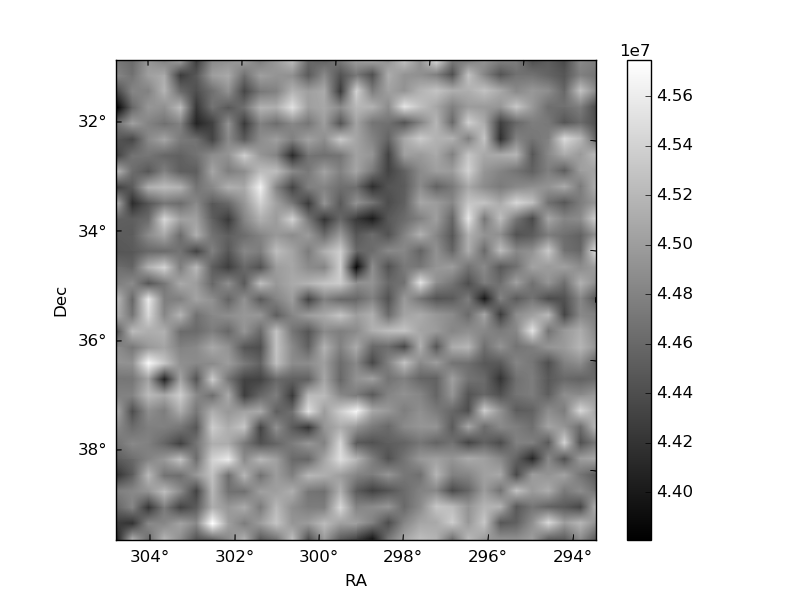
Histogram calculated using DETX and DETY for each event in the final _common_clean file
| Quadrant A |  |
 |
Quadrant B |
|---|---|---|---|
| Quadrant D | 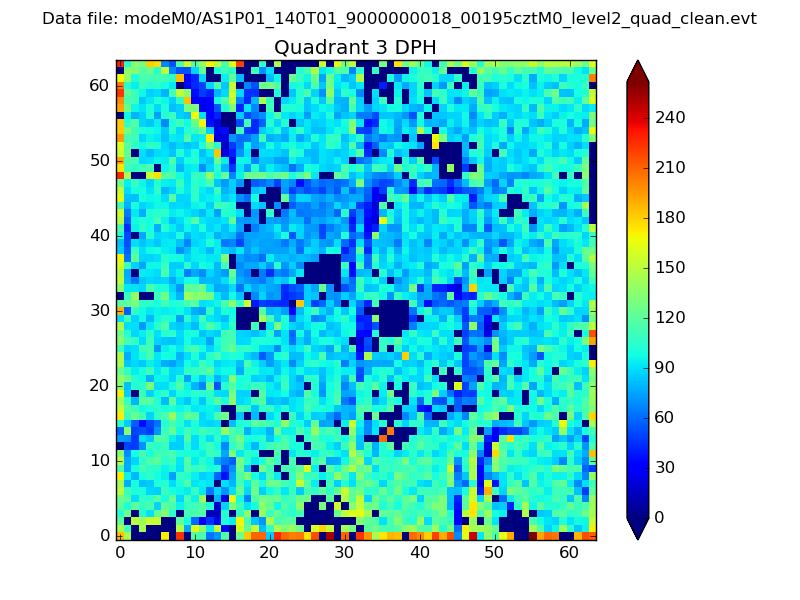 |
 |
Quadrant C |
| Plot type | Count rate plots | Images |
|---|---|---|
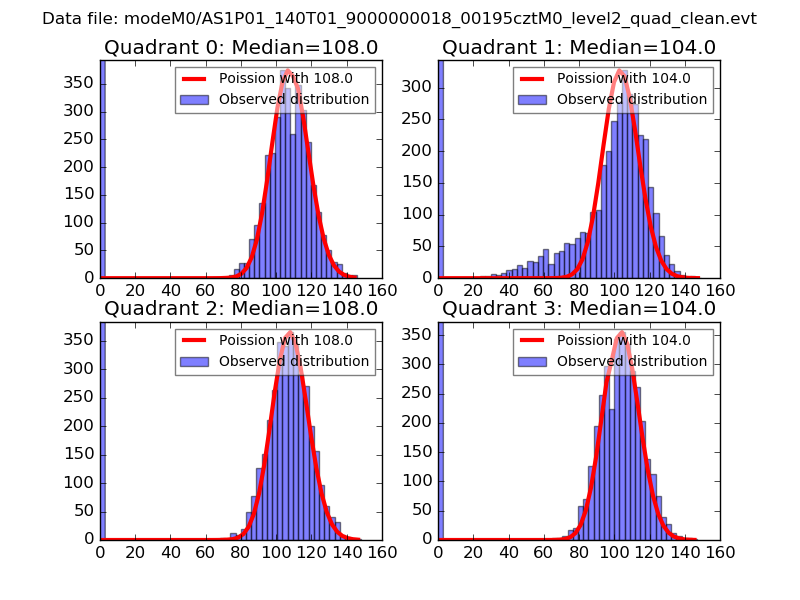
| Comparison with Poisson distribution Blue bars denote a histogram of data divided into 1 sec bins. Red curve is a Poisson curve with rate = median count rate of data. |
 |
 |
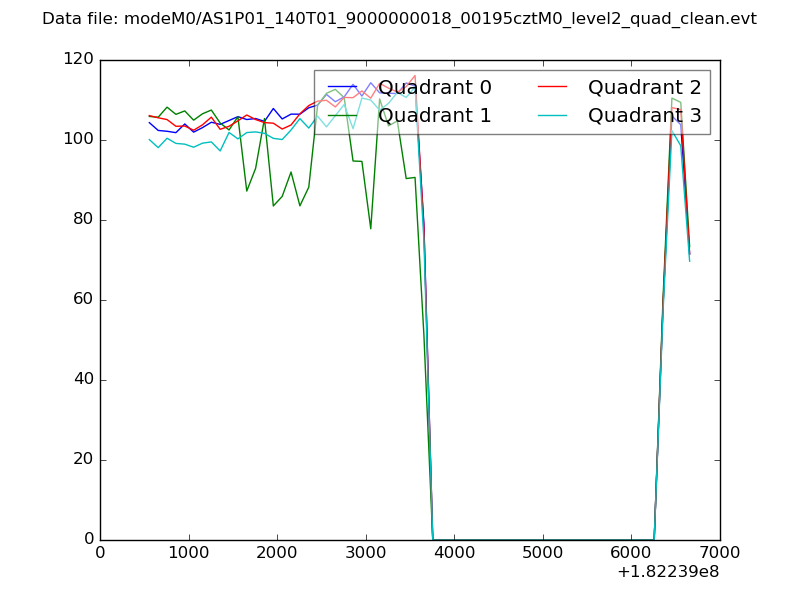
| Quadrant-wise count rates Data is divided into 100 sec bins |
 |
|
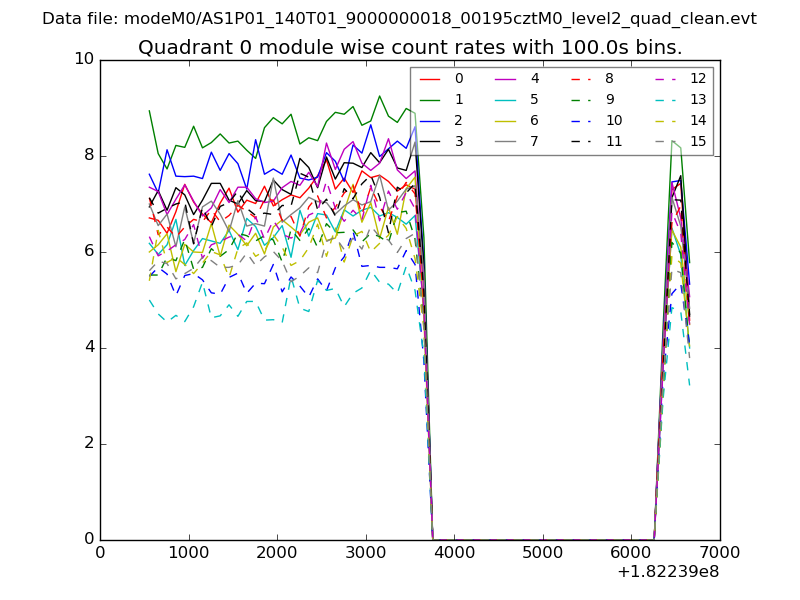
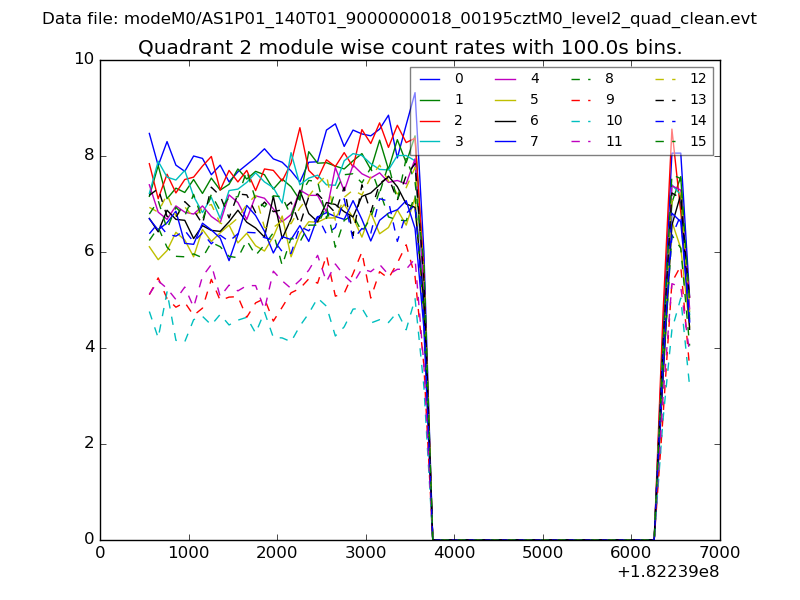
| Module-wise count rates for Quadrant A Data is divided into 100 sec bins |
 |
 |
| Module-wise count rates for Quadrant B Data is divided into 100 sec bins |
 |
 |
| Module-wise count rates for Quadrant C Data is divided into 100 sec bins |
 |
 |
| Module-wise count rates for Quadrant D Data is divided into 100 sec bins |
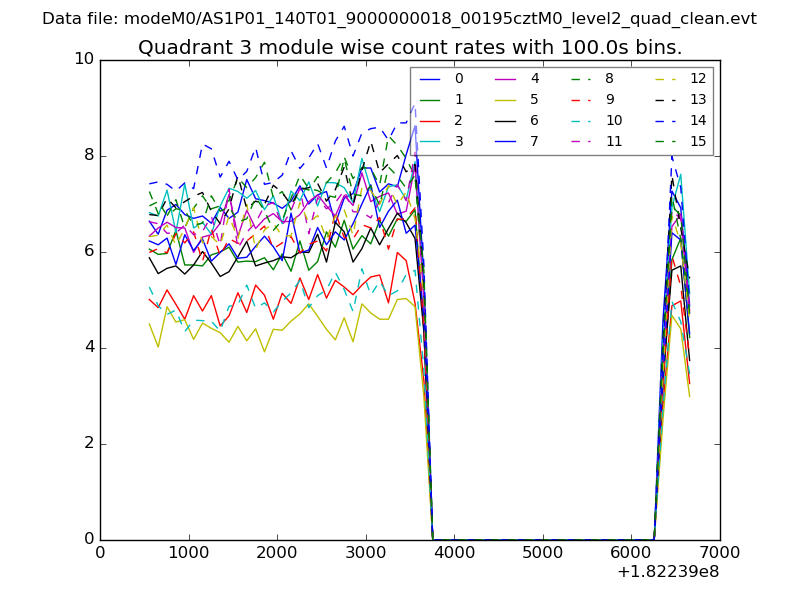 |
 |
| Parameter | Plot |
|---|---|
| CZT HV Monitor | 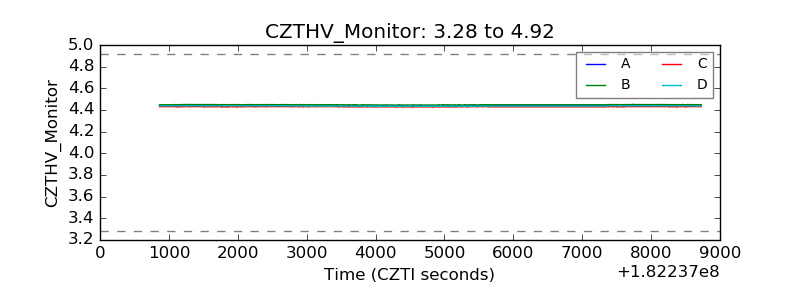 |
| D_VDD | 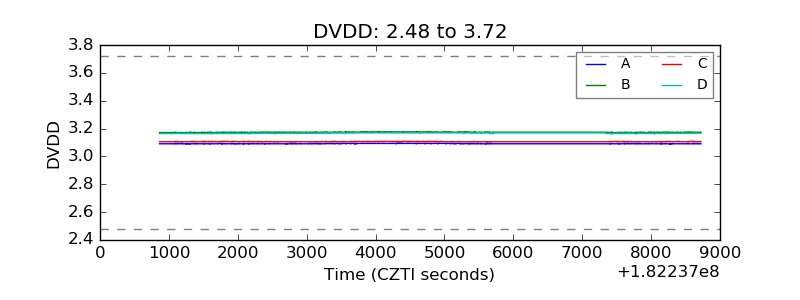 |
| Temperature 1 | 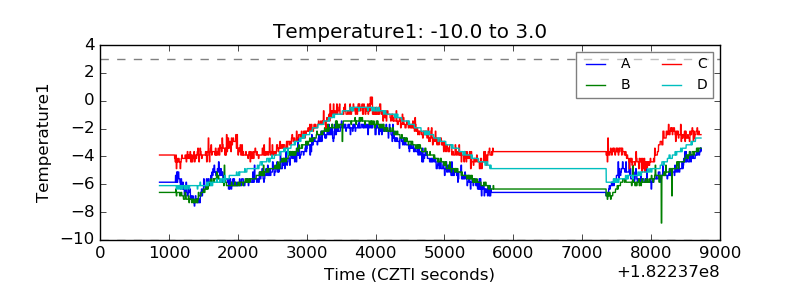 |
| Veto HV Monitor | 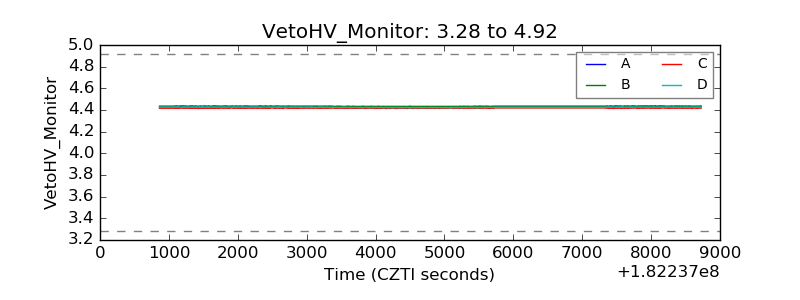 |
| Veto LLD |  |
| Alpha Counter | 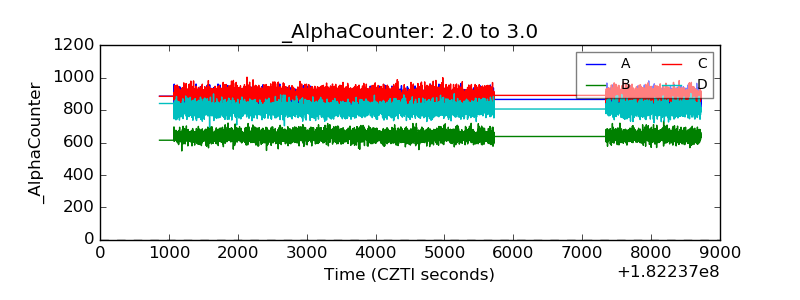 |
| _CPM_Rate | 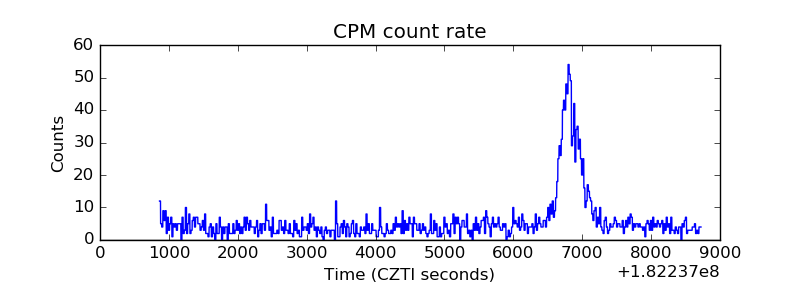 |
| CZT Counter | 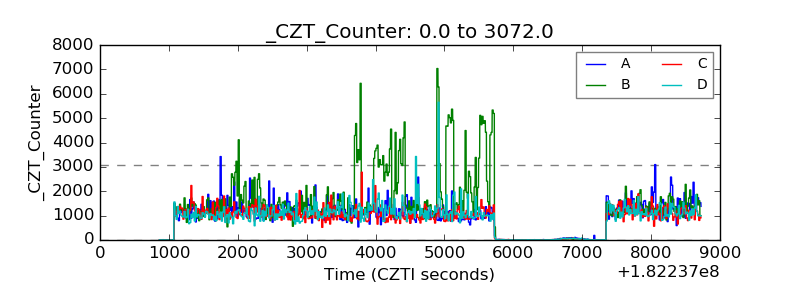 |
| +2.5 Volts monitor |  |
| +5 Volts monitor |  |
| _ROLL_ROT | 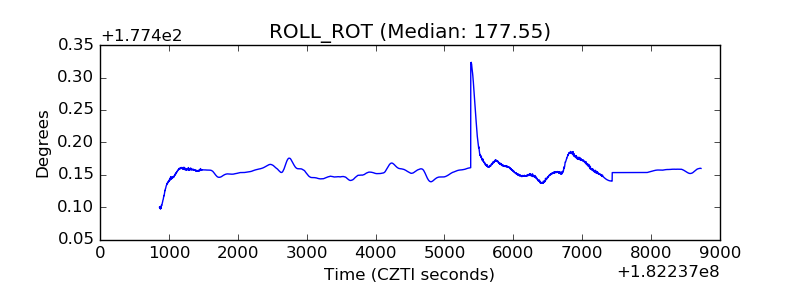 |
| _Roll_DEC | 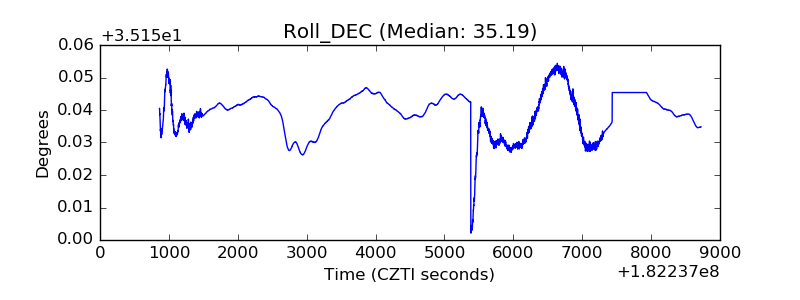 |
| _Roll_RA | 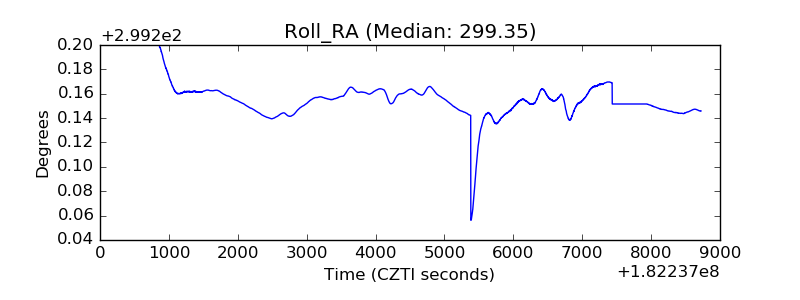 |
| Veto Counter | 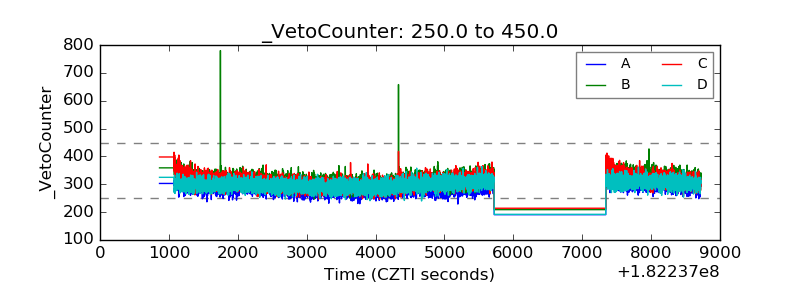 |