| Param | Original file | Final file |
|---|---|---|
| Filename | modeM0/AS1P01_140T01_9000000018_00196cztM0_level2.evt | modeM0/AS1P01_140T01_9000000018_00196cztM0_level2_quad_clean.evt |
| Size (bytes) | 877,584,960 | 73,494,720 |
| Size | 836.9 MB | 70.1 MB |
| Events in quadrant A | 7,178,997 | 460,427 |
| Events in quadrant B | 6,521,430 | 473,379 |
| Events in quadrant C | 6,033,687 | 463,765 |
| Events in quadrant D | 6,484,055 | 448,820 |
| Mode SS | |||
|---|---|---|---|
| Quadrant | BADHDUFLAG | Total packets | Discarded packets |
| A | 0 | 112 | 0 |
| B | 0 | 112 | 0 |
| C | 0 | 112 | 0 |
| D | 0 | 112 | 0 |
| Mode M9 | |||
|---|---|---|---|
| Quadrant | BADHDUFLAG | Total packets | Discarded packets |
| A | 0 | 16 | 0 |
| B | 0 | 16 | 0 |
| C | 0 | 16 | 0 |
| D | 0 | 16 | 0 |
| Mode M0 | |||
|---|---|---|---|
| Quadrant | BADHDUFLAG | Total packets | Discarded packets |
| A | 0 | 25204 | 2 |
| B | 0 | 23230 | 1 |
| C | 0 | 21787 | 1 |
| D | 0 | 23117 | 1 |
| Quadrant | Total seconds | Saturated seconds | Saturation percentage |
|---|---|---|---|
| A | 5409 | 31 | 0.573119% |
| B | 5409 | 3 | 0.055463% |
| C | 5409 | 3 | 0.055463% |
| D | 5409 | 22 | 0.406730% |
Noise dominated data is calculated using 1-second bins in cleaned event files. If a bin has >2000 counts, and if more than 50% of those come from <1% of pixels, then it is considered to be noise-dominated and hence unusable.
| Quadrant | # 1 sec bins | Bins with >0 counts | Bins with >2000 counts | High rate bins dominated by noise | Noise dominated (total time) | Noise dominated (detector-on time) | Marked lightcurve |
|---|---|---|---|---|---|---|---|
| A | 7031 | 5411 | 266 | 266 | 3.78% | 4.92% | 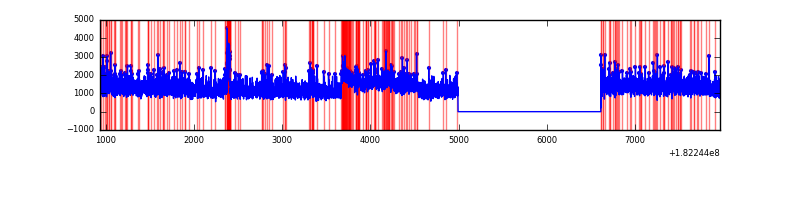 |
| B | 7031 | 5411 | 92 | 92 | 1.31% | 1.70% | 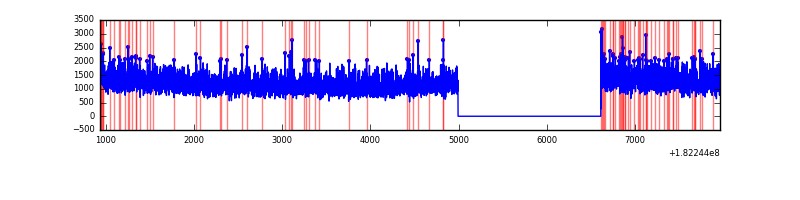 |
| C | 7031 | 5411 | 45 | 45 | 0.64% | 0.83% | 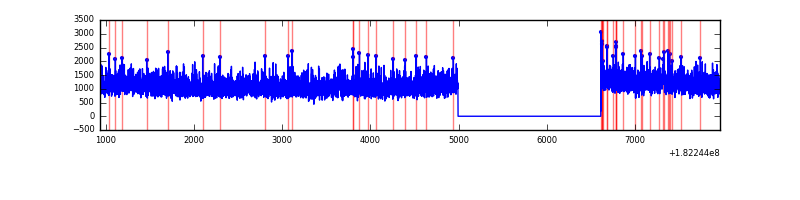 |
| D | 7031 | 5411 | 136 | 136 | 1.93% | 2.51% |  |
Top three noisy pixels from each quadrant. If the there are fewer than three noisy pixels in the level2.evt file, extra rows are filled as -1
| Pixel properties | Quadrant properties | ||||||
|---|---|---|---|---|---|---|---|
| Quadrant | DetID | PixID | Counts | Sigma | Mean | Median | Sigma |
| A | 13 | 145 | 437143 | 1162.01 | 1704 | 1692 | 374.7 |
| A | 13 | 17 | 80522 | 210.36 | 1704 | 1692 | 374.7 |
| A | 11 | 242 | 25713 | 64.1 | 1704 | 1692 | 374.7 |
| B | 0 | 247 | 23876 | 56.07 | 1671 | 1682 | 395.8 |
| B | 0 | 183 | 23804 | 55.89 | 1671 | 1682 | 395.8 |
| B | 8 | 5 | 18972 | 43.68 | 1671 | 1682 | 395.8 |
| C | 1 | 192 | 38735 | 87.77 | 1513 | 1568 | 423.5 |
| C | 10 | 33 | 13063 | 27.14 | 1513 | 1568 | 423.5 |
| C | 9 | 128 | 8295 | 15.88 | 1513 | 1568 | 423.5 |
| D | 10 | 182 | 128711 | 269.33 | 1538 | 1592 | 472.0 |
| D | 1 | 4 | 72659 | 150.57 | 1538 | 1592 | 472.0 |
| D | 9 | 51 | 71609 | 148.34 | 1538 | 1592 | 472.0 |
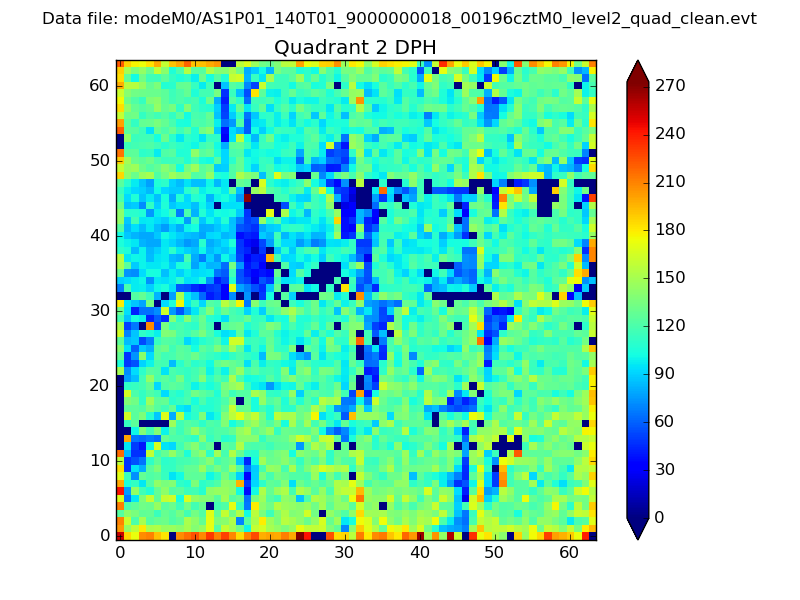
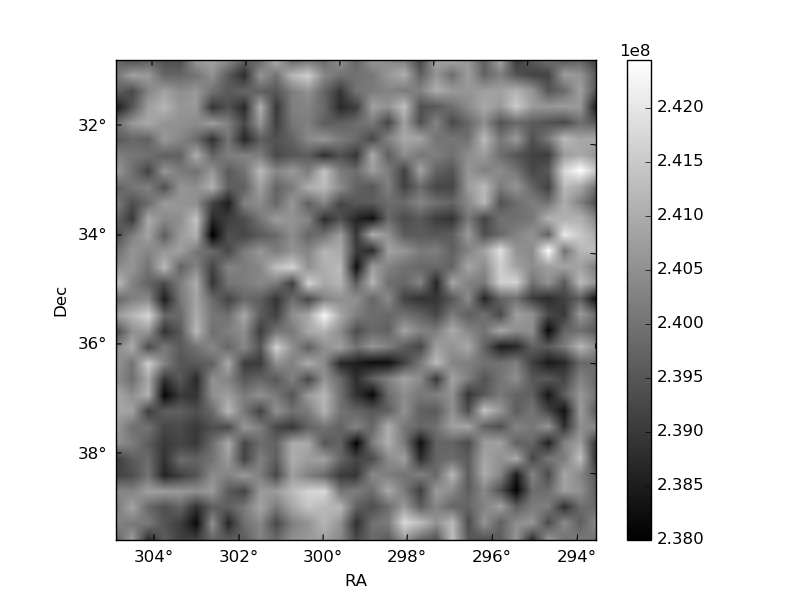
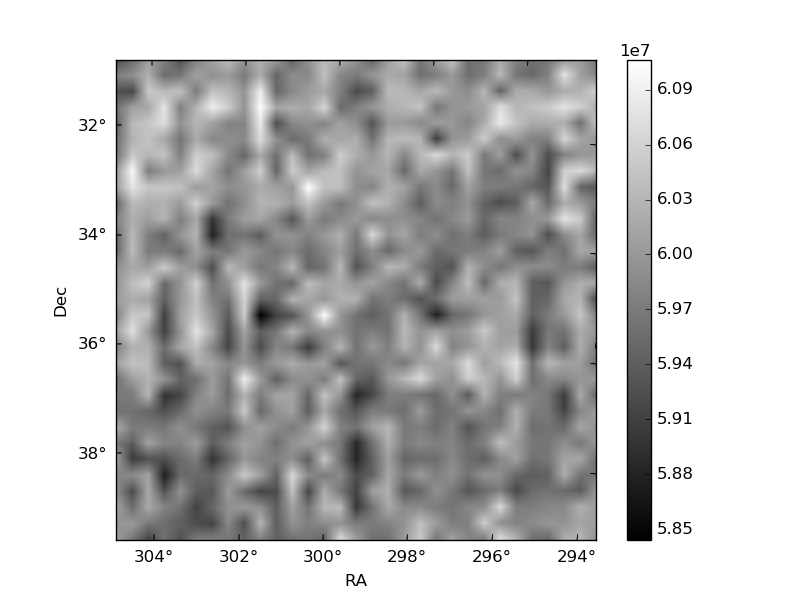
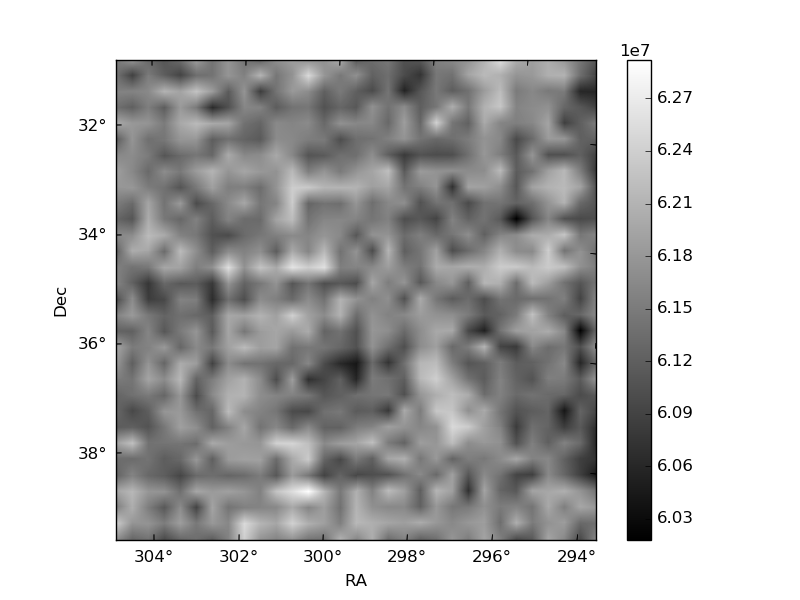
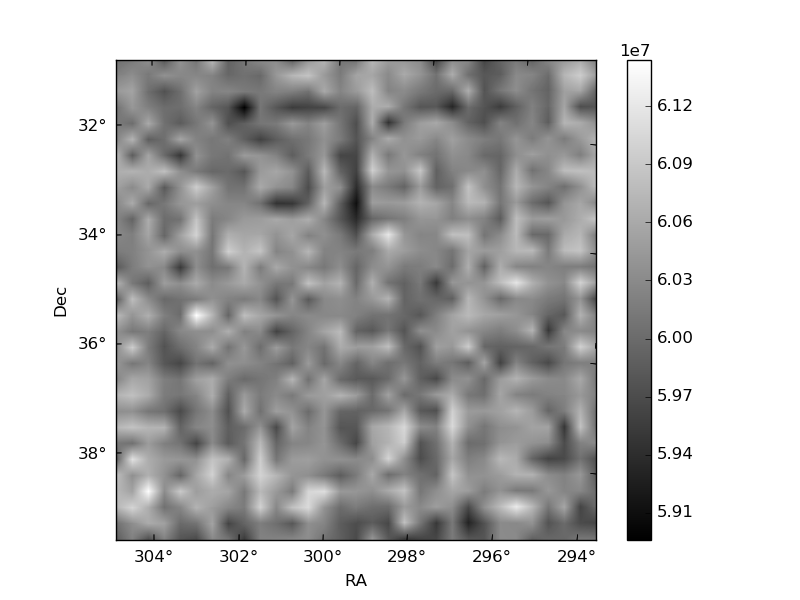
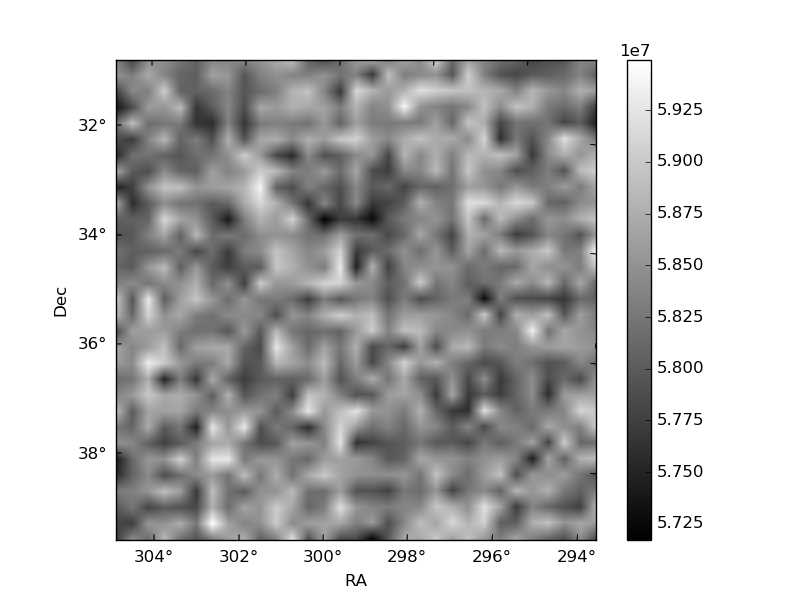
Histogram calculated using DETX and DETY for each event in the final _common_clean file
| Quadrant A | 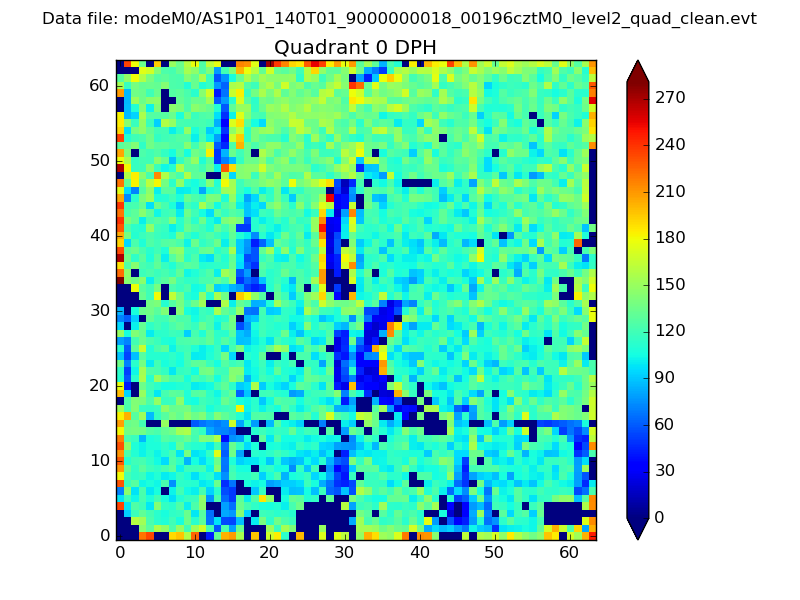 |
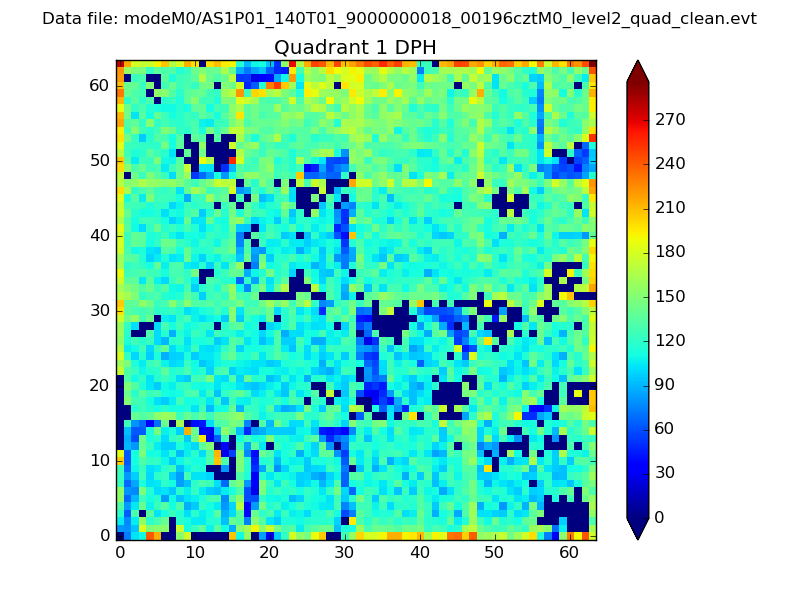 |
Quadrant B |
|---|---|---|---|
| Quadrant D | 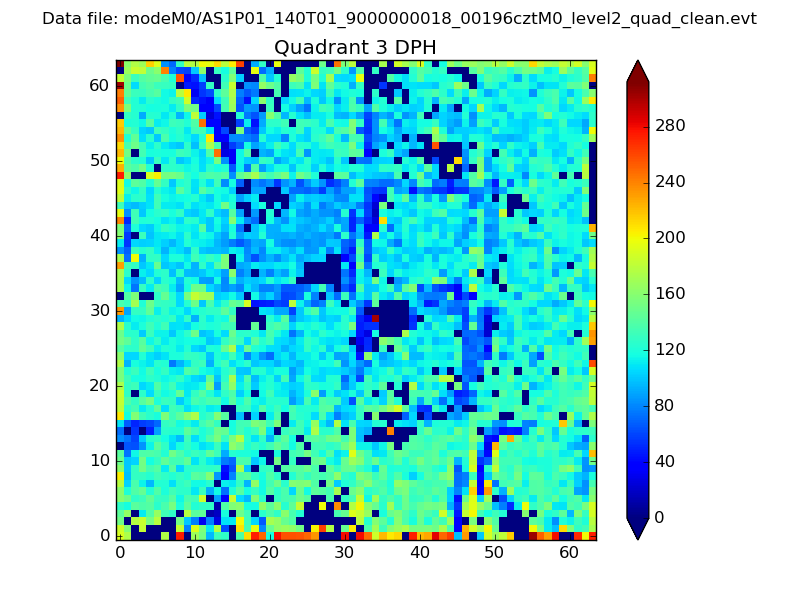 |
 |
Quadrant C |
| Plot type | Count rate plots | Images |
|---|---|---|
| Comparison with Poisson distribution Blue bars denote a histogram of data divided into 1 sec bins. Red curve is a Poisson curve with rate = median count rate of data. |
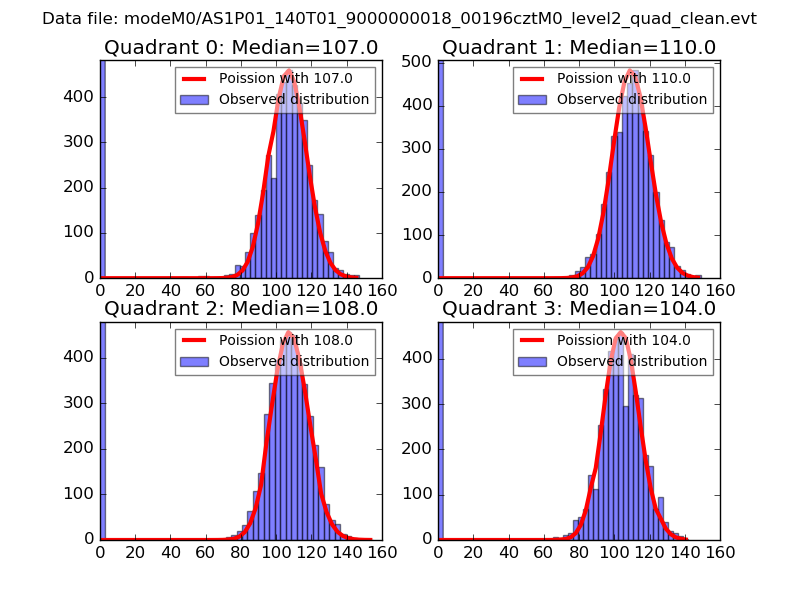 |
 |
| Quadrant-wise count rates Data is divided into 100 sec bins |
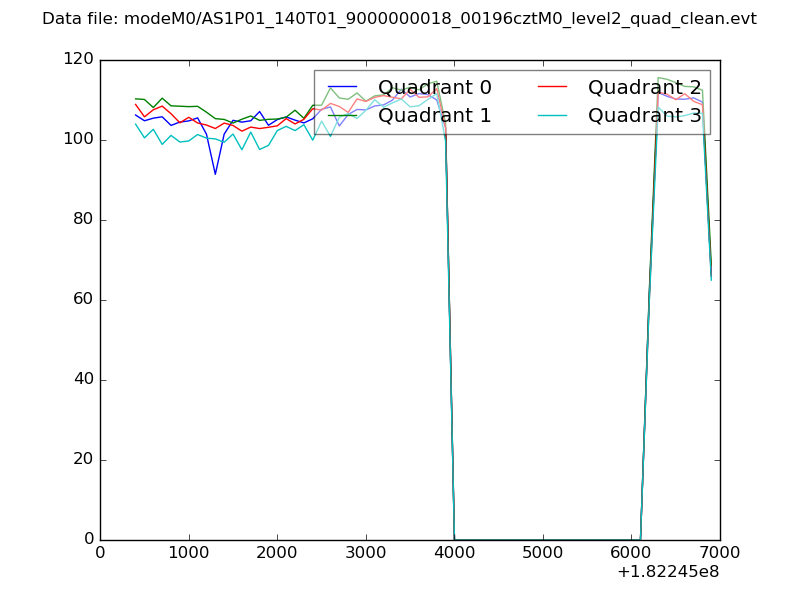 |
|
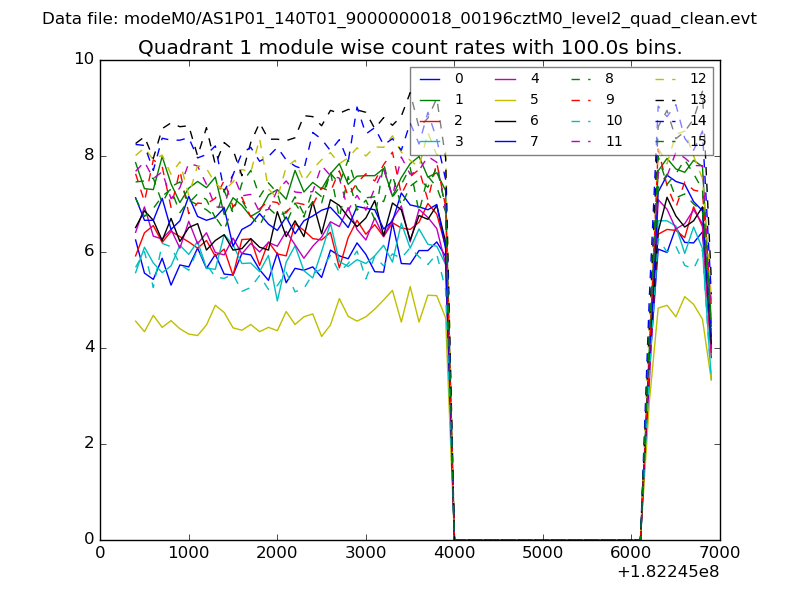
| Module-wise count rates for Quadrant A Data is divided into 100 sec bins |
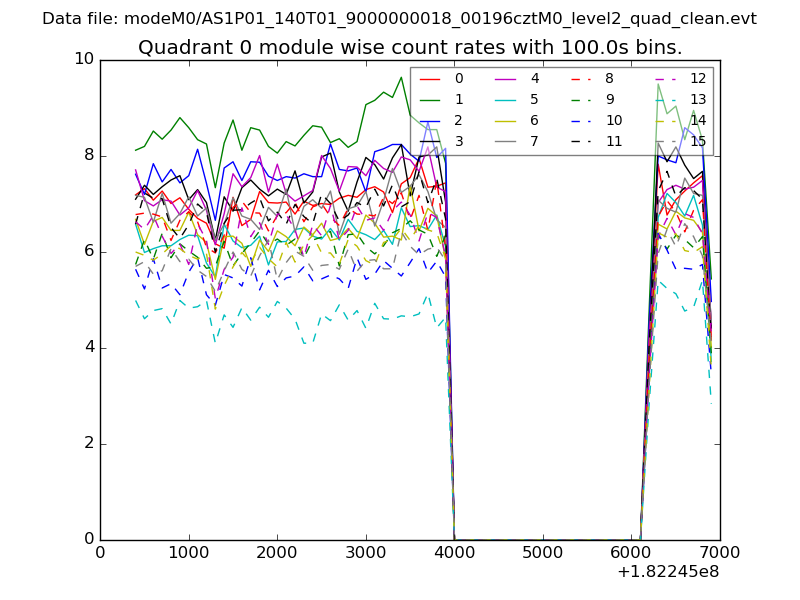 |
 |
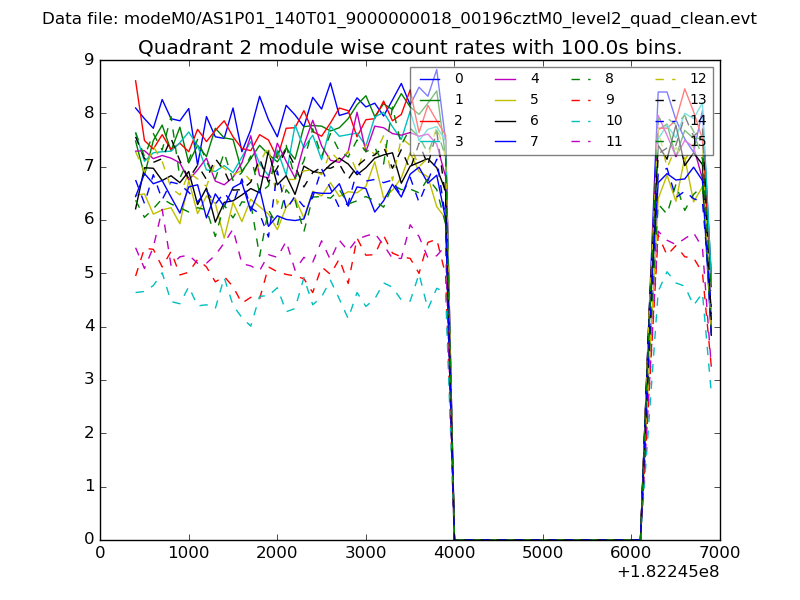
| Module-wise count rates for Quadrant B Data is divided into 100 sec bins |
 |
 |
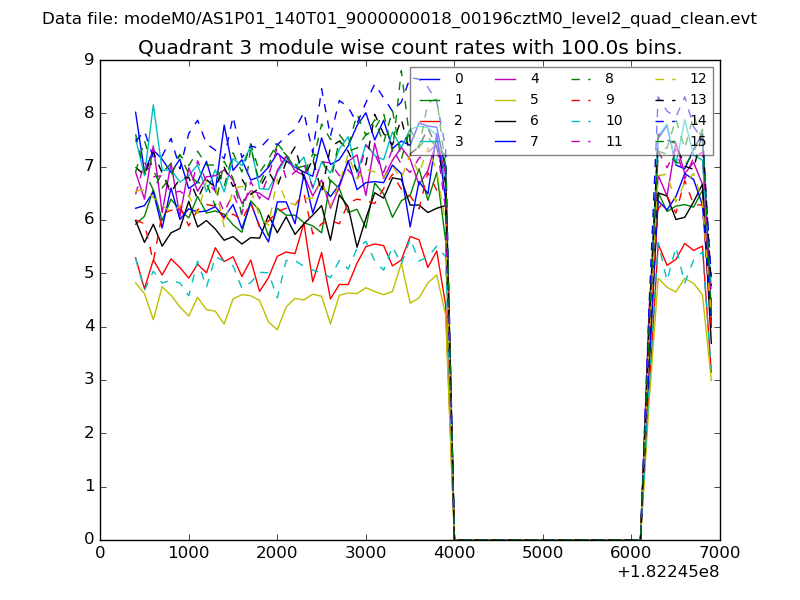
| Module-wise count rates for Quadrant C Data is divided into 100 sec bins |
 |
 |
| Module-wise count rates for Quadrant D Data is divided into 100 sec bins |
 |
 |
| Parameter | Plot |
|---|---|
| CZT HV Monitor | 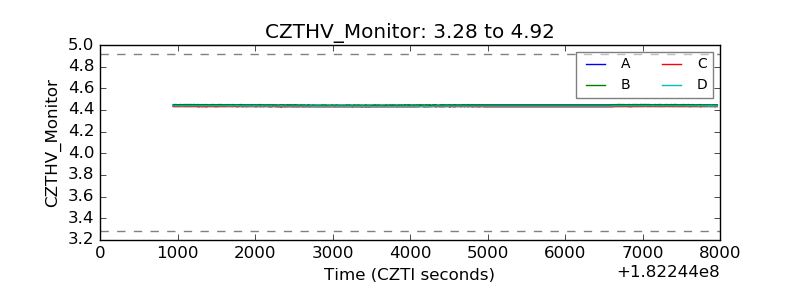 |
| D_VDD | 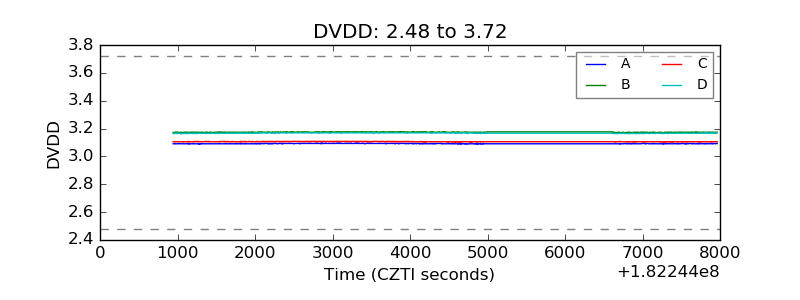 |
| Temperature 1 | 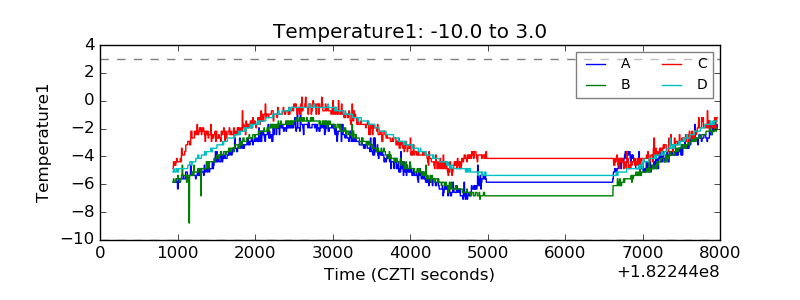 |
| Veto HV Monitor | 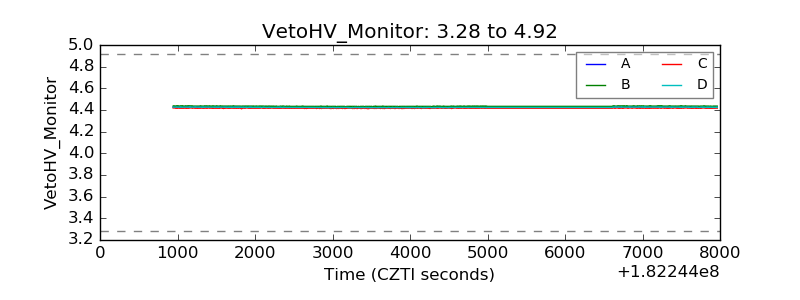 |
| Veto LLD | 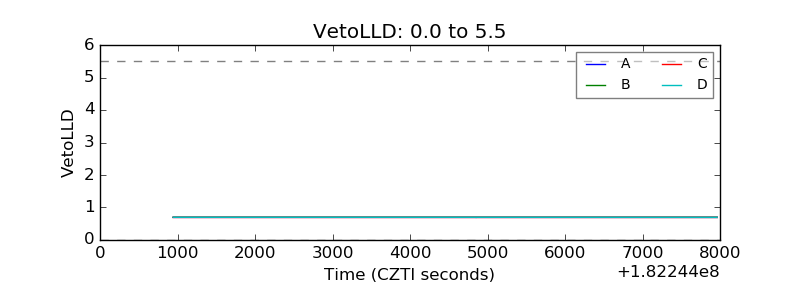 |
| Alpha Counter | 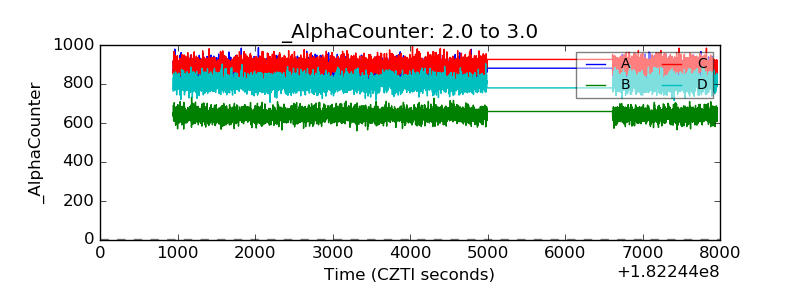 |
| _CPM_Rate | 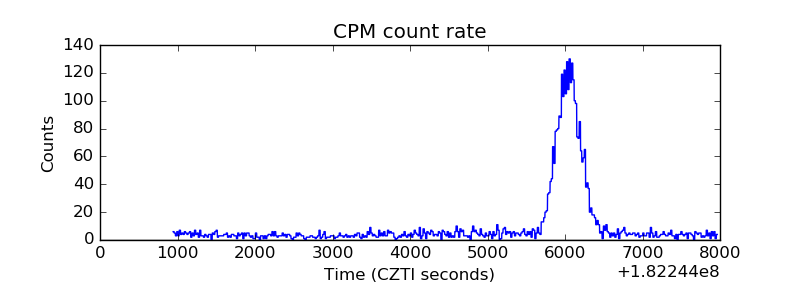 |
| CZT Counter | 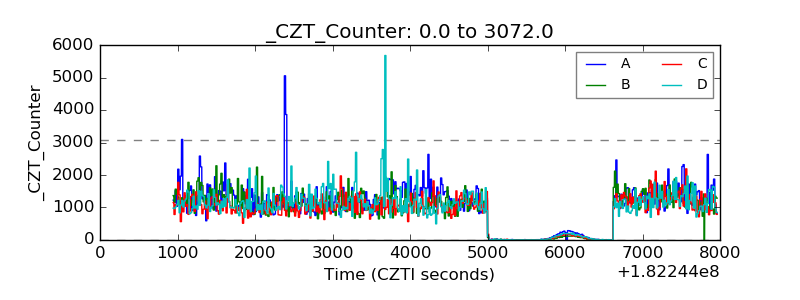 |
| +2.5 Volts monitor |  |
| +5 Volts monitor |  |
| _ROLL_ROT | 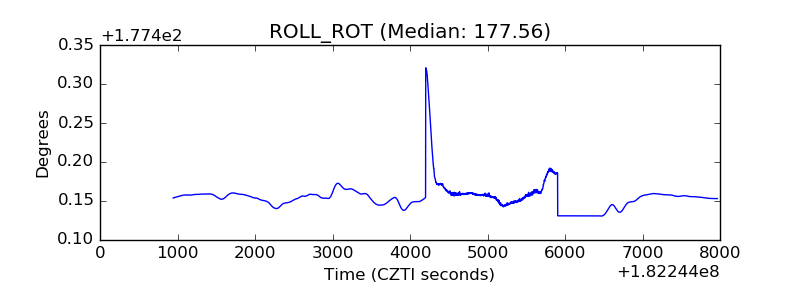 |
| _Roll_DEC | 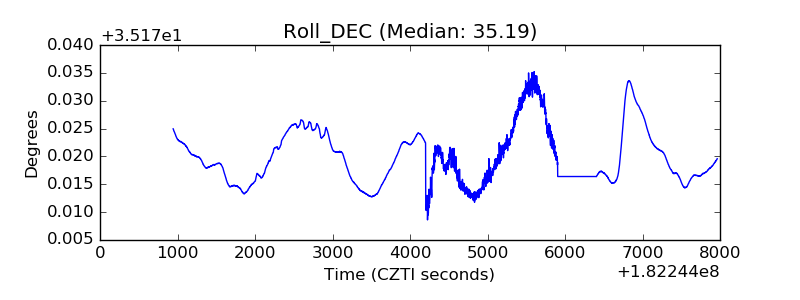 |
| _Roll_RA | 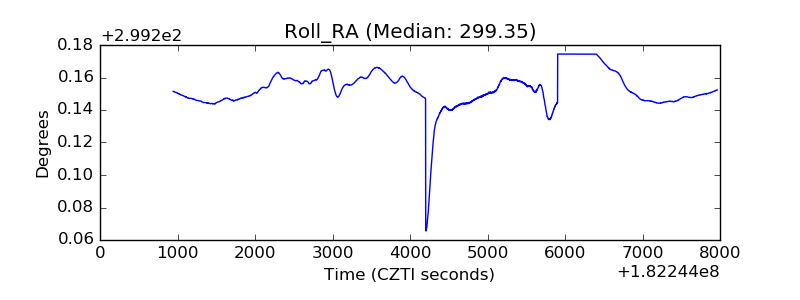 |
| Veto Counter | 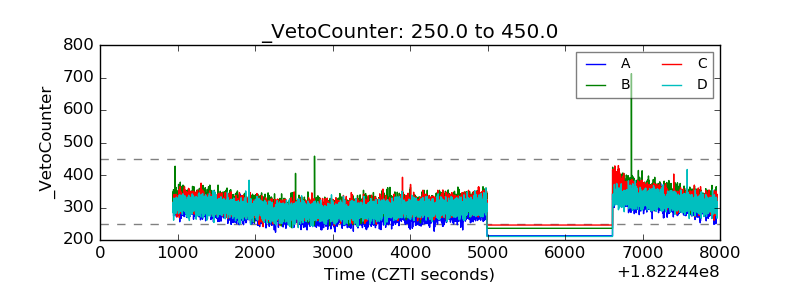 |