| Param | Original file | Final file |
|---|---|---|
| Filename | modeM0/AS1P01_140T01_9000000018_00198cztM0_level2.evt | modeM0/AS1P01_140T01_9000000018_00198cztM0_level2_quad_clean.evt |
| Size (bytes) | 1,039,867,200 | 89,498,880 |
| Size | 991.7 MB | 85.4 MB |
| Events in quadrant A | 7,418,724 | 589,516 |
| Events in quadrant B | 7,340,435 | 596,308 |
| Events in quadrant C | 6,800,882 | 569,152 |
| Events in quadrant D | 9,532,464 | 533,513 |
| Mode SS | |||
|---|---|---|---|
| Quadrant | BADHDUFLAG | Total packets | Discarded packets |
| A | 0 | 124 | 0 |
| B | 0 | 124 | 0 |
| C | 0 | 124 | 0 |
| D | 0 | 124 | 0 |
| Mode M9 | |||
|---|---|---|---|
| Quadrant | BADHDUFLAG | Total packets | Discarded packets |
| A | 0 | 16 | 0 |
| B | 0 | 16 | 0 |
| C | 0 | 16 | 0 |
| D | 0 | 16 | 0 |
| Mode M0 | |||
|---|---|---|---|
| Quadrant | BADHDUFLAG | Total packets | Discarded packets |
| A | 0 | 26398 | 3 |
| B | 0 | 26128 | 2 |
| C | 0 | 24568 | 2 |
| D | 0 | 32772 | 2 |
| Quadrant | Total seconds | Saturated seconds | Saturation percentage |
|---|---|---|---|
| A | 6084 | 4 | 0.065746% |
| B | 6049 | 3 | 0.049595% |
| C | 5967 | 21 | 0.351936% |
| D | 6040 | 709 | 11.738411% |
Noise dominated data is calculated using 1-second bins in cleaned event files. If a bin has >2000 counts, and if more than 50% of those come from <1% of pixels, then it is considered to be noise-dominated and hence unusable.
| Quadrant | # 1 sec bins | Bins with >0 counts | Bins with >2000 counts | High rate bins dominated by noise | Noise dominated (total time) | Noise dominated (detector-on time) | Marked lightcurve |
|---|---|---|---|---|---|---|---|
| A | 7706 | 6085 | 210 | 210 | 2.73% | 3.45% | 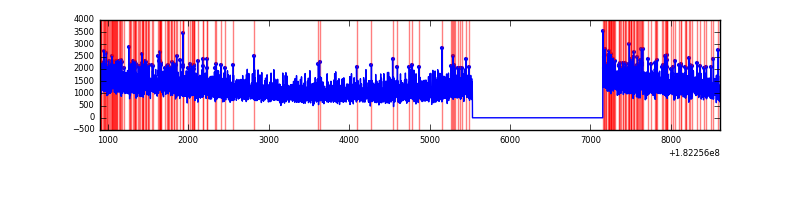 |
| B | 7706 | 6051 | 104 | 104 | 1.35% | 1.72% | 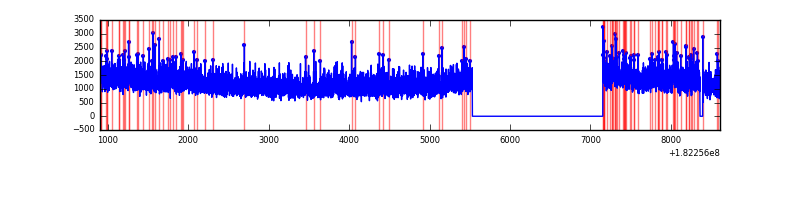 |
| C | 7706 | 5969 | 107 | 107 | 1.39% | 1.79% | 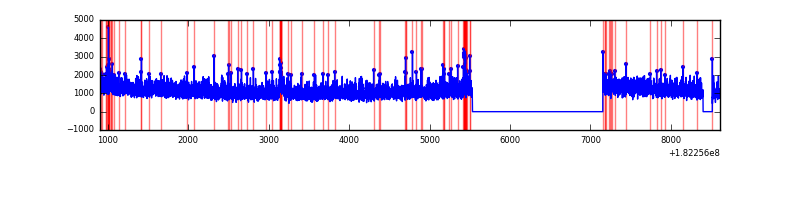 |
| D | 7706 | 6042 | 1301 | 1301 | 16.88% | 21.53% | 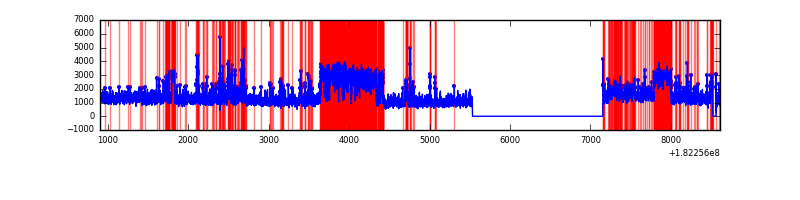 |
Top three noisy pixels from each quadrant. If the there are fewer than three noisy pixels in the level2.evt file, extra rows are filled as -1
| Pixel properties | Quadrant properties | ||||||
|---|---|---|---|---|---|---|---|
| Quadrant | DetID | PixID | Counts | Sigma | Mean | Median | Sigma |
| A | 0 | 253 | 19423 | 40.97 | 1910 | 1892 | 427.9 |
| A | 11 | 242 | 11210 | 21.78 | 1910 | 1892 | 427.9 |
| A | 0 | 166 | 9472 | 17.71 | 1910 | 1892 | 427.9 |
| B | 8 | 5 | 68365 | 151.66 | 1865 | 1877 | 438.4 |
| B | 8 | 233 | 62584 | 138.47 | 1865 | 1877 | 438.4 |
| B | 0 | 183 | 44886 | 98.1 | 1865 | 1877 | 438.4 |
| C | 0 | 188 | 78066 | 162.67 | 1673 | 1733 | 469.2 |
| C | 10 | 21 | 40196 | 81.97 | 1673 | 1733 | 469.2 |
| C | 1 | 192 | 33990 | 68.74 | 1673 | 1733 | 469.2 |
| D | 12 | 249 | 1572862 | 3083.98 | 1674 | 1727 | 509.4 |
| D | 2 | 25 | 540517 | 1057.59 | 1674 | 1727 | 509.4 |
| D | 14 | 23 | 202047 | 393.21 | 1674 | 1727 | 509.4 |
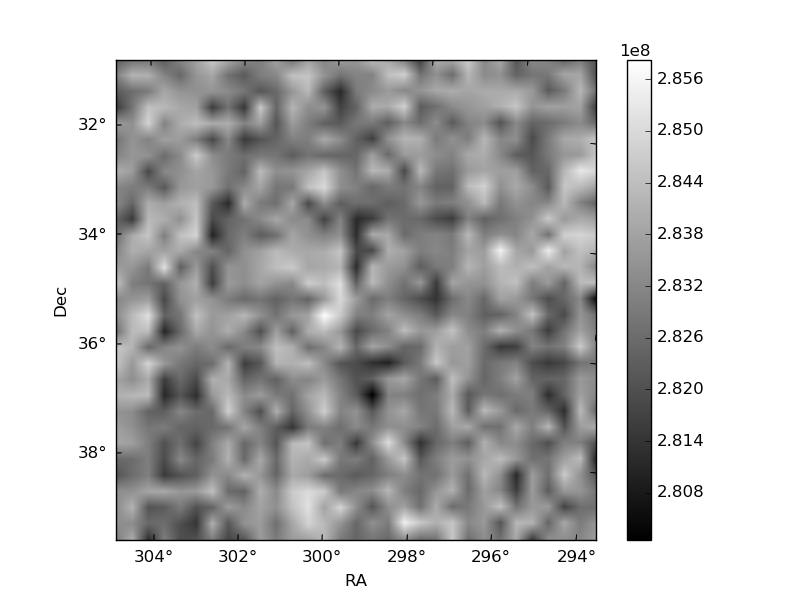
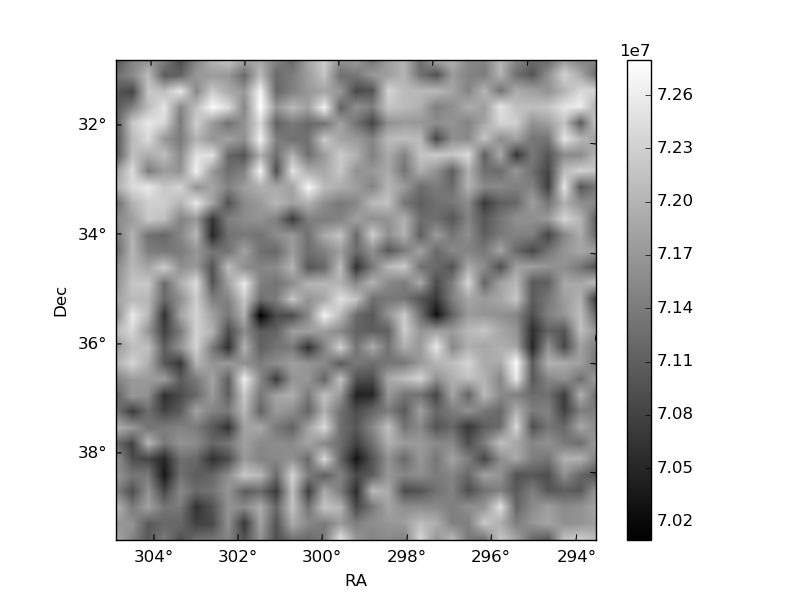
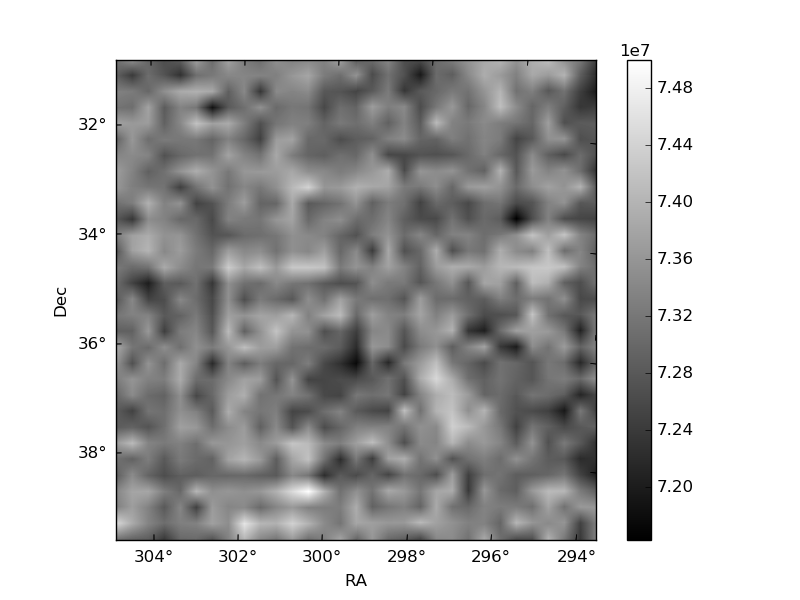
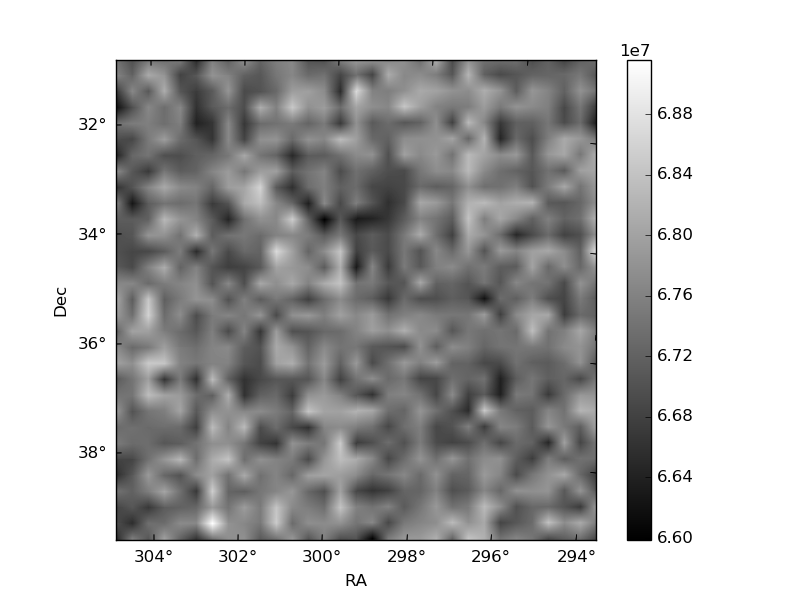
Histogram calculated using DETX and DETY for each event in the final _common_clean file
| Quadrant A | 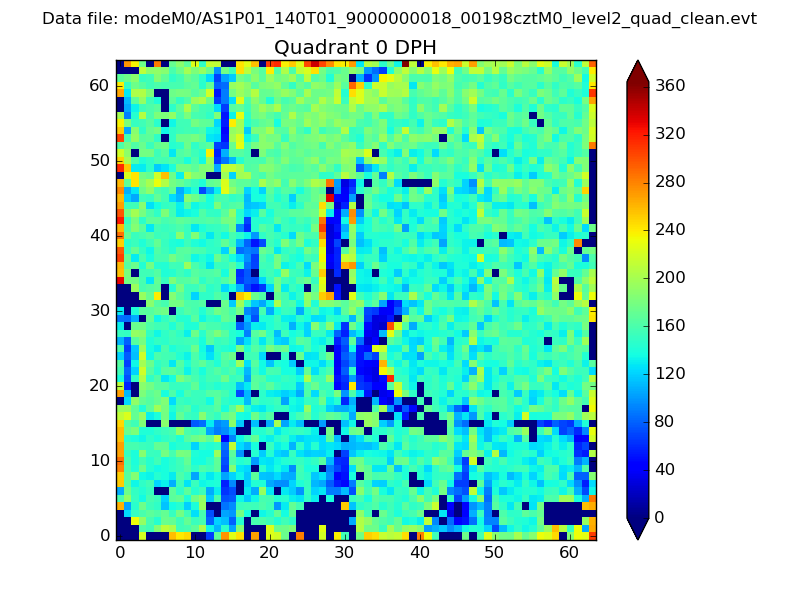 |
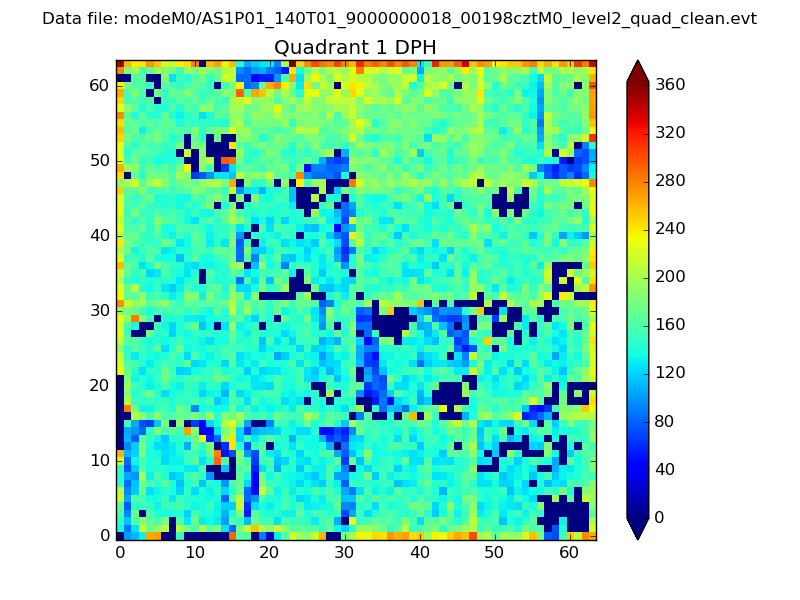 |
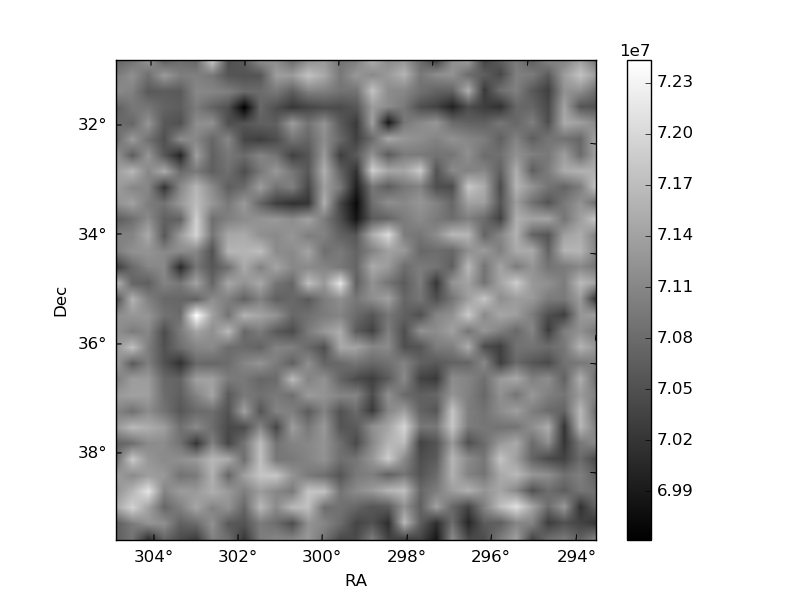
Quadrant B |
|---|---|---|---|
| Quadrant D |  |
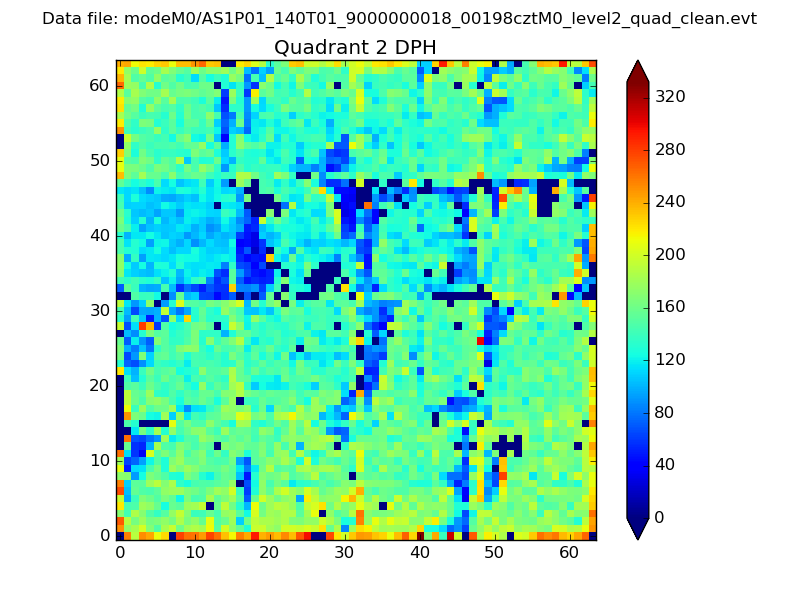 |
Quadrant C |
| Plot type | Count rate plots | Images |
|---|---|---|
| Comparison with Poisson distribution Blue bars denote a histogram of data divided into 1 sec bins. Red curve is a Poisson curve with rate = median count rate of data. |
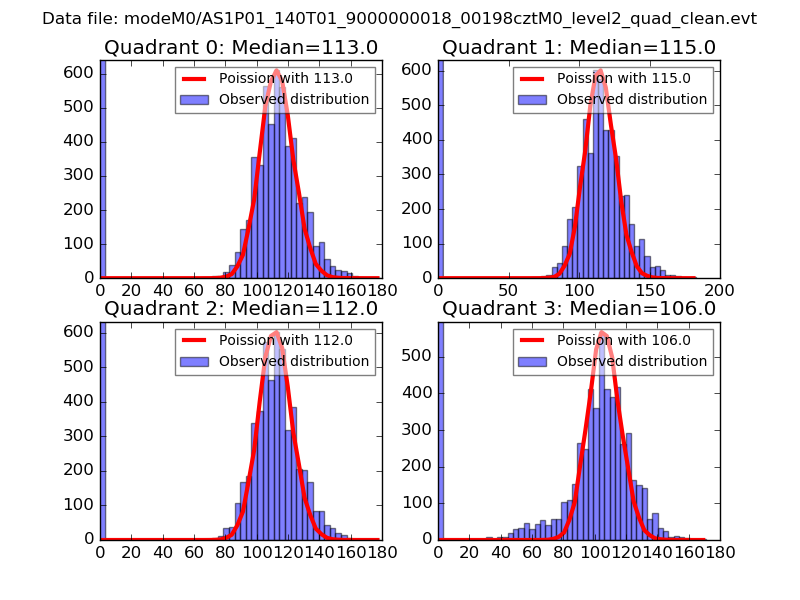 |
 |
| Quadrant-wise count rates Data is divided into 100 sec bins |
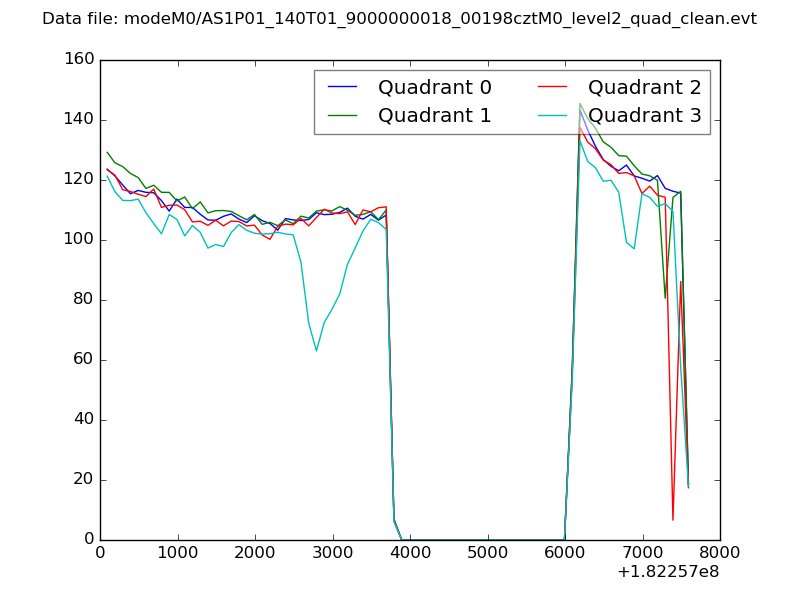 |
|
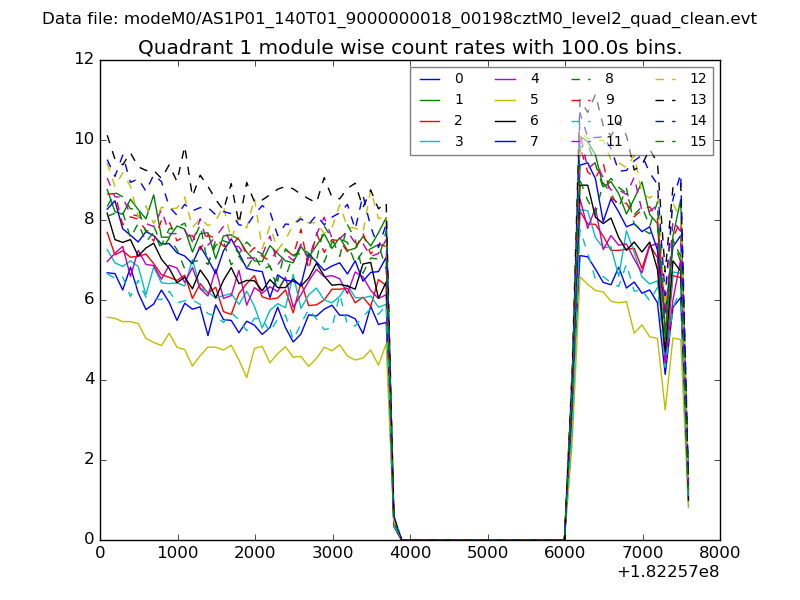
| Module-wise count rates for Quadrant A Data is divided into 100 sec bins |
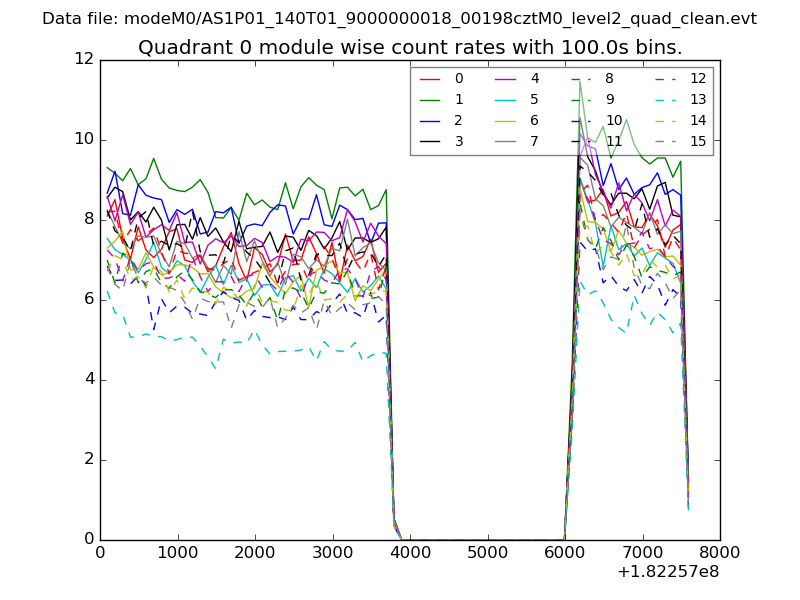 |
 |
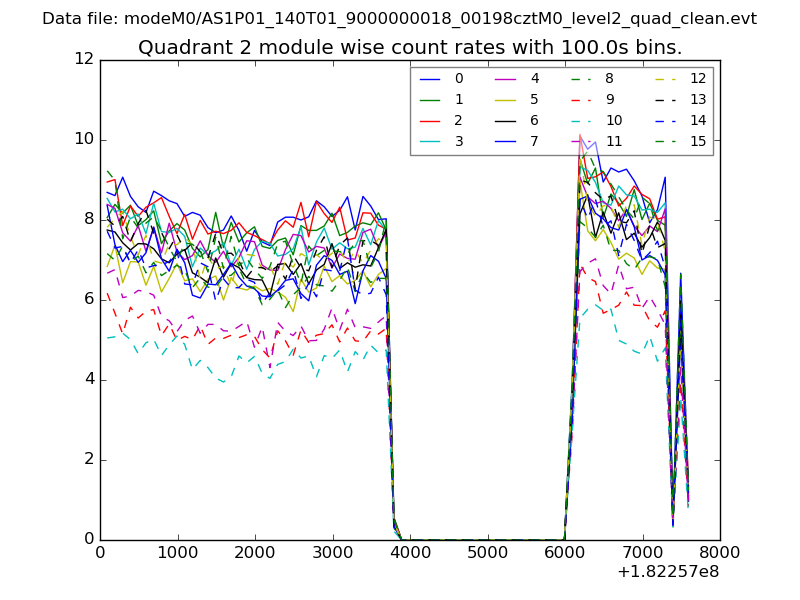
| Module-wise count rates for Quadrant B Data is divided into 100 sec bins |
 |
 |
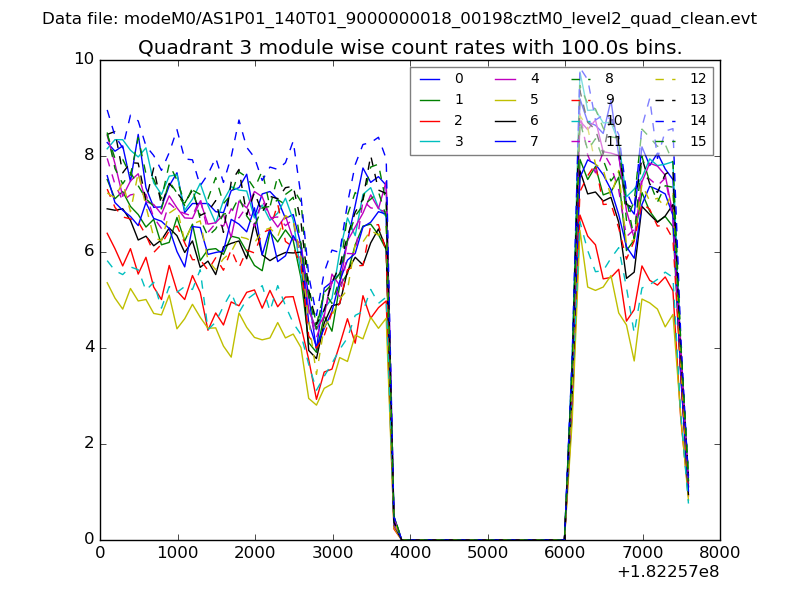
| Module-wise count rates for Quadrant C Data is divided into 100 sec bins |
 |
 |
| Module-wise count rates for Quadrant D Data is divided into 100 sec bins |
 |
 |
| Parameter | Plot |
|---|---|
| CZT HV Monitor | 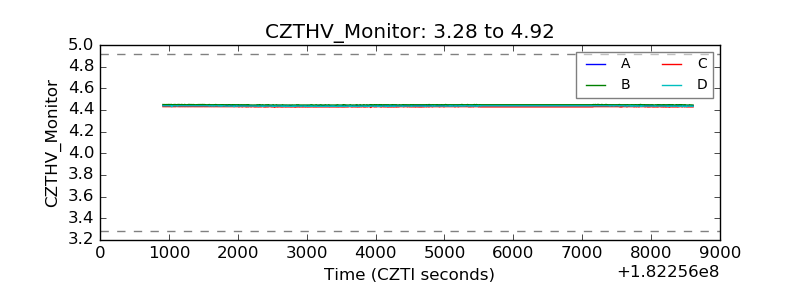 |
| D_VDD | 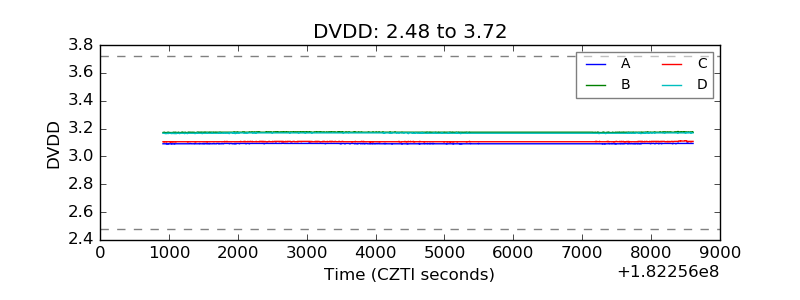 |
| Temperature 1 | 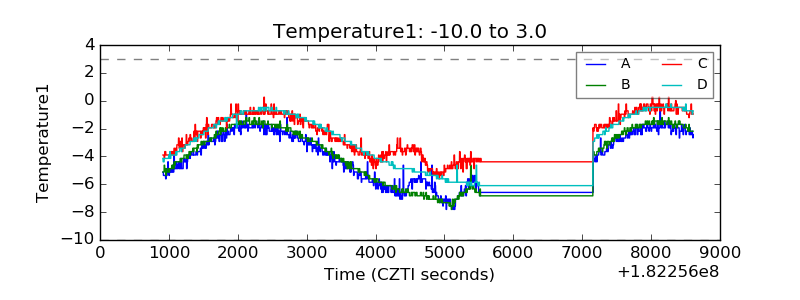 |
| Veto HV Monitor | 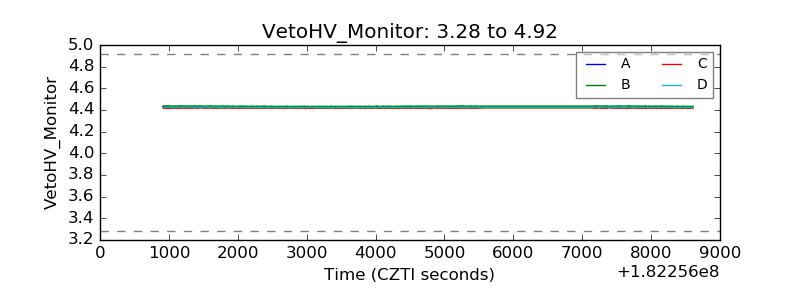 |
| Veto LLD | 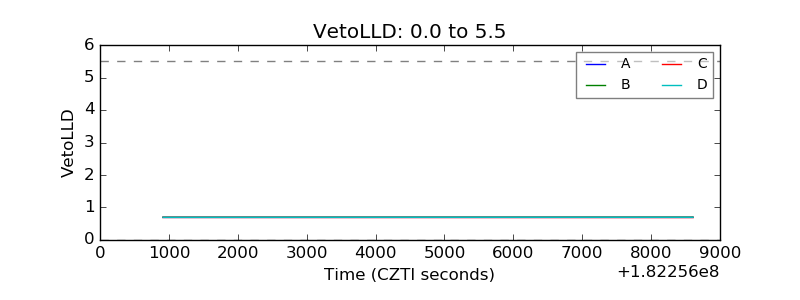 |
| Alpha Counter | 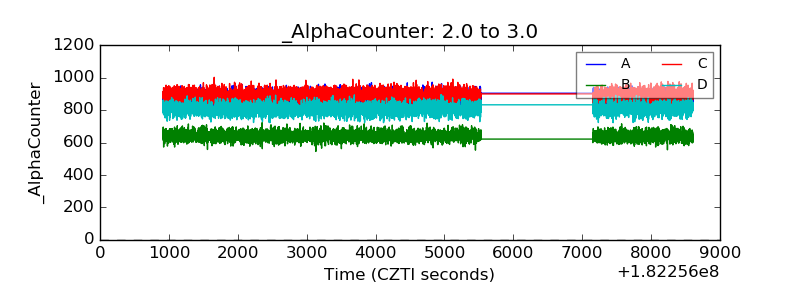 |
| _CPM_Rate | 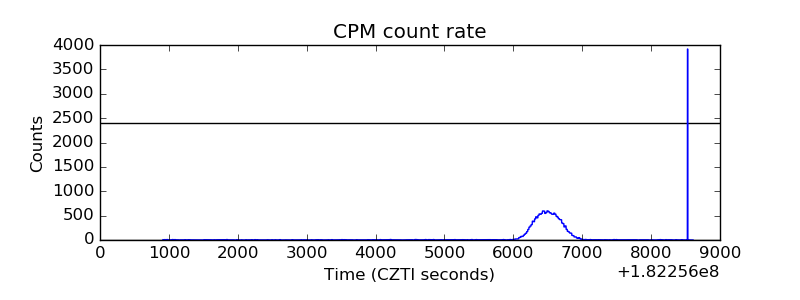 |
| CZT Counter | 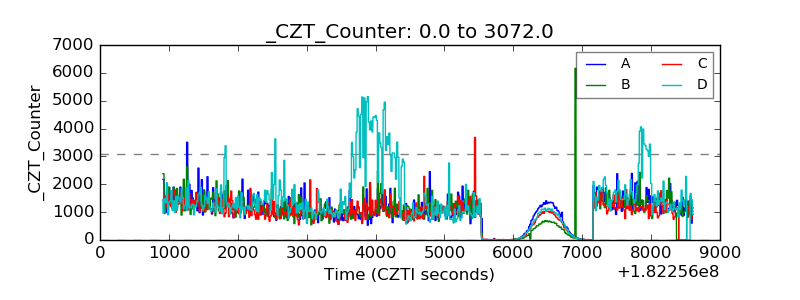 |
| +2.5 Volts monitor |  |
| +5 Volts monitor |  |
| _ROLL_ROT | 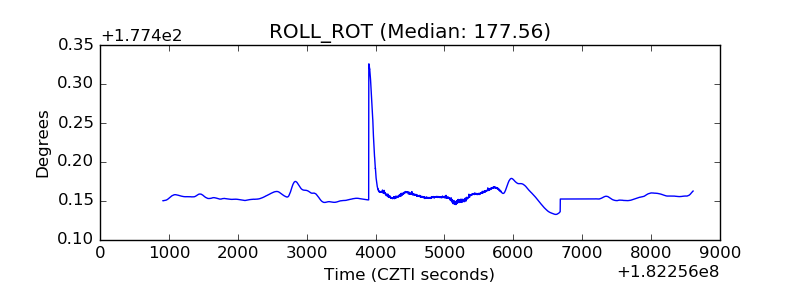 |
| _Roll_DEC | 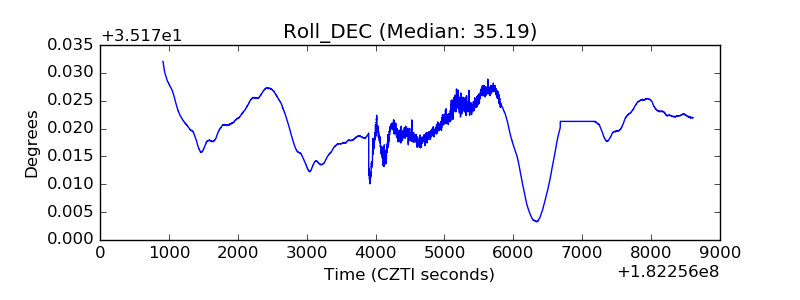 |
| _Roll_RA | 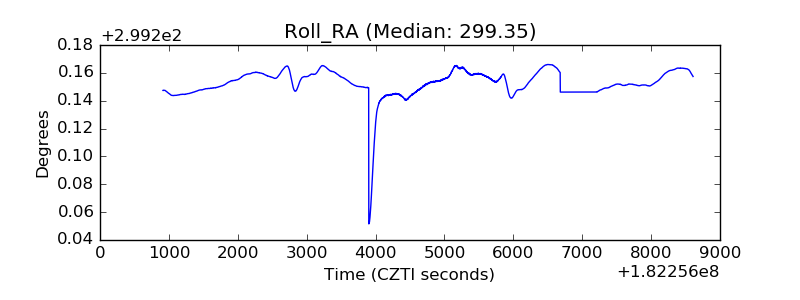 |
| Veto Counter | 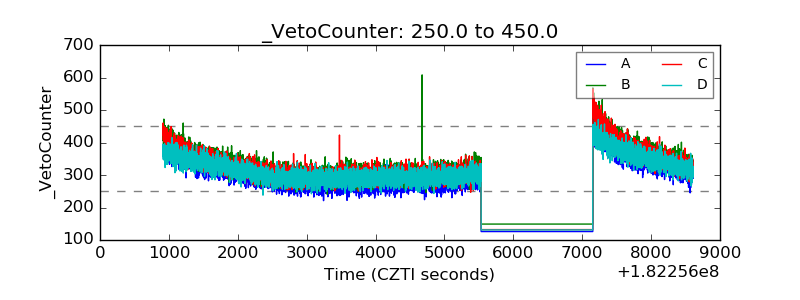 |