| Param | Original file | Final file |
|---|---|---|
| Filename | modeM0/AS1P01_140T01_9000000018_00201cztM0_level2.evt | modeM0/AS1P01_140T01_9000000018_00201cztM0_level2_quad_clean.evt |
| Size (bytes) | 933,298,560 | 82,054,080 |
| Size | 890.1 MB | 78.3 MB |
| Events in quadrant A | 7,247,019 | 524,461 |
| Events in quadrant B | 6,930,378 | 532,450 |
| Events in quadrant C | 6,473,660 | 519,174 |
| Events in quadrant D | 7,224,331 | 498,621 |
| Mode SS | |||
|---|---|---|---|
| Quadrant | BADHDUFLAG | Total packets | Discarded packets |
| A | 0 | 118 | 0 |
| B | 0 | 118 | 0 |
| C | 0 | 118 | 0 |
| D | 0 | 118 | 0 |
| Mode M9 | |||
|---|---|---|---|
| Quadrant | BADHDUFLAG | Total packets | Discarded packets |
| A | 0 | 16 | 0 |
| B | 0 | 16 | 0 |
| C | 0 | 16 | 0 |
| D | 0 | 16 | 0 |
| Mode M0 | |||
|---|---|---|---|
| Quadrant | BADHDUFLAG | Total packets | Discarded packets |
| A | 0 | 25681 | 2 |
| B | 0 | 24758 | 1 |
| C | 0 | 23429 | 1 |
| D | 0 | 25628 | 1 |
| Quadrant | Total seconds | Saturated seconds | Saturation percentage |
|---|---|---|---|
| A | 5874 | 29 | 0.493701% |
| B | 5874 | 2 | 0.034048% |
| C | 5874 | 2 | 0.034048% |
| D | 5874 | 50 | 0.851209% |
Noise dominated data is calculated using 1-second bins in cleaned event files. If a bin has >2000 counts, and if more than 50% of those come from <1% of pixels, then it is considered to be noise-dominated and hence unusable.
| Quadrant | # 1 sec bins | Bins with >0 counts | Bins with >2000 counts | High rate bins dominated by noise | Noise dominated (total time) | Noise dominated (detector-on time) | Marked lightcurve |
|---|---|---|---|---|---|---|---|
| A | 7466 | 5876 | 329 | 329 | 4.41% | 5.60% | 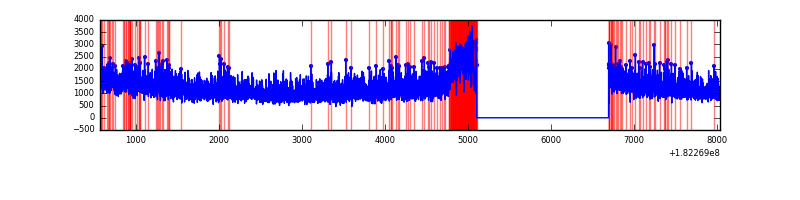 |
| B | 7466 | 5876 | 85 | 85 | 1.14% | 1.45% | 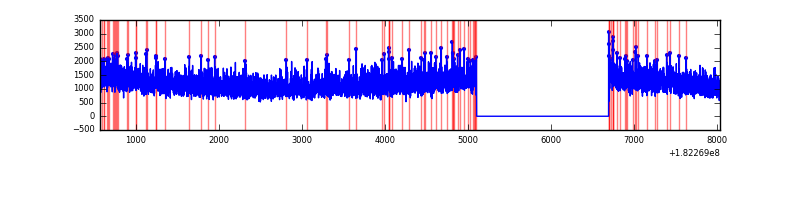 |
| C | 7466 | 5876 | 49 | 49 | 0.66% | 0.83% | 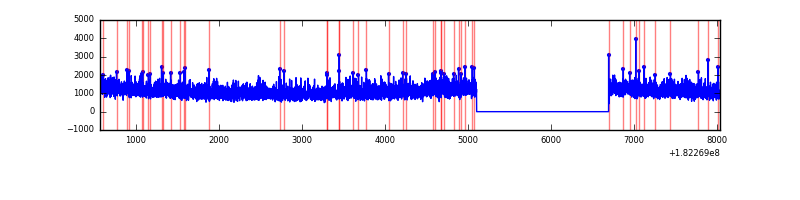 |
| D | 7466 | 5876 | 253 | 253 | 3.39% | 4.31% | 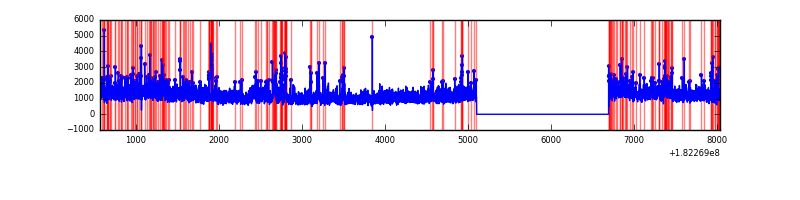 |
Top three noisy pixels from each quadrant. If the there are fewer than three noisy pixels in the level2.evt file, extra rows are filled as -1
| Pixel properties | Quadrant properties | ||||||
|---|---|---|---|---|---|---|---|
| Quadrant | DetID | PixID | Counts | Sigma | Mean | Median | Sigma |
| A | 0 | 6 | 359828 | 934.75 | 1766 | 1749 | 383.1 |
| A | 0 | 253 | 25526 | 62.07 | 1766 | 1749 | 383.1 |
| A | 5 | 244 | 13900 | 31.72 | 1766 | 1749 | 383.1 |
| B | 5 | 47 | 58860 | 138.92 | 1776 | 1782 | 410.9 |
| B | 0 | 120 | 19569 | 43.29 | 1776 | 1782 | 410.9 |
| B | 5 | 85 | 14123 | 30.04 | 1776 | 1782 | 410.9 |
| C | 10 | 38 | 14352 | 27.61 | 1638 | 1699 | 458.3 |
| C | 9 | 162 | 9125 | 16.2 | 1638 | 1699 | 458.3 |
| C | 10 | 21 | 6623 | 10.74 | 1638 | 1699 | 458.3 |
| D | 1 | 4 | 236971 | 484.06 | 1614 | 1666 | 486.1 |
| D | 10 | 182 | 117282 | 237.84 | 1614 | 1666 | 486.1 |
| D | 14 | 23 | 106409 | 215.47 | 1614 | 1666 | 486.1 |
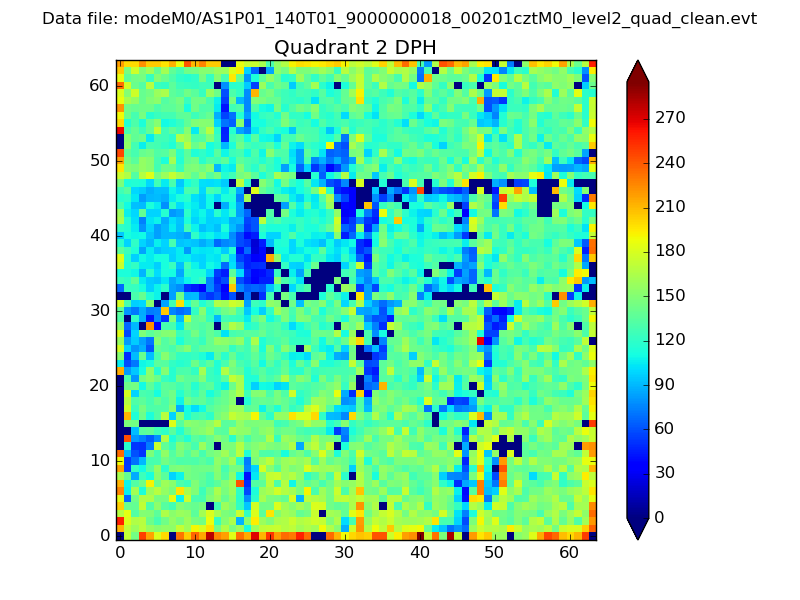
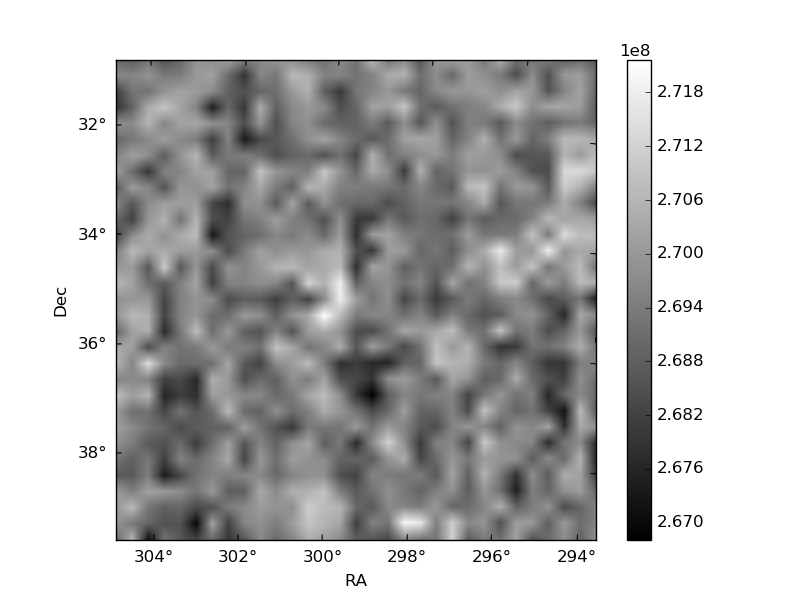
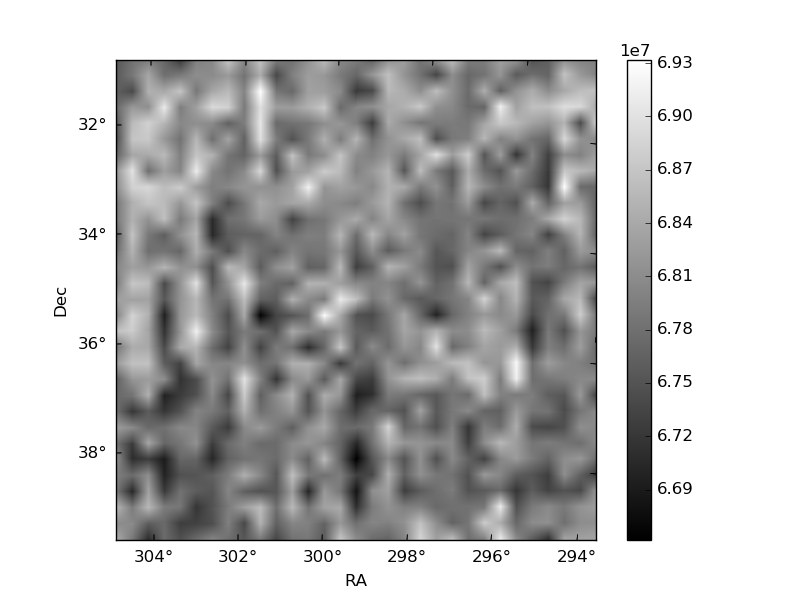
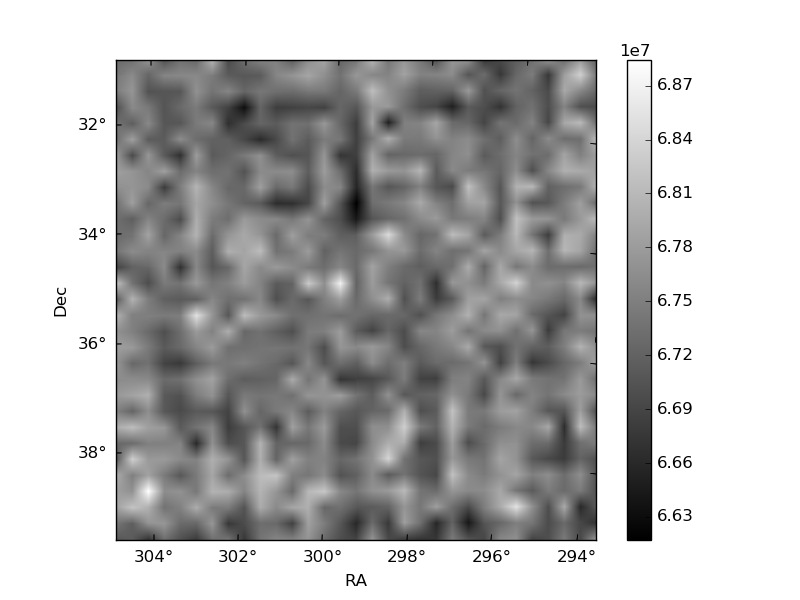
Histogram calculated using DETX and DETY for each event in the final _common_clean file
| Quadrant A | 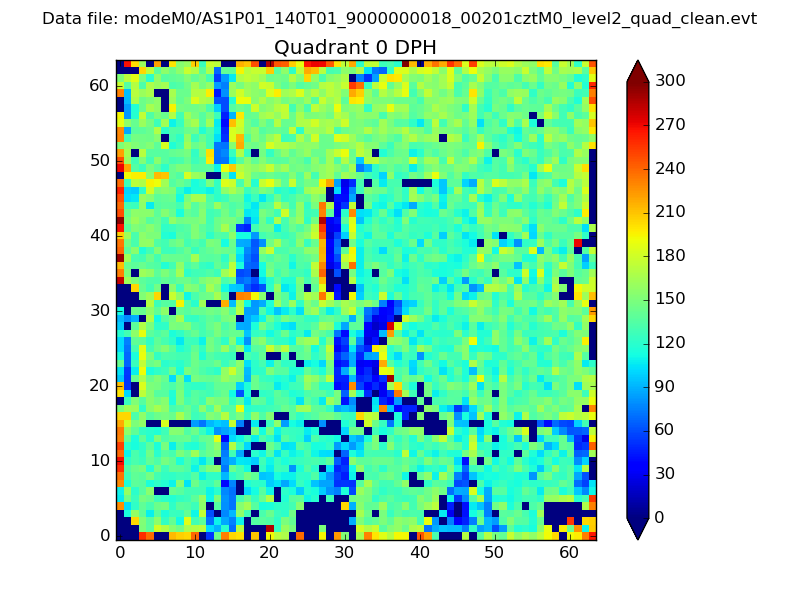 |
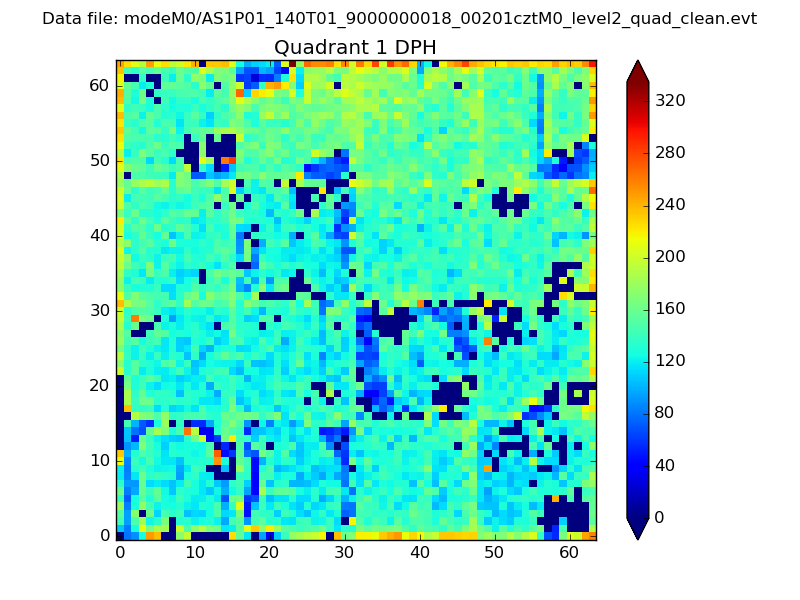 |
Quadrant B |
|---|---|---|---|
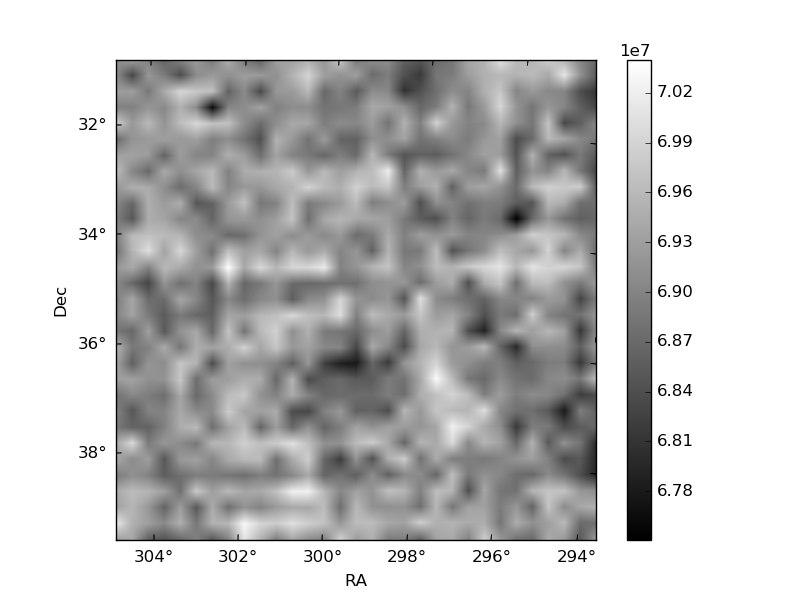
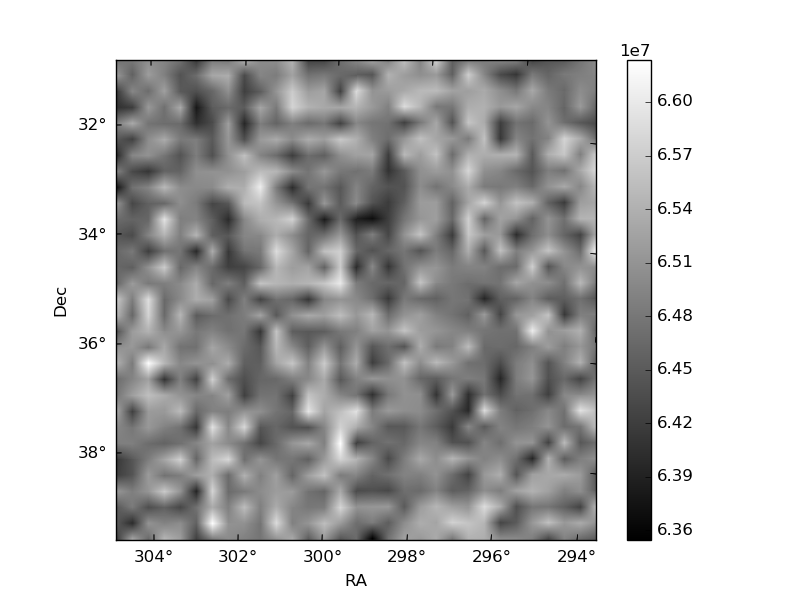
| Quadrant D | 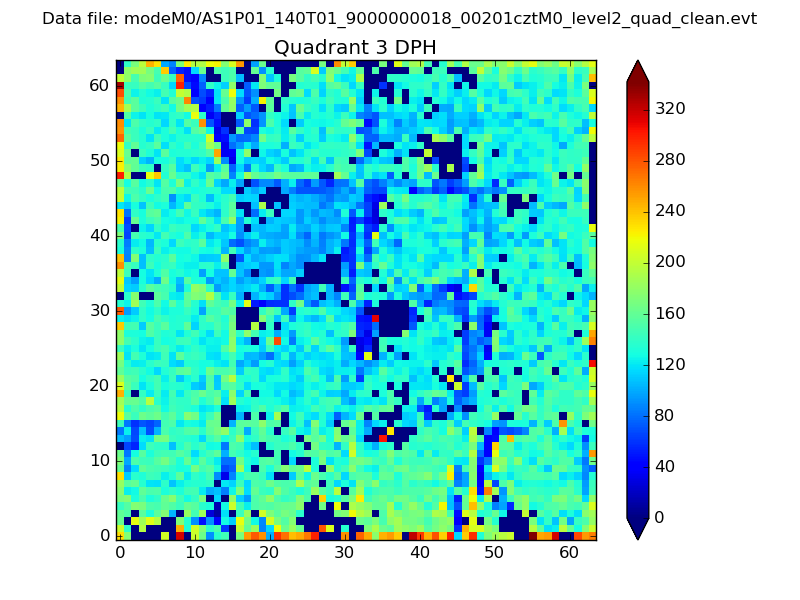 |
 |
Quadrant C |
| Plot type | Count rate plots | Images |
|---|---|---|
| Comparison with Poisson distribution Blue bars denote a histogram of data divided into 1 sec bins. Red curve is a Poisson curve with rate = median count rate of data. |
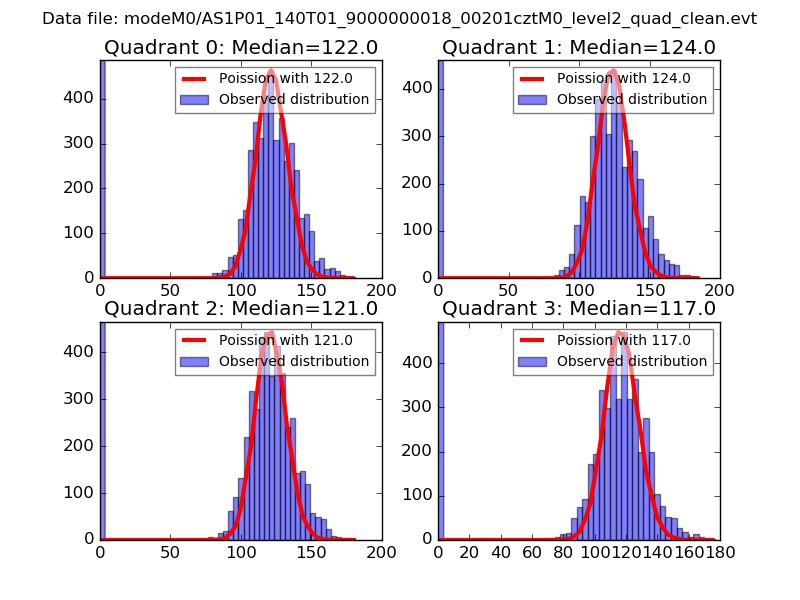 |
 |
| Quadrant-wise count rates Data is divided into 100 sec bins |
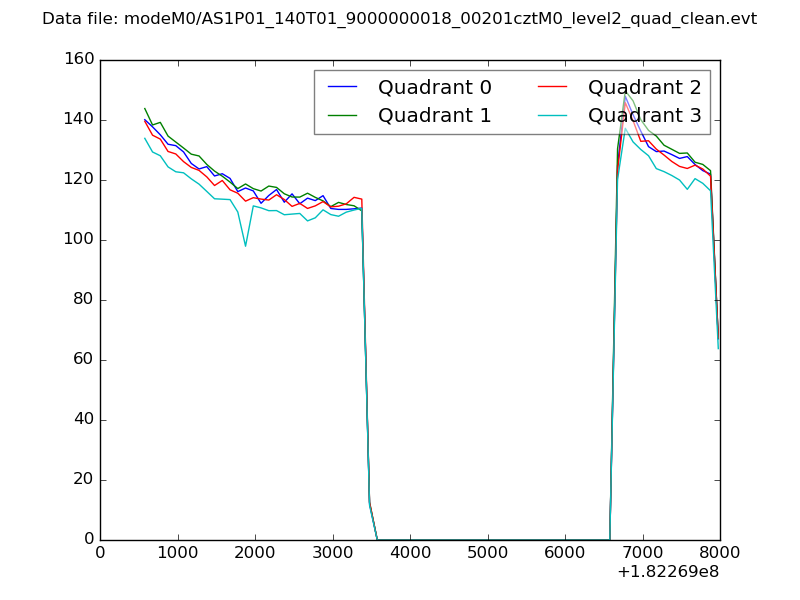 |
|
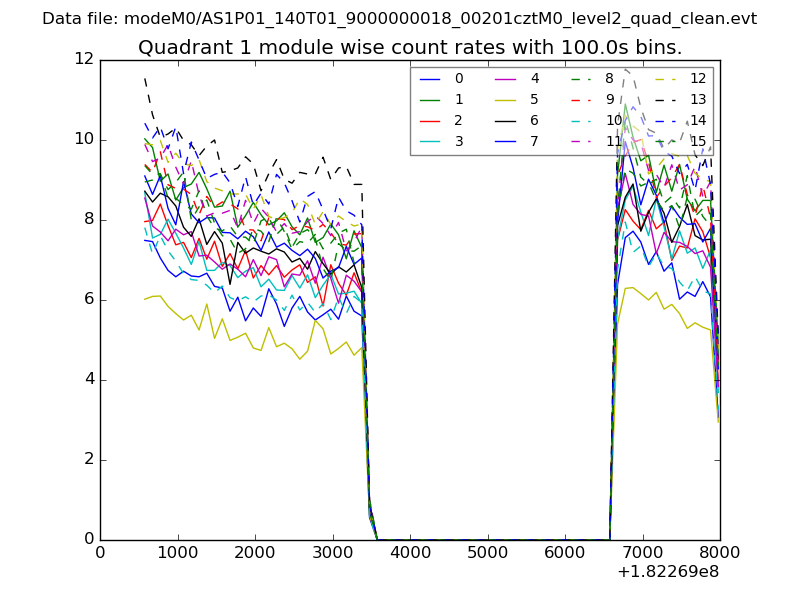
| Module-wise count rates for Quadrant A Data is divided into 100 sec bins |
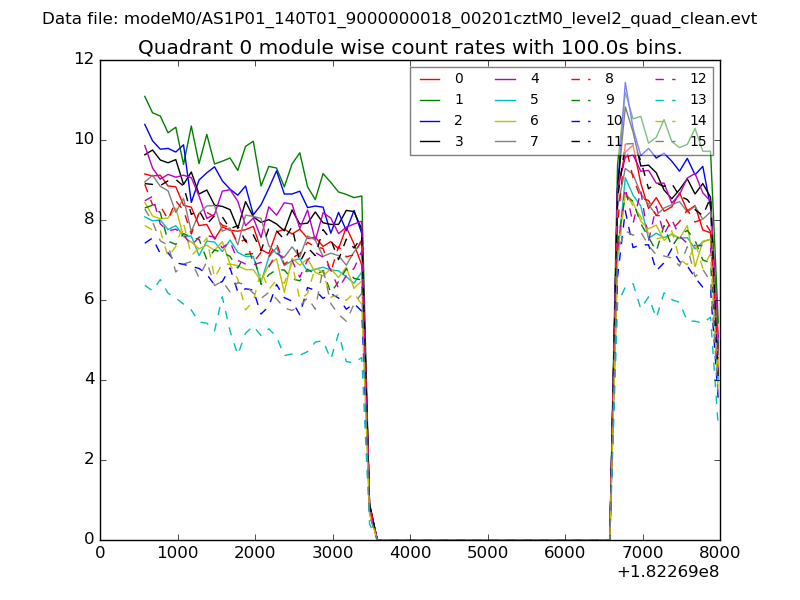 |
 |
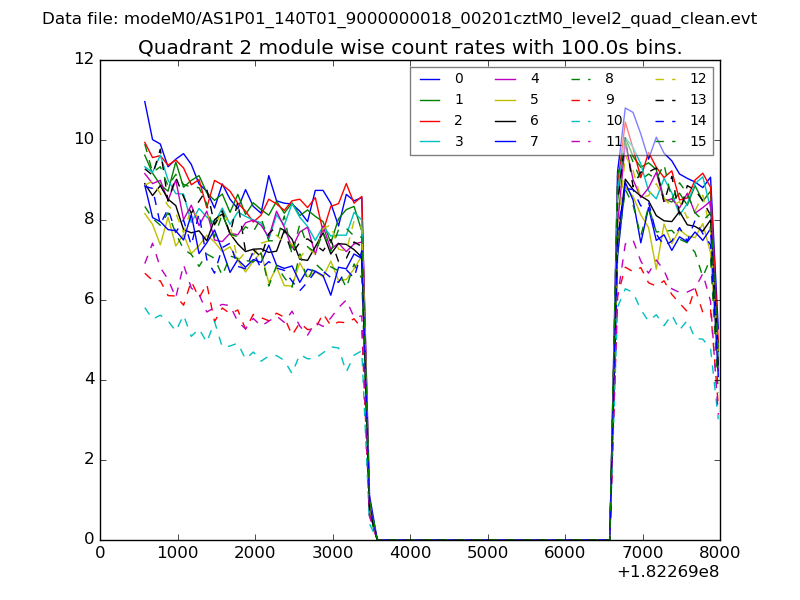
| Module-wise count rates for Quadrant B Data is divided into 100 sec bins |
 |
 |
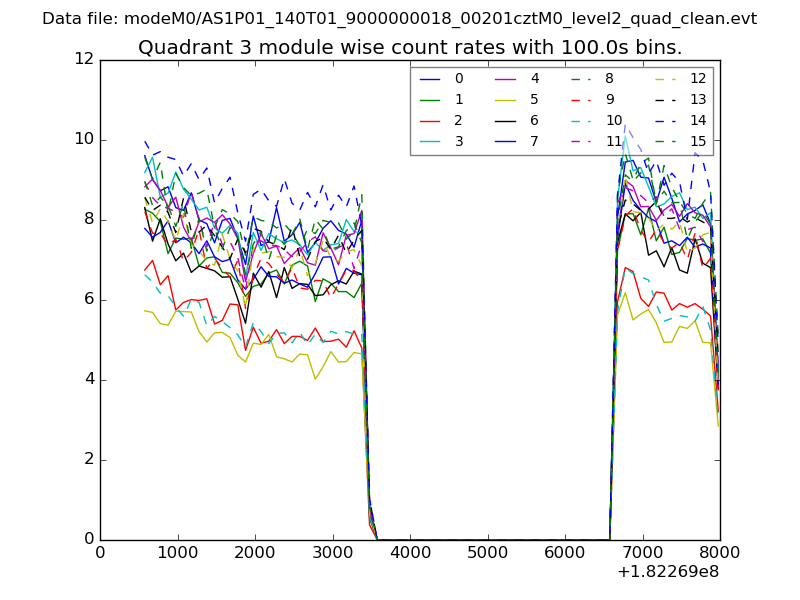
| Module-wise count rates for Quadrant C Data is divided into 100 sec bins |
 |
 |
| Module-wise count rates for Quadrant D Data is divided into 100 sec bins |
 |
 |
| Parameter | Plot |
|---|---|
| CZT HV Monitor | 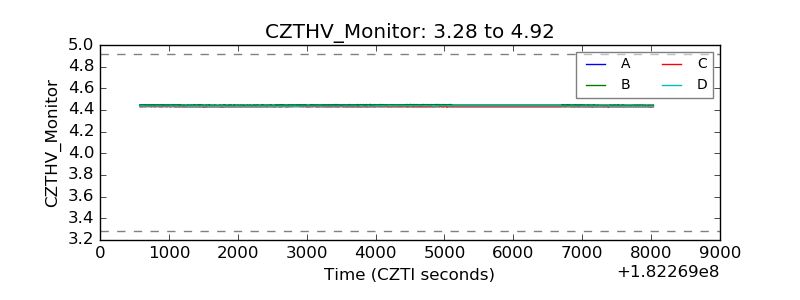 |
| D_VDD | 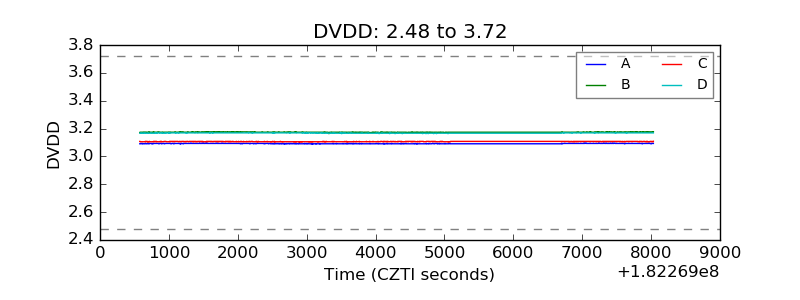 |
| Temperature 1 | 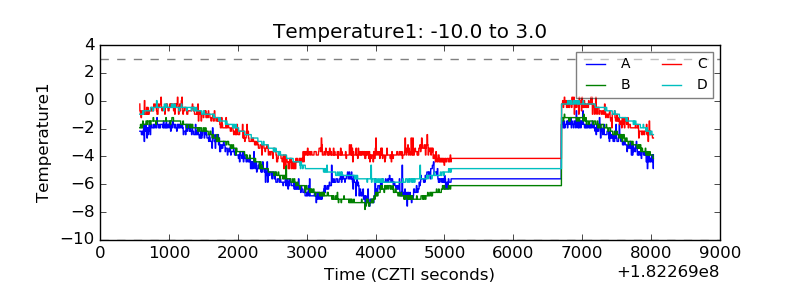 |
| Veto HV Monitor | 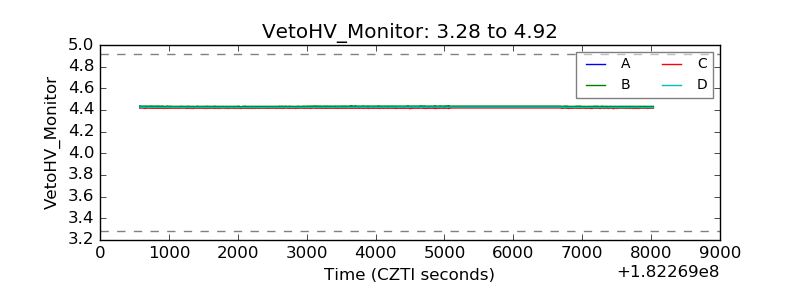 |
| Veto LLD | 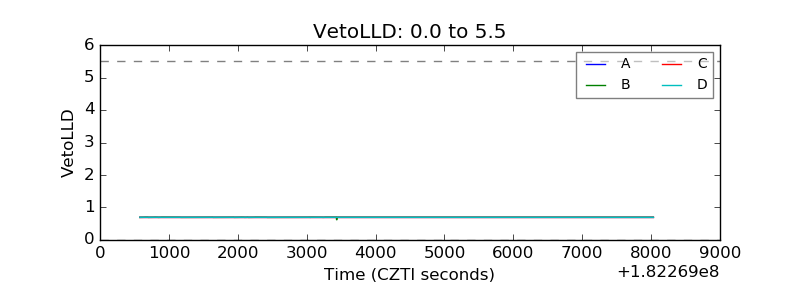 |
| Alpha Counter | 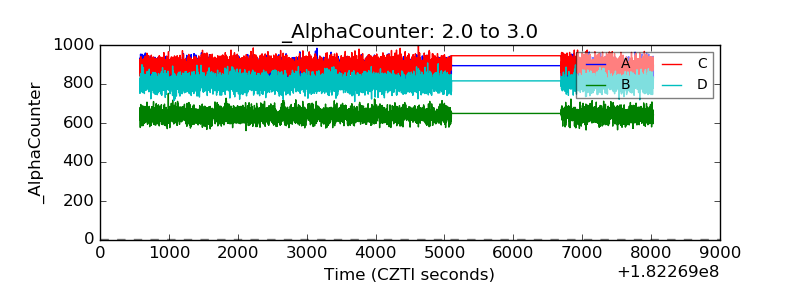 |
| _CPM_Rate | 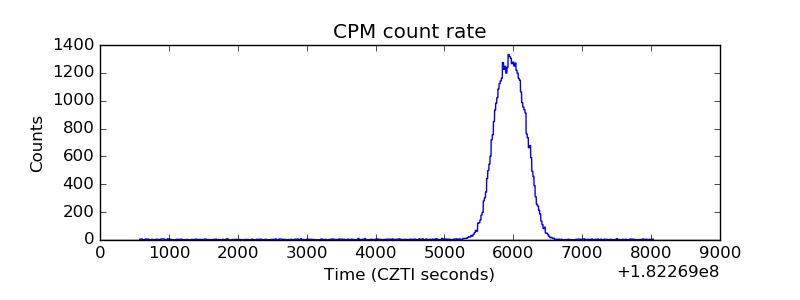 |
| CZT Counter | 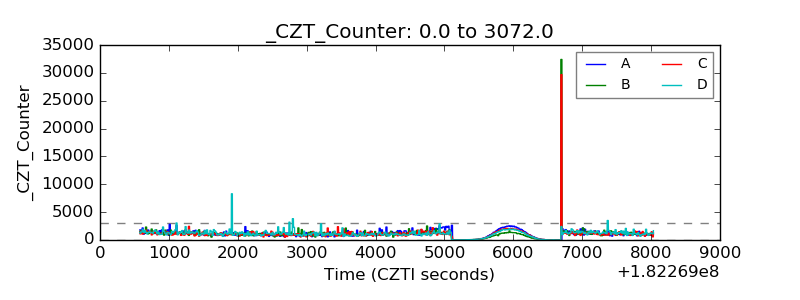 |
| +2.5 Volts monitor |  |
| +5 Volts monitor |  |
| _ROLL_ROT | 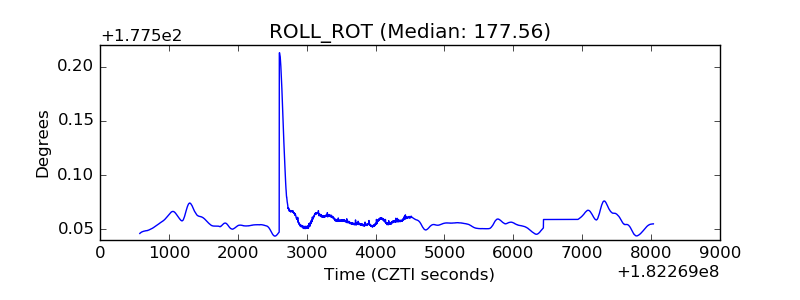 |
| _Roll_DEC | 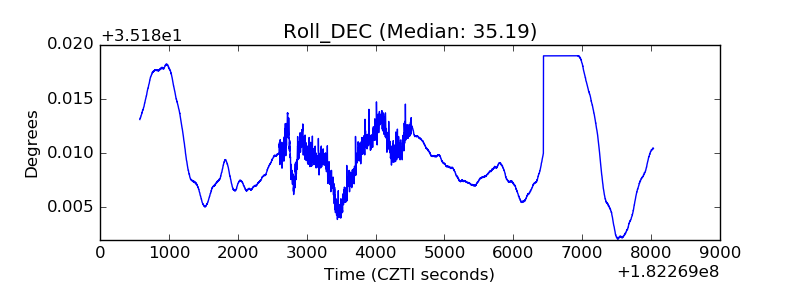 |
| _Roll_RA | 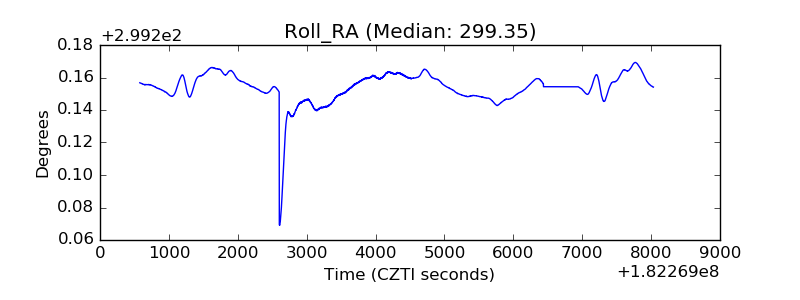 |
| Veto Counter | 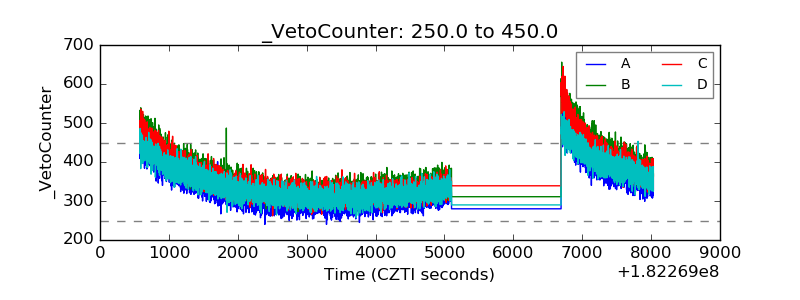 |