| Param | Original file | Final file |
|---|---|---|
| Filename | modeM0/AS1P01_140T01_9000000018_00202cztM0_level2.evt | modeM0/AS1P01_140T01_9000000018_00202cztM0_level2_quad_clean.evt |
| Size (bytes) | 864,331,200 | 71,354,880 |
| Size | 824.3 MB | 68.0 MB |
| Events in quadrant A | 6,523,113 | 444,373 |
| Events in quadrant B | 6,522,104 | 454,967 |
| Events in quadrant C | 6,178,791 | 444,273 |
| Events in quadrant D | 6,578,496 | 423,893 |
| Mode SS | |||
|---|---|---|---|
| Quadrant | BADHDUFLAG | Total packets | Discarded packets |
| A | 0 | 114 | 0 |
| B | 0 | 114 | 0 |
| C | 0 | 114 | 0 |
| D | 0 | 114 | 0 |
| Mode M9 | |||
|---|---|---|---|
| Quadrant | BADHDUFLAG | Total packets | Discarded packets |
| A | 0 | 17 | 0 |
| B | 0 | 17 | 0 |
| C | 0 | 17 | 0 |
| D | 0 | 17 | 0 |
| Mode M0 | |||
|---|---|---|---|
| Quadrant | BADHDUFLAG | Total packets | Discarded packets |
| A | 0 | 23383 | 2 |
| B | 0 | 23369 | 1 |
| C | 0 | 22344 | 1 |
| D | 0 | 23565 | 1 |
| Quadrant | Total seconds | Saturated seconds | Saturation percentage |
|---|---|---|---|
| A | 5620 | 4 | 0.071174% |
| B | 5620 | 3 | 0.053381% |
| C | 5620 | 4 | 0.071174% |
| D | 5620 | 48 | 0.854093% |
Noise dominated data is calculated using 1-second bins in cleaned event files. If a bin has >2000 counts, and if more than 50% of those come from <1% of pixels, then it is considered to be noise-dominated and hence unusable.
| Quadrant | # 1 sec bins | Bins with >0 counts | Bins with >2000 counts | High rate bins dominated by noise | Noise dominated (total time) | Noise dominated (detector-on time) | Marked lightcurve |
|---|---|---|---|---|---|---|---|
| A | 7242 | 5622 | 139 | 139 | 1.92% | 2.47% |  |
| B | 7242 | 5622 | 60 | 60 | 0.83% | 1.07% |  |
| C | 7242 | 5622 | 40 | 40 | 0.55% | 0.71% | 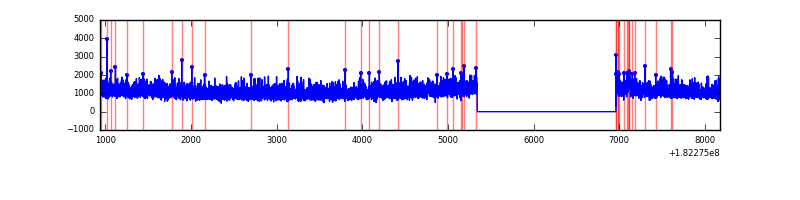 |
| D | 7242 | 5622 | 198 | 198 | 2.73% | 3.52% |  |
Top three noisy pixels from each quadrant. If the there are fewer than three noisy pixels in the level2.evt file, extra rows are filled as -1
| Pixel properties | Quadrant properties | ||||||
|---|---|---|---|---|---|---|---|
| Quadrant | DetID | PixID | Counts | Sigma | Mean | Median | Sigma |
| A | 0 | 6 | 40429 | 106.67 | 1665 | 1649 | 363.6 |
| A | 13 | 17 | 12934 | 31.04 | 1665 | 1649 | 363.6 |
| A | 12 | 189 | 11731 | 27.73 | 1665 | 1649 | 363.6 |
| B | 0 | 120 | 15646 | 35.93 | 1685 | 1698 | 388.2 |
| B | 5 | 85 | 14116 | 31.99 | 1685 | 1698 | 388.2 |
| B | 5 | 47 | 12214 | 27.09 | 1685 | 1698 | 388.2 |
| C | 0 | 186 | 26955 | 58.74 | 1556 | 1611 | 431.5 |
| C | 9 | 188 | 15036 | 31.11 | 1556 | 1611 | 431.5 |
| C | 14 | 236 | 9466 | 18.2 | 1556 | 1611 | 431.5 |
| D | 14 | 23 | 146114 | 313.05 | 1525 | 1572 | 461.7 |
| D | 1 | 4 | 85854 | 182.54 | 1525 | 1572 | 461.7 |
| D | 13 | 117 | 82750 | 175.82 | 1525 | 1572 | 461.7 |
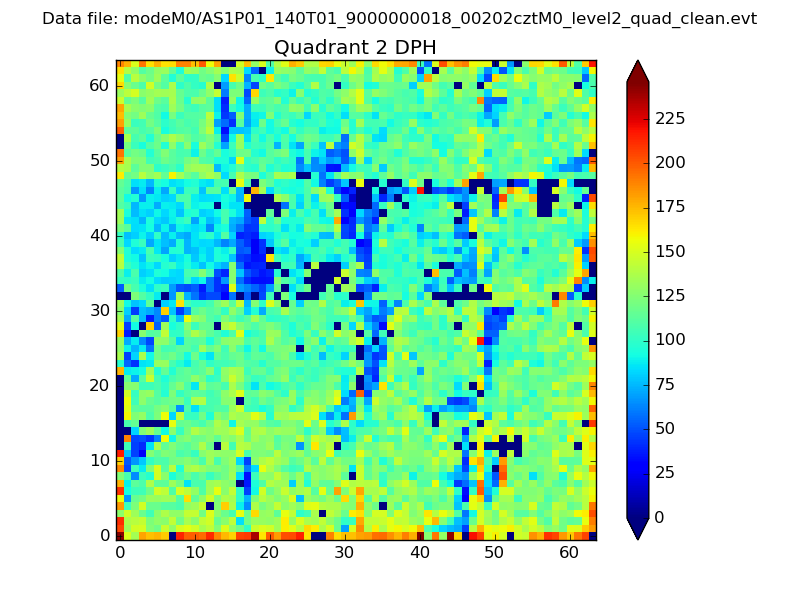
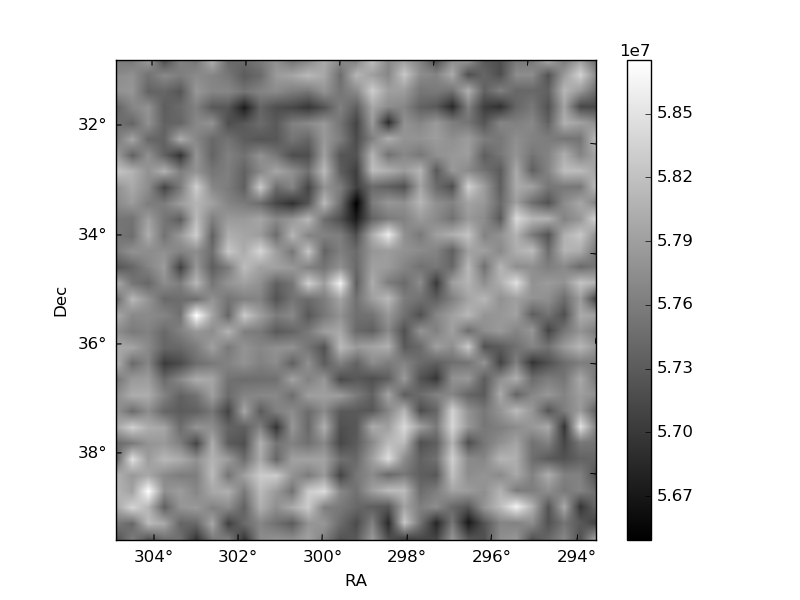
Histogram calculated using DETX and DETY for each event in the final _common_clean file
| Quadrant A | 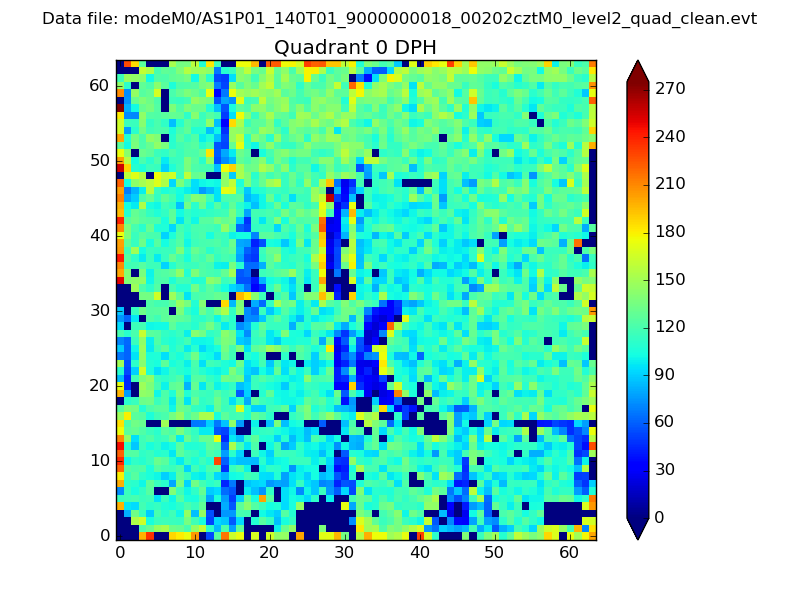 |
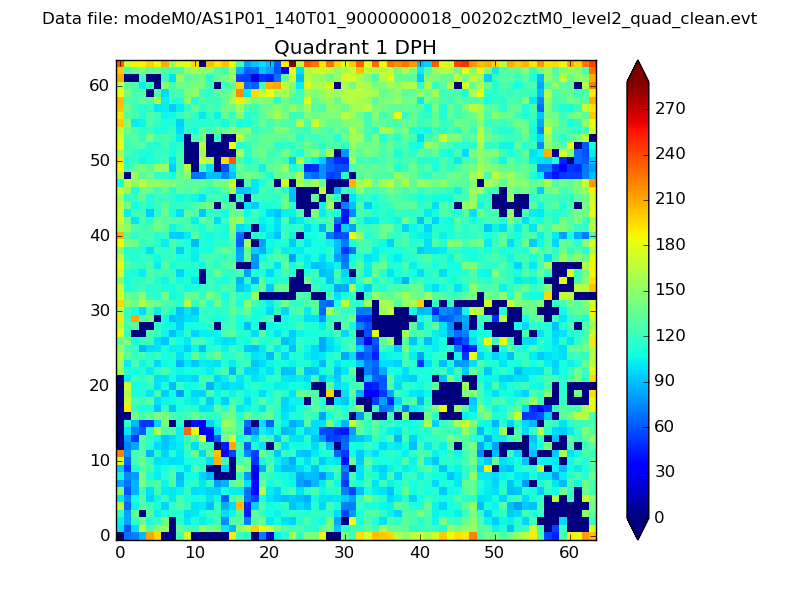 |
Quadrant B |
|---|---|---|---|
| Quadrant D | 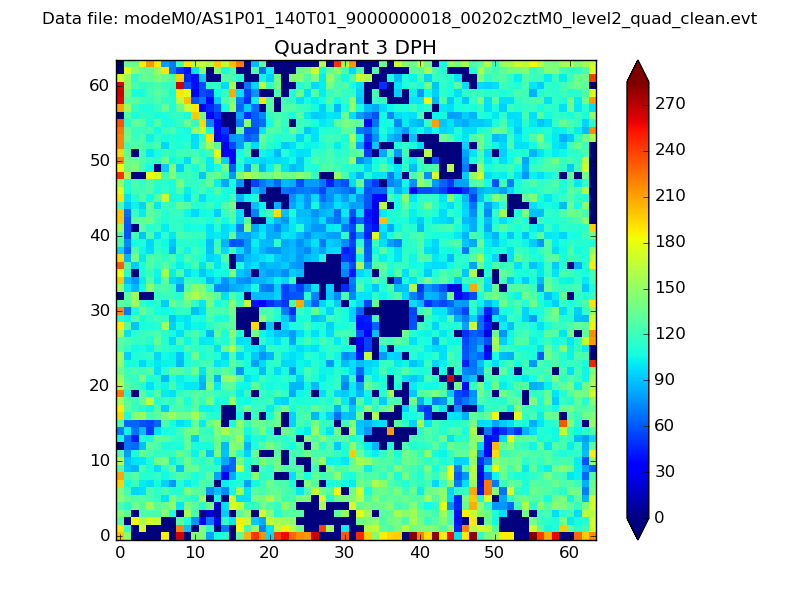 |
 |
Quadrant C |
| Plot type | Count rate plots | Images |
|---|---|---|
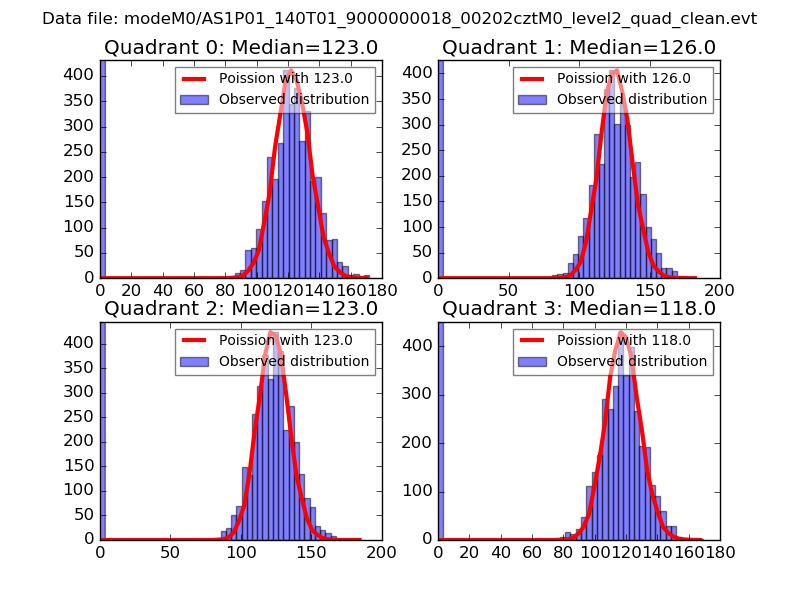
| Comparison with Poisson distribution Blue bars denote a histogram of data divided into 1 sec bins. Red curve is a Poisson curve with rate = median count rate of data. |
 |
 |
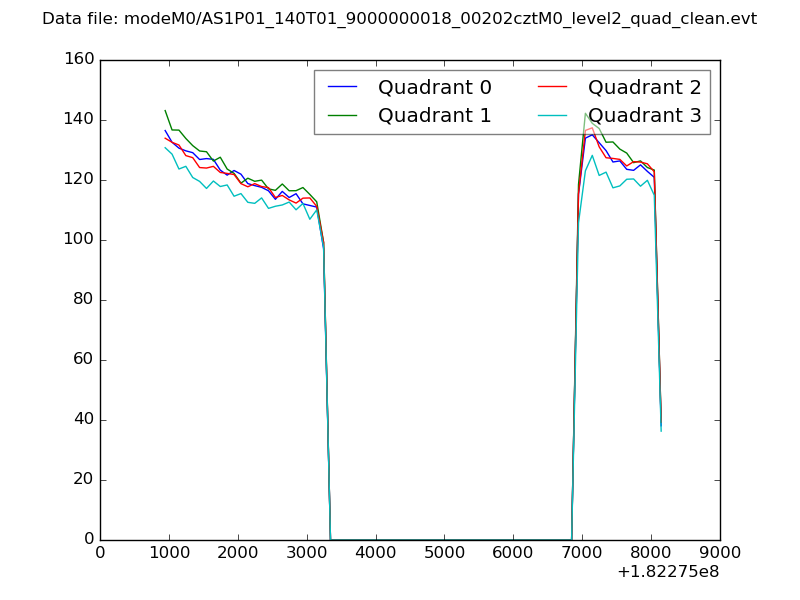
| Quadrant-wise count rates Data is divided into 100 sec bins |
 |
|
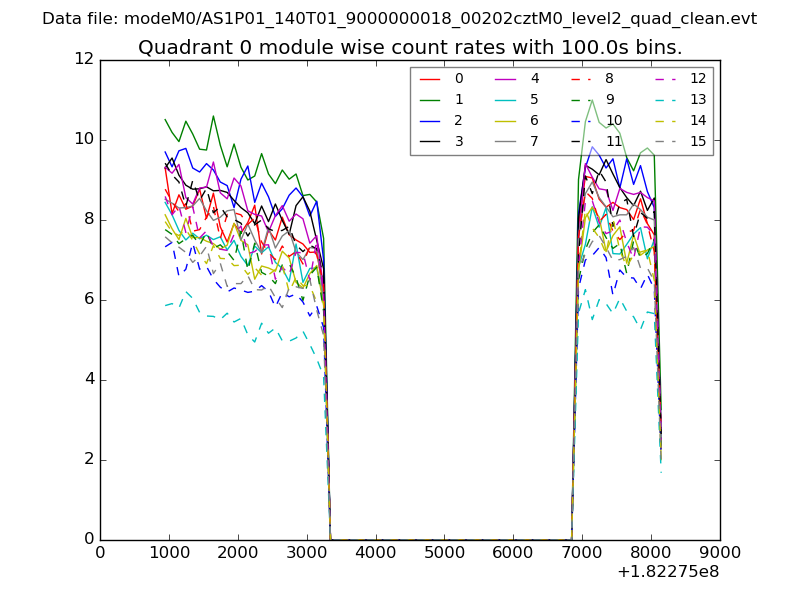
| Module-wise count rates for Quadrant A Data is divided into 100 sec bins |
 |
 |
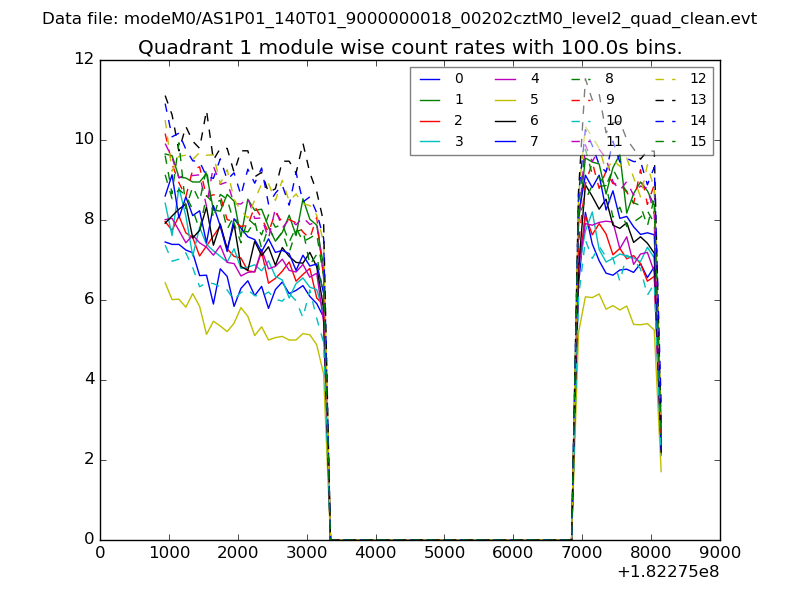
| Module-wise count rates for Quadrant B Data is divided into 100 sec bins |
 |
 |
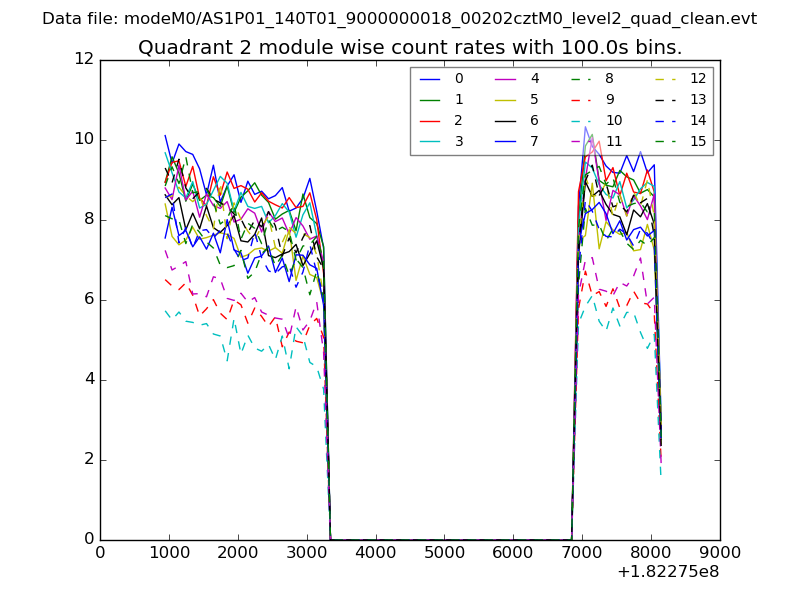
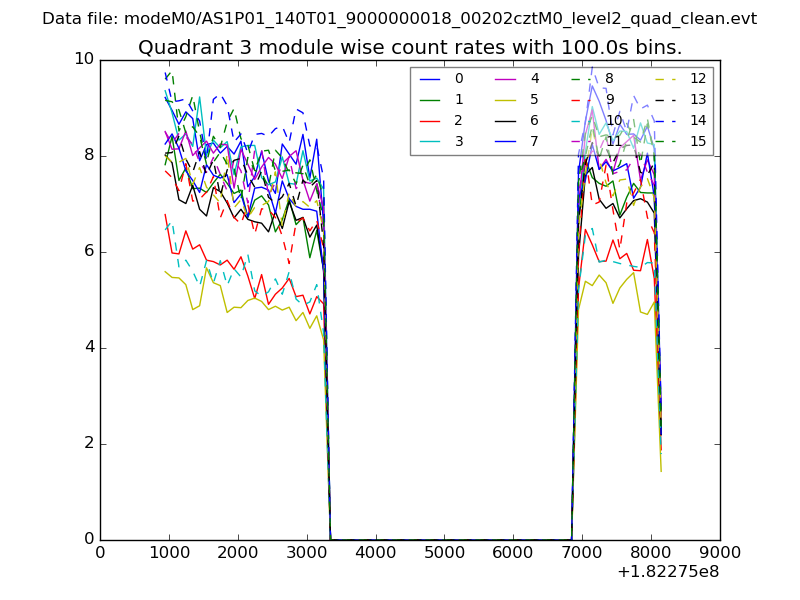
| Module-wise count rates for Quadrant C Data is divided into 100 sec bins |
 |
 |
| Module-wise count rates for Quadrant D Data is divided into 100 sec bins |
 |
 |
| Parameter | Plot |
|---|---|
| CZT HV Monitor | 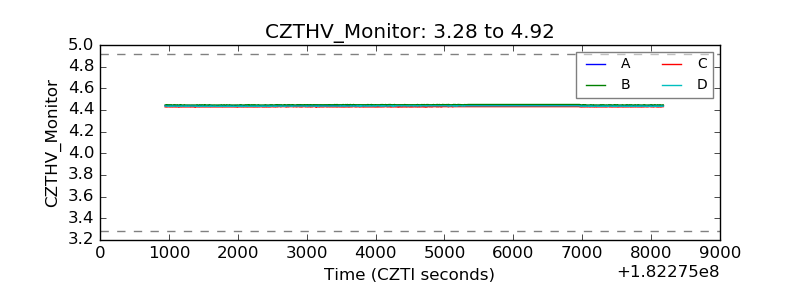 |
| D_VDD | 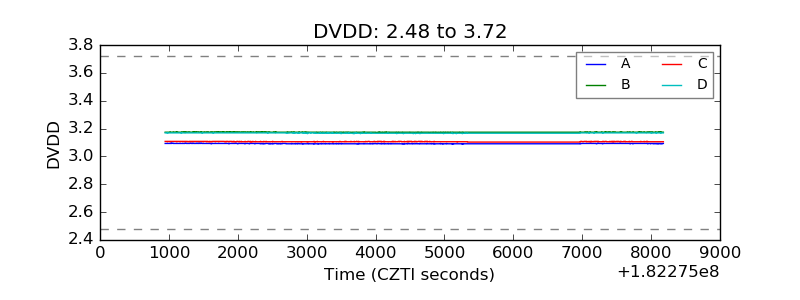 |
| Temperature 1 | 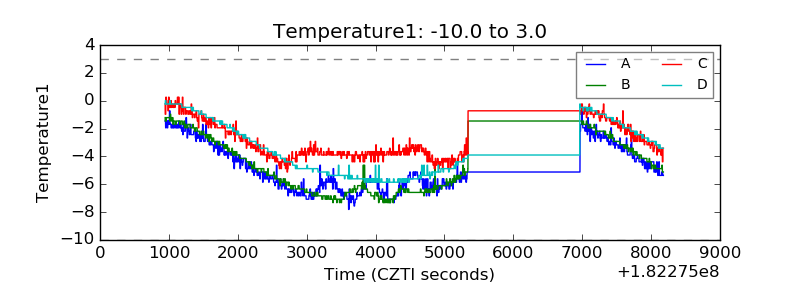 |
| Veto HV Monitor | 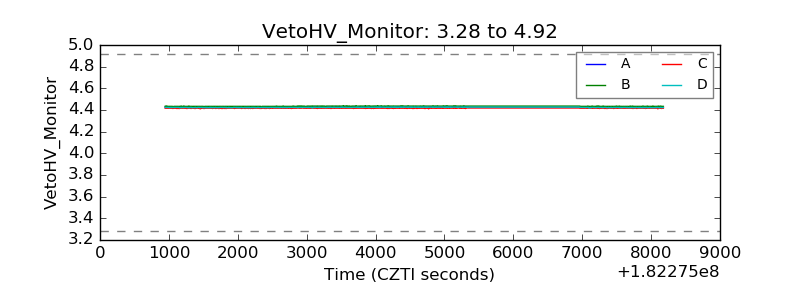 |
| Veto LLD | 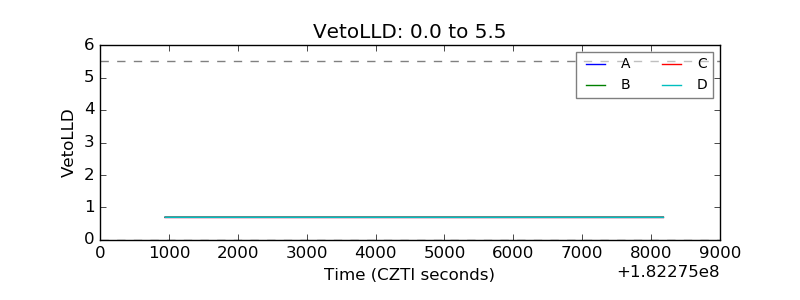 |
| Alpha Counter | 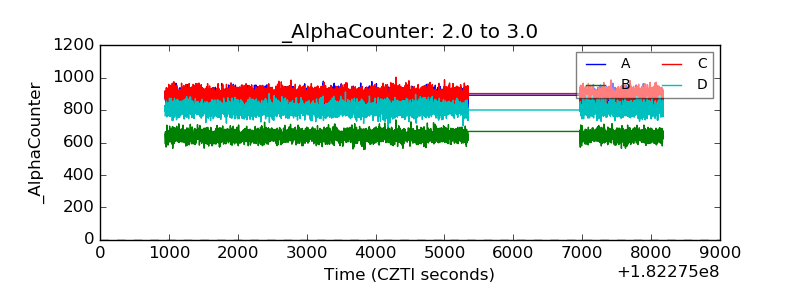 |
| _CPM_Rate | 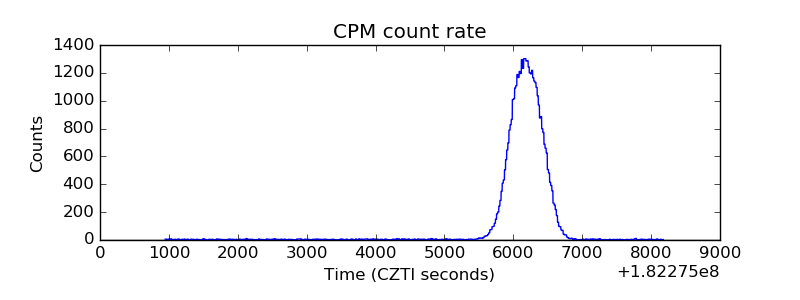 |
| CZT Counter | 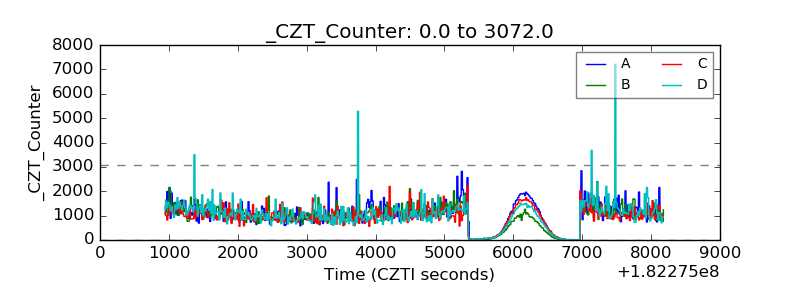 |
| +2.5 Volts monitor |  |
| +5 Volts monitor | 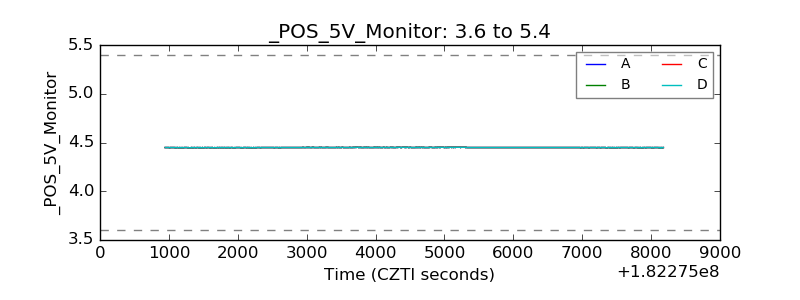 |
| _ROLL_ROT | 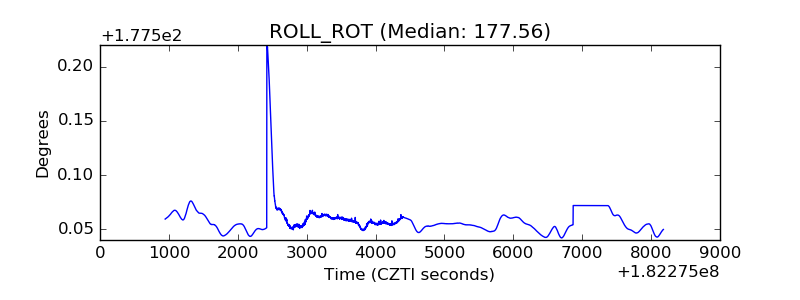 |
| _Roll_DEC | 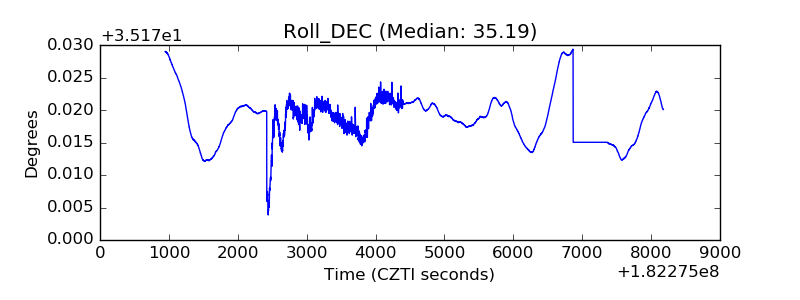 |
| _Roll_RA | 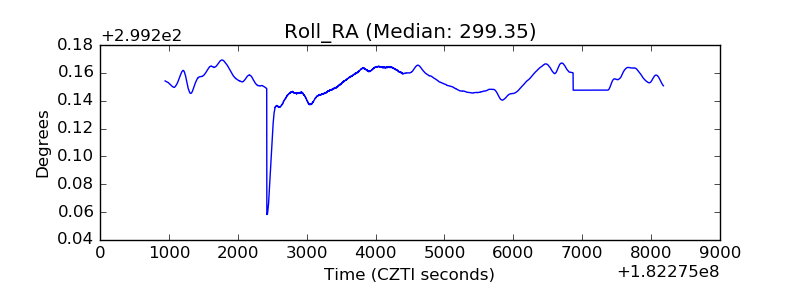 |
| Veto Counter | 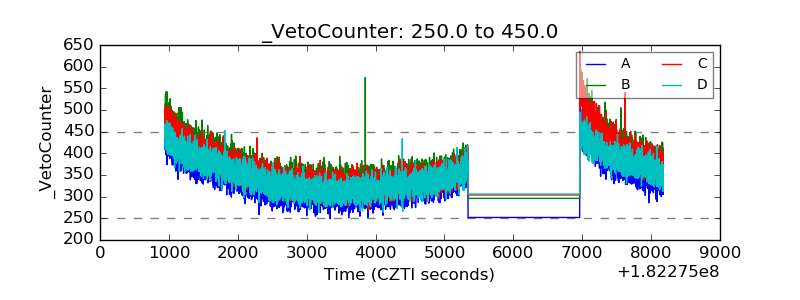 |