| Param | Original file | Final file |
|---|---|---|
| Filename | modeM0/AS1P01_140T01_9000000018_00204cztM0_level2.evt | modeM0/AS1P01_140T01_9000000018_00204cztM0_level2_quad_clean.evt |
| Size (bytes) | 900,259,200 | 69,151,680 |
| Size | 858.6 MB | 65.9 MB |
| Events in quadrant A | 6,690,442 | 425,981 |
| Events in quadrant B | 6,574,771 | 435,780 |
| Events in quadrant C | 6,596,799 | 425,384 |
| Events in quadrant D | 7,019,291 | 403,568 |
| Mode SS | |||
|---|---|---|---|
| Quadrant | BADHDUFLAG | Total packets | Discarded packets |
| A | 0 | 236 | 118 |
| B | 0 | 236 | 118 |
| C | 0 | 236 | 118 |
| D | 0 | 236 | 118 |
| Mode M9 | |||
|---|---|---|---|
| Quadrant | BADHDUFLAG | Total packets | Discarded packets |
| A | 0 | 38 | 19 |
| B | 0 | 38 | 19 |
| C | 0 | 38 | 19 |
| D | 0 | 40 | 20 |
| Mode M0 | |||
|---|---|---|---|
| Quadrant | BADHDUFLAG | Total packets | Discarded packets |
| A | 0 | 47979 | 23992 |
| B | 0 | 47160 | 23586 |
| C | 0 | 47362 | 23683 |
| D | 0 | 49894 | 24949 |
| Quadrant | Total seconds | Saturated seconds | Saturation percentage |
|---|---|---|---|
| A | 5762 | 7 | 0.121486% |
| B | 5761 | 2 | 0.034716% |
| C | 5762 | 2 | 0.034710% |
| D | 5762 | 92 | 1.596668% |
Noise dominated data is calculated using 1-second bins in cleaned event files. If a bin has >2000 counts, and if more than 50% of those come from <1% of pixels, then it is considered to be noise-dominated and hence unusable.
| Quadrant | # 1 sec bins | Bins with >0 counts | Bins with >2000 counts | High rate bins dominated by noise | Noise dominated (total time) | Noise dominated (detector-on time) | Marked lightcurve |
|---|---|---|---|---|---|---|---|
| A | 7384 | 5764 | 157 | 157 | 2.13% | 2.72% | 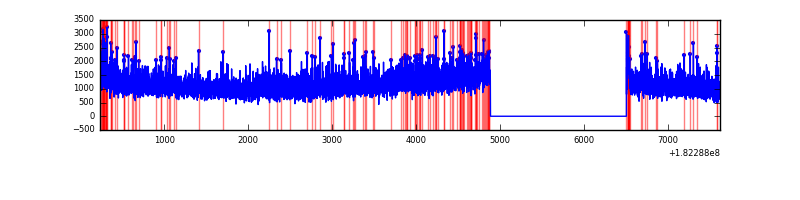 |
| B | 7384 | 5764 | 55 | 55 | 0.74% | 0.95% | 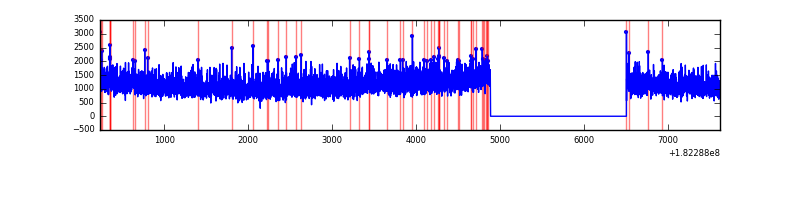 |
| C | 7384 | 5764 | 45 | 45 | 0.61% | 0.78% | 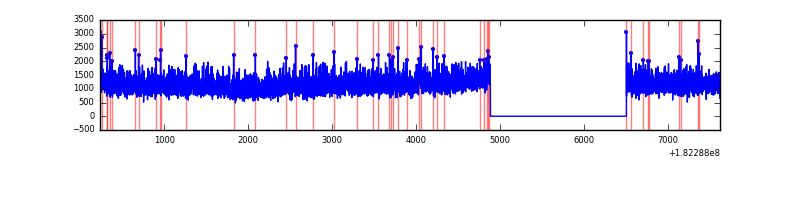 |
| D | 7384 | 5764 | 301 | 301 | 4.08% | 5.22% | 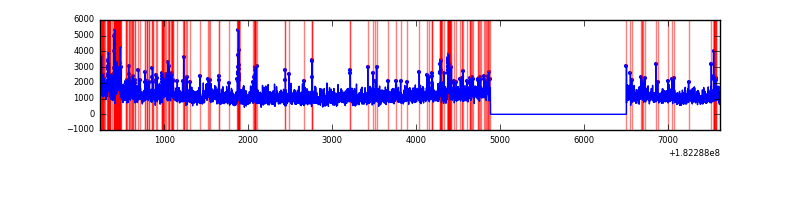 |
Top three noisy pixels from each quadrant. If the there are fewer than three noisy pixels in the level2.evt file, extra rows are filled as -1
| Pixel properties | Quadrant properties | ||||||
|---|---|---|---|---|---|---|---|
| Quadrant | DetID | PixID | Counts | Sigma | Mean | Median | Sigma |
| A | 0 | 6 | 35855 | 91.66 | 1693 | 1680 | 372.8 |
| A | 13 | 17 | 27400 | 68.98 | 1693 | 1680 | 372.8 |
| A | 0 | 253 | 26472 | 66.5 | 1693 | 1680 | 372.8 |
| B | 5 | 2 | 17547 | 39.89 | 1711 | 1717 | 396.9 |
| B | 8 | 5 | 15974 | 35.93 | 1711 | 1717 | 396.9 |
| B | 15 | 69 | 6143 | 11.15 | 1711 | 1717 | 396.9 |
| C | 0 | 186 | 405637 | 925.61 | 1570 | 1627 | 436.5 |
| C | 1 | 1 | 23219 | 49.47 | 1570 | 1627 | 436.5 |
| C | 9 | 188 | 7260 | 12.91 | 1570 | 1627 | 436.5 |
| D | 1 | 4 | 357867 | 771.63 | 1521 | 1573 | 461.7 |
| D | 13 | 117 | 252718 | 543.9 | 1521 | 1573 | 461.7 |
| D | 10 | 229 | 127687 | 273.13 | 1521 | 1573 | 461.7 |
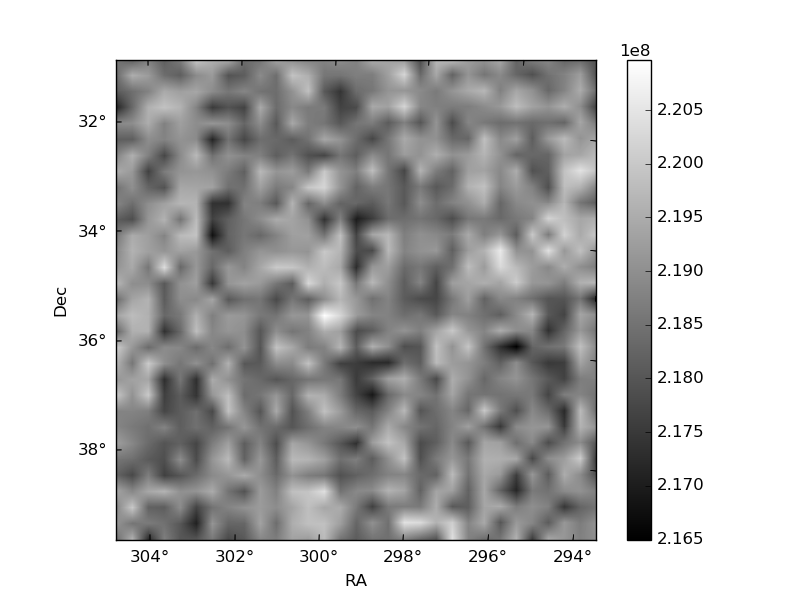
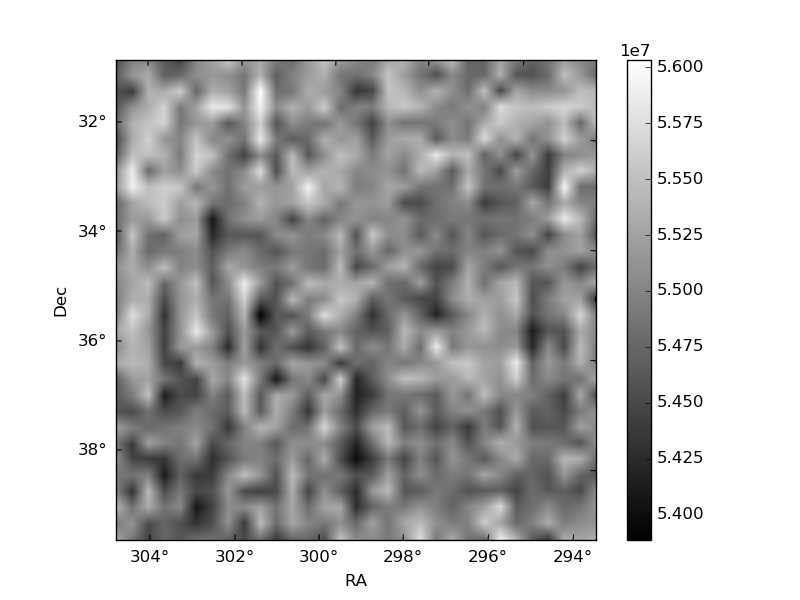
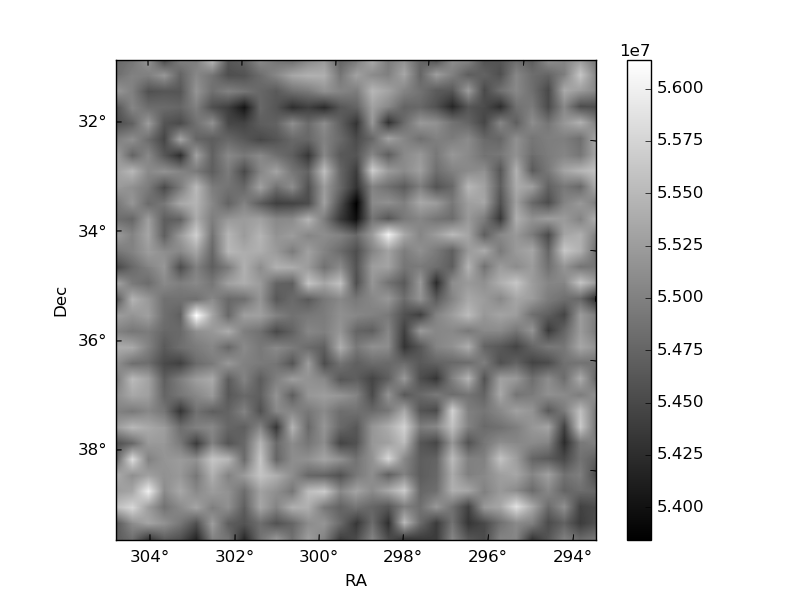
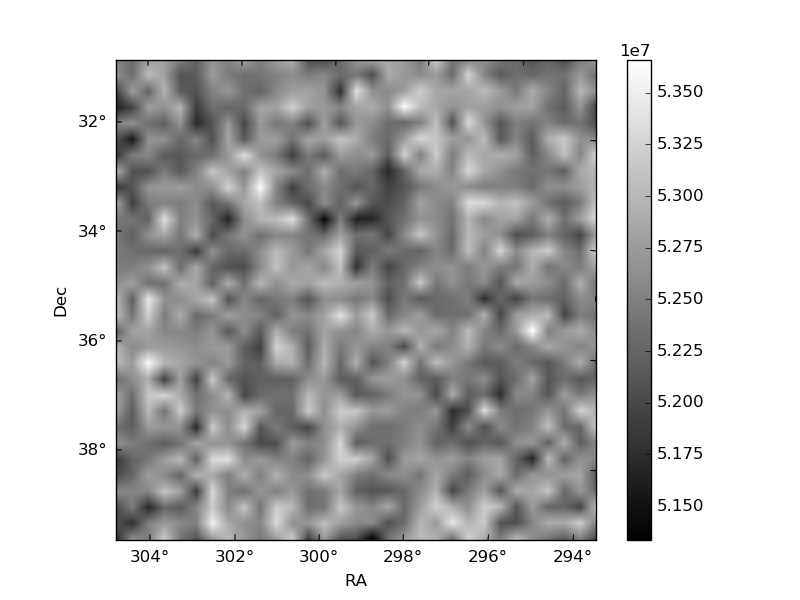
Histogram calculated using DETX and DETY for each event in the final _common_clean file
| Quadrant A | 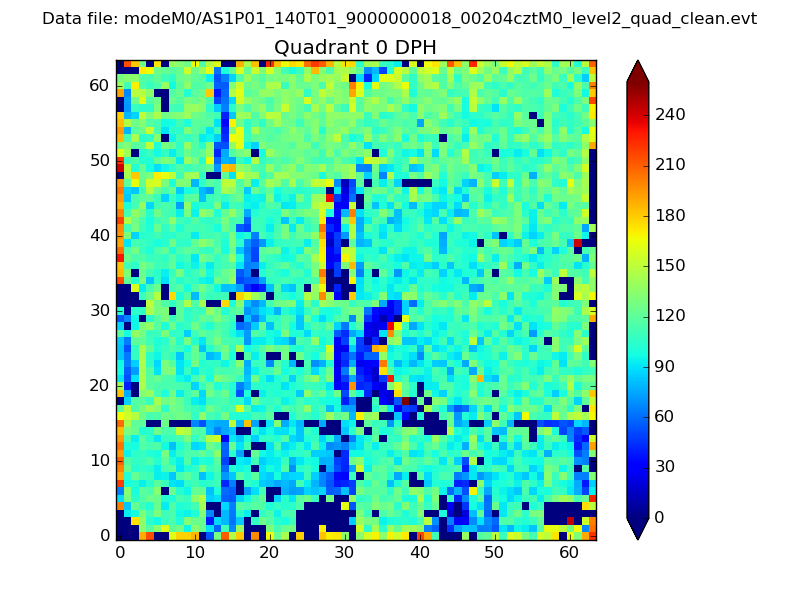 |
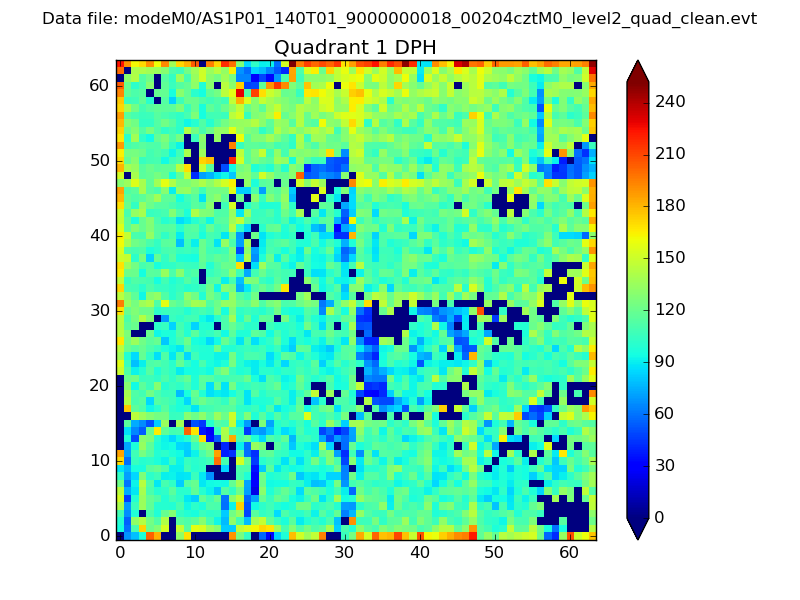 |
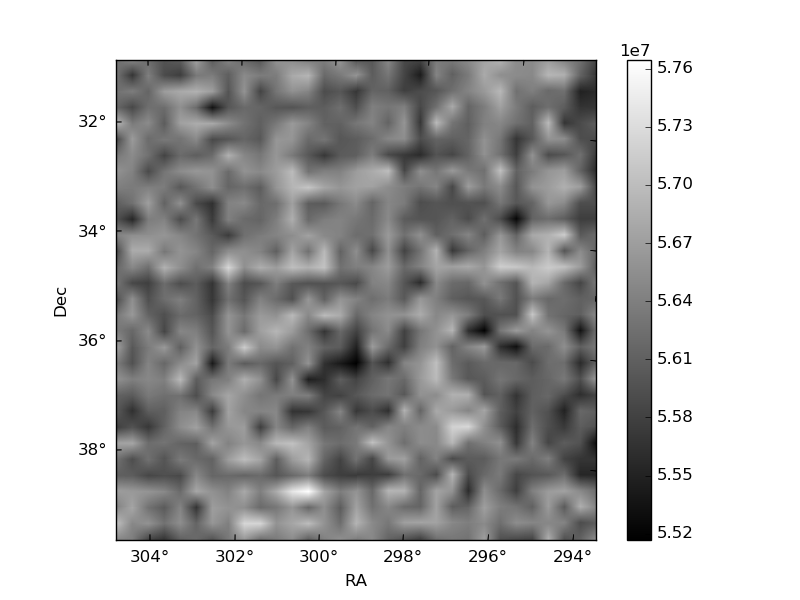
Quadrant B |
|---|---|---|---|
| Quadrant D | 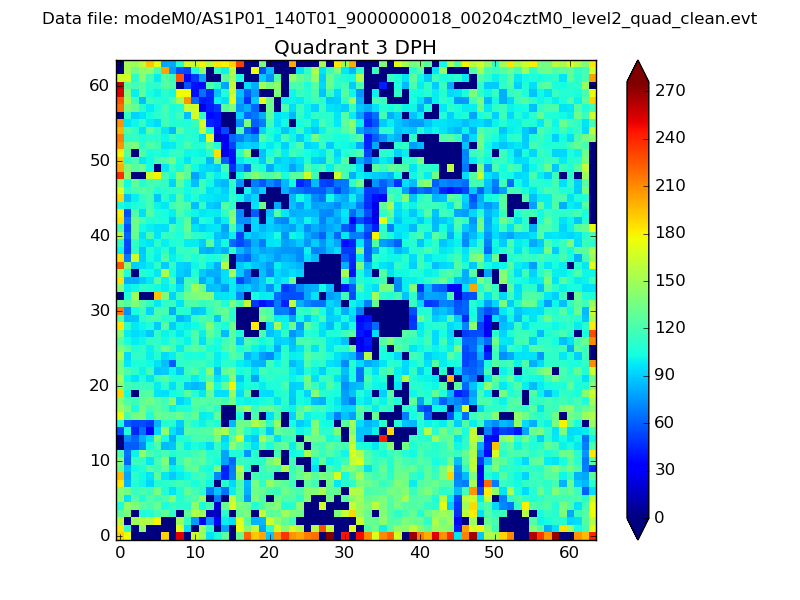 |
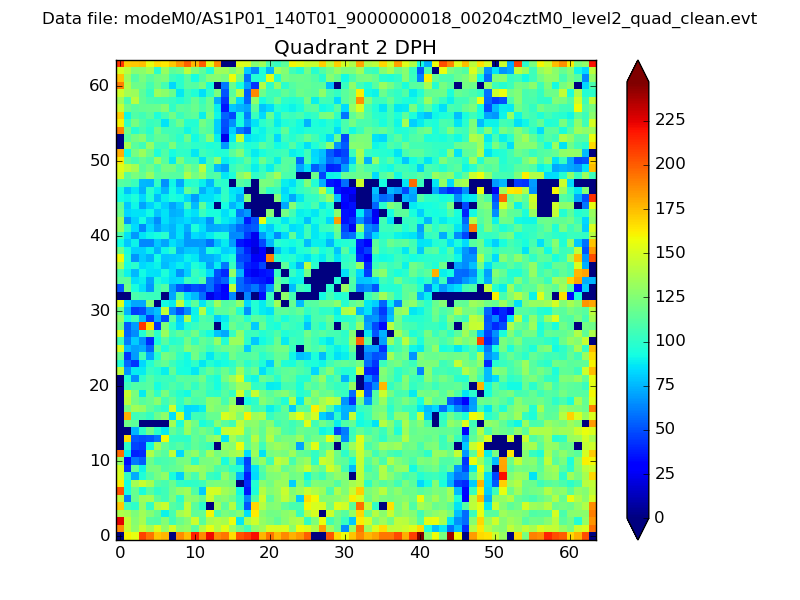 |
Quadrant C |
| Plot type | Count rate plots | Images |
|---|---|---|
| Comparison with Poisson distribution Blue bars denote a histogram of data divided into 1 sec bins. Red curve is a Poisson curve with rate = median count rate of data. |
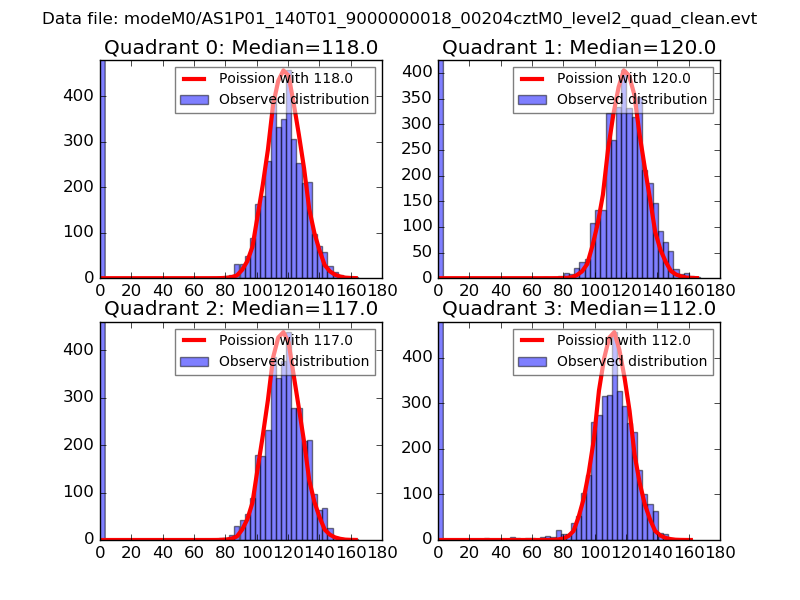 |
 |
| Quadrant-wise count rates Data is divided into 100 sec bins |
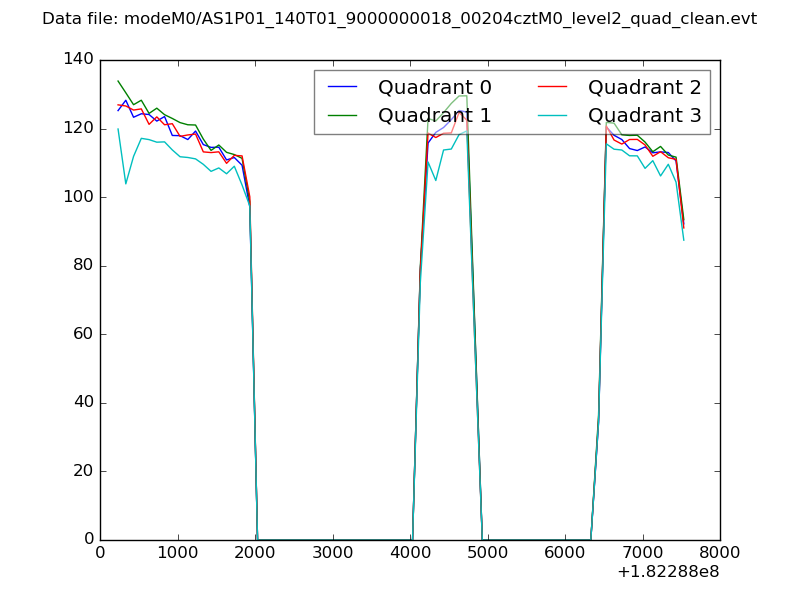 |
|
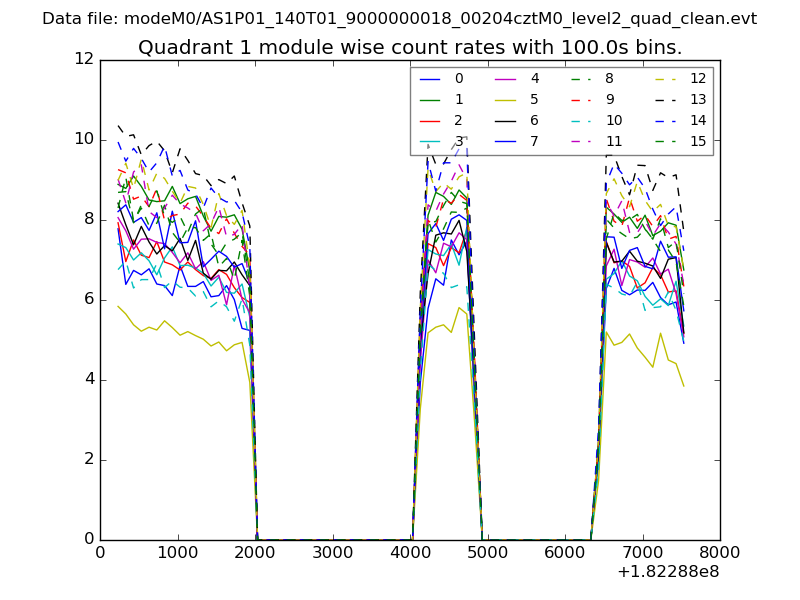
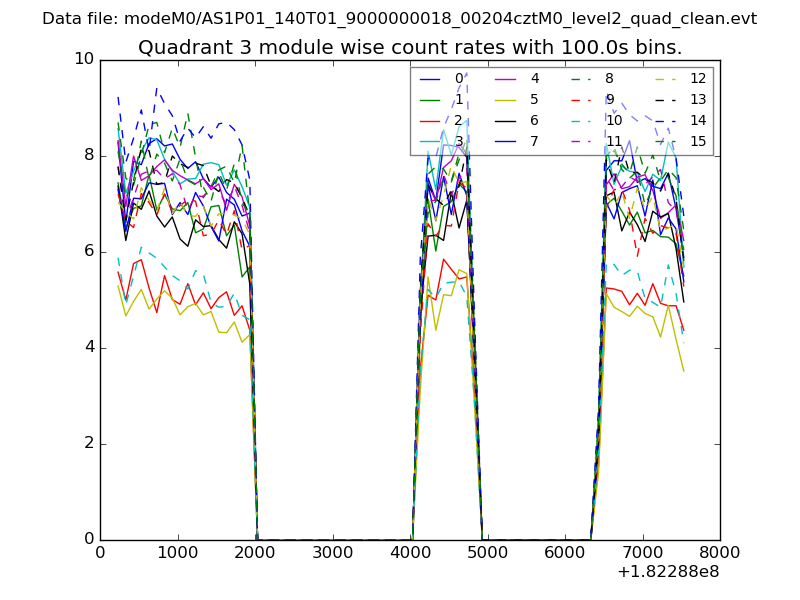
| Module-wise count rates for Quadrant A Data is divided into 100 sec bins |
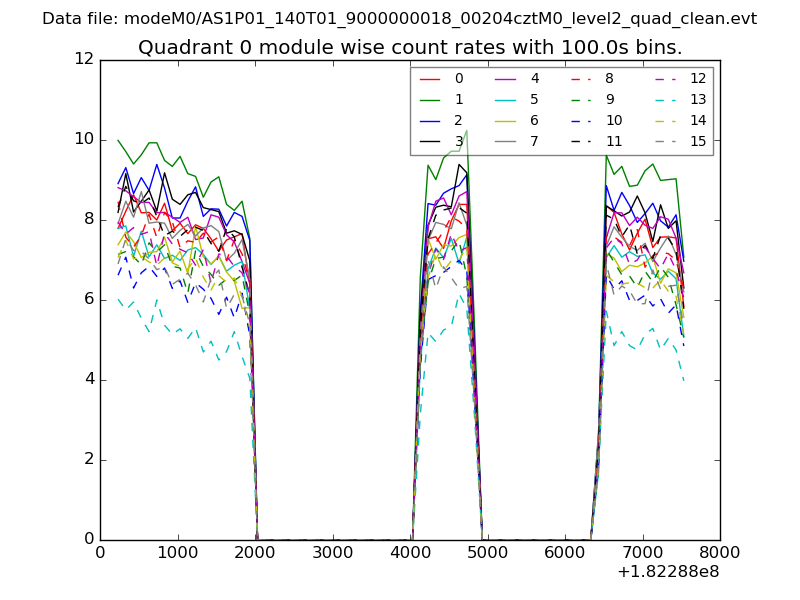 |
 |
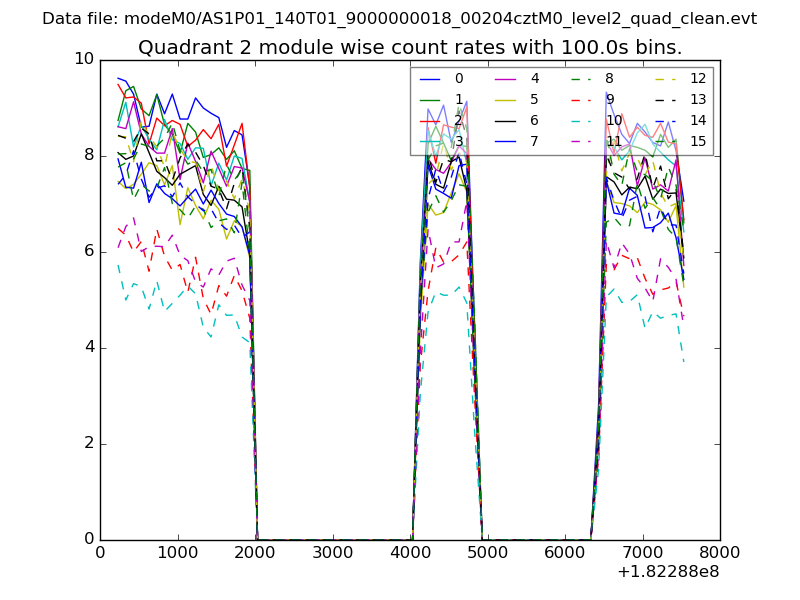
| Module-wise count rates for Quadrant B Data is divided into 100 sec bins |
 |
 |
| Module-wise count rates for Quadrant C Data is divided into 100 sec bins |
 |
 |
| Module-wise count rates for Quadrant D Data is divided into 100 sec bins |
 |
 |
| Parameter | Plot |
|---|---|
| CZT HV Monitor | 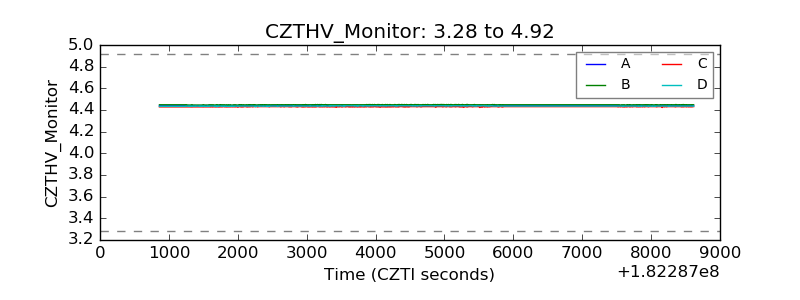 |
| D_VDD | 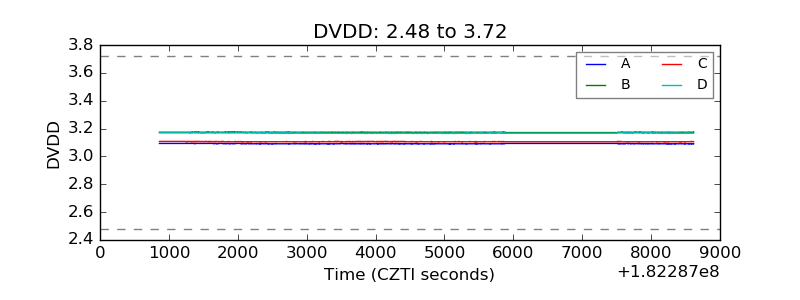 |
| Temperature 1 | 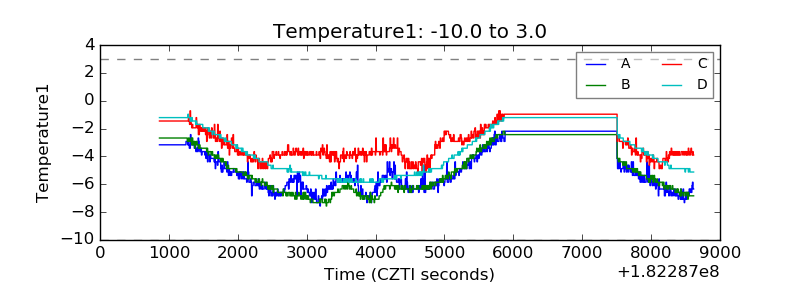 |
| Veto HV Monitor | 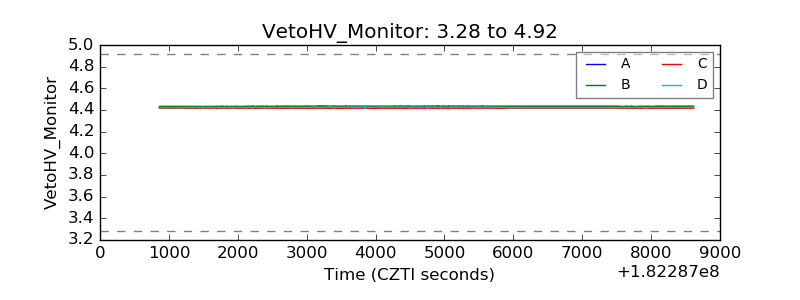 |
| Veto LLD | 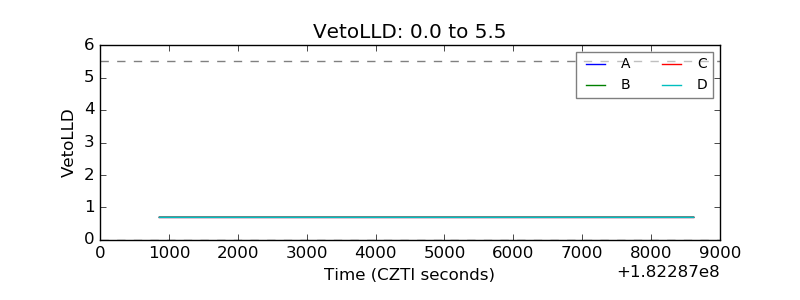 |
| Alpha Counter | 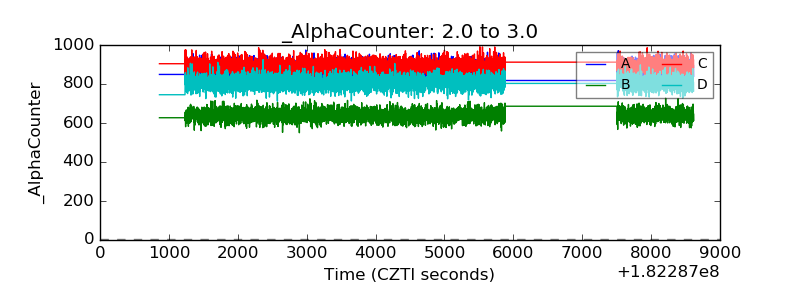 |
| _CPM_Rate | 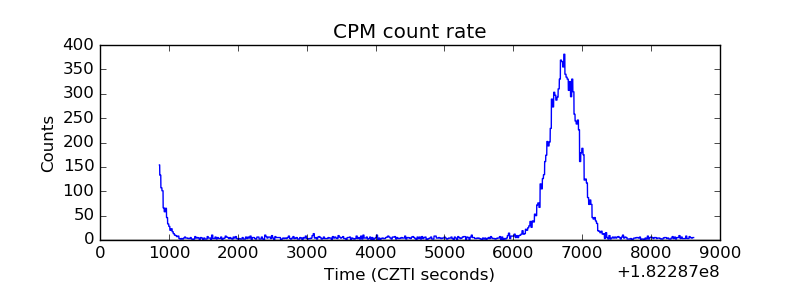 |
| CZT Counter | 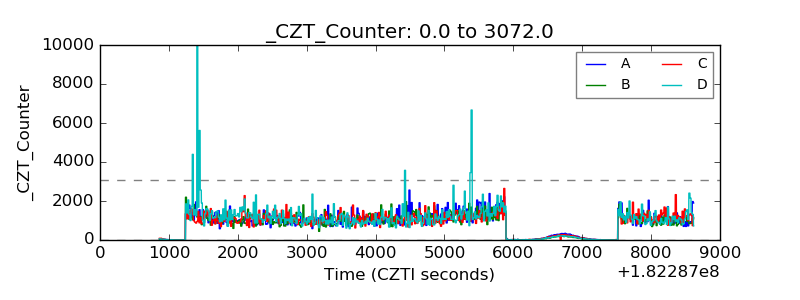 |
| +2.5 Volts monitor |  |
| +5 Volts monitor | 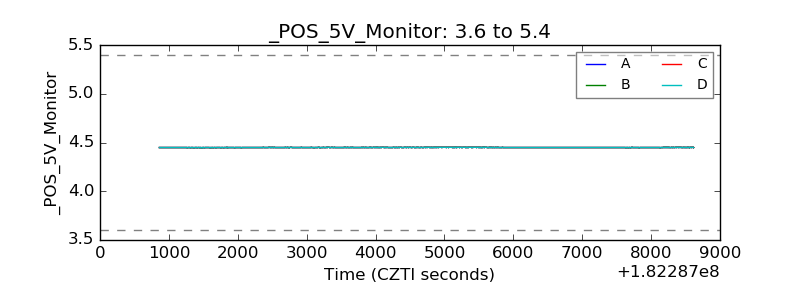 |
| _ROLL_ROT | 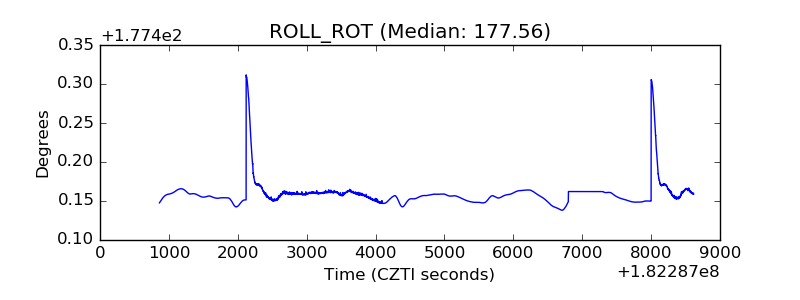 |
| _Roll_DEC | 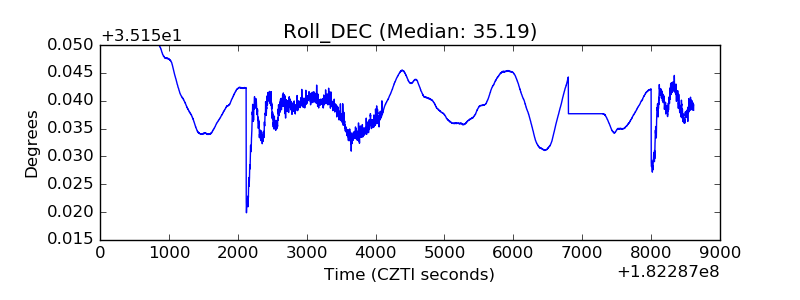 |
| _Roll_RA | 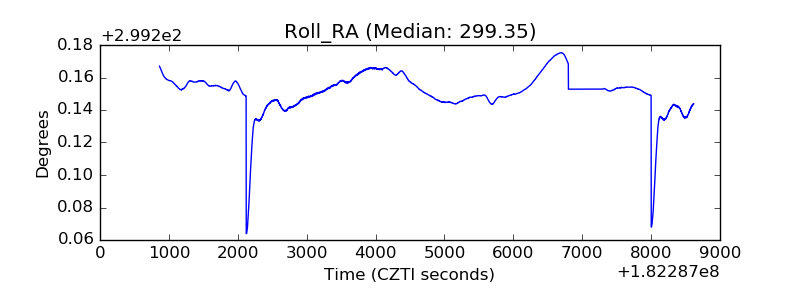 |
| Veto Counter | 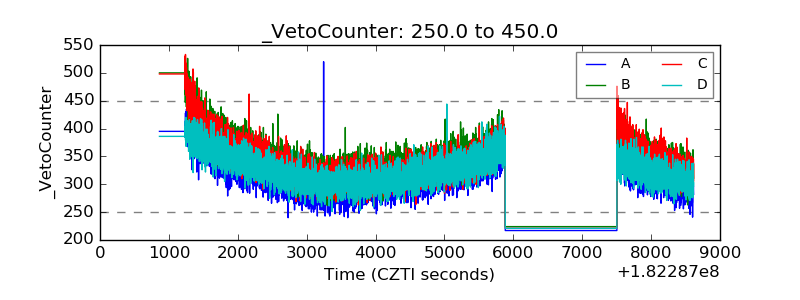 |