| Param | Original file | Final file |
|---|---|---|
| Filename | modeM0/AS1P01_140T01_9000000018_00206cztM0_level2.evt | modeM0/AS1P01_140T01_9000000018_00206cztM0_level2_quad_clean.evt |
| Size (bytes) | 934,764,480 | 54,440,640 |
| Size | 891.5 MB | 51.9 MB |
| Events in quadrant A | 8,643,159 | 286,386 |
| Events in quadrant B | 6,589,959 | 328,947 |
| Events in quadrant C | 6,111,306 | 321,849 |
| Events in quadrant D | 6,583,794 | 309,709 |
| Mode SS | |||
|---|---|---|---|
| Quadrant | BADHDUFLAG | Total packets | Discarded packets |
| A | 0 | 232 | 116 |
| B | 0 | 232 | 116 |
| C | 0 | 232 | 116 |
| D | 0 | 232 | 116 |
| Mode M9 | |||
|---|---|---|---|
| Quadrant | BADHDUFLAG | Total packets | Discarded packets |
| A | 0 | 33 | 17 |
| B | 0 | 32 | 16 |
| C | 0 | 32 | 16 |
| D | 0 | 32 | 16 |
| Mode M0 | |||
|---|---|---|---|
| Quadrant | BADHDUFLAG | Total packets | Discarded packets |
| A | 0 | 60082 | 30200 |
| B | 0 | 47616 | 23957 |
| C | 0 | 44715 | 22496 |
| D | 0 | 47611 | 23972 |
| Quadrant | Total seconds | Saturated seconds | Saturation percentage |
|---|---|---|---|
| A | 5734 | 865 | 15.085455% |
| B | 5735 | 4 | 0.069747% |
| C | 5737 | 1 | 0.017431% |
| D | 5734 | 22 | 0.383676% |
Noise dominated data is calculated using 1-second bins in cleaned event files. If a bin has >2000 counts, and if more than 50% of those come from <1% of pixels, then it is considered to be noise-dominated and hence unusable.
| Quadrant | # 1 sec bins | Bins with >0 counts | Bins with >2000 counts | High rate bins dominated by noise | Noise dominated (total time) | Noise dominated (detector-on time) | Marked lightcurve |
|---|---|---|---|---|---|---|---|
| A | 7407 | 5740 | 1295 | 1295 | 17.48% | 22.56% | 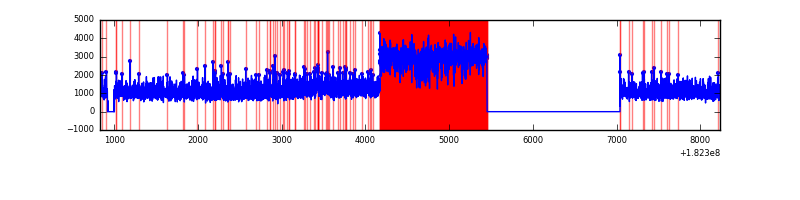 |
| B | 7407 | 5740 | 61 | 61 | 0.82% | 1.06% |  |
| C | 7407 | 5742 | 30 | 30 | 0.41% | 0.52% | 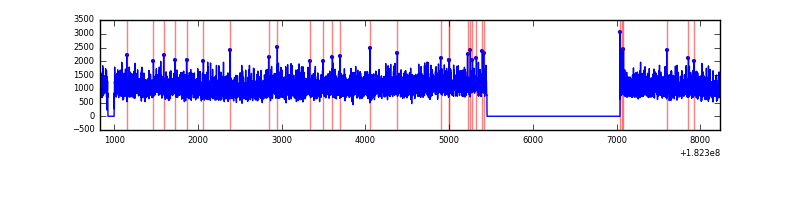 |
| D | 7407 | 5741 | 203 | 203 | 2.74% | 3.54% |  |
Top three noisy pixels from each quadrant. If the there are fewer than three noisy pixels in the level2.evt file, extra rows are filled as -1
| Pixel properties | Quadrant properties | ||||||
|---|---|---|---|---|---|---|---|
| Quadrant | DetID | PixID | Counts | Sigma | Mean | Median | Sigma |
| A | 15 | 66 | 2186804 | 5974.17 | 1636 | 1618 | 365.8 |
| A | 13 | 17 | 66695 | 177.92 | 1636 | 1618 | 365.8 |
| A | 0 | 6 | 36830 | 96.27 | 1636 | 1618 | 365.8 |
| B | 5 | 2 | 15001 | 32.91 | 1711 | 1728 | 403.3 |
| B | 0 | 183 | 11031 | 23.07 | 1711 | 1728 | 403.3 |
| B | 8 | 5 | 9974 | 20.45 | 1711 | 1728 | 403.3 |
| C | 0 | 186 | 24704 | 53.64 | 1541 | 1595 | 430.8 |
| C | 9 | 54 | 14754 | 30.55 | 1541 | 1595 | 430.8 |
| C | 1 | 1 | 12778 | 25.96 | 1541 | 1595 | 430.8 |
| D | 1 | 4 | 328700 | 711.66 | 1511 | 1559 | 459.7 |
| D | 1 | 5 | 99742 | 213.59 | 1511 | 1559 | 459.7 |
| D | 9 | 52 | 83783 | 178.87 | 1511 | 1559 | 459.7 |
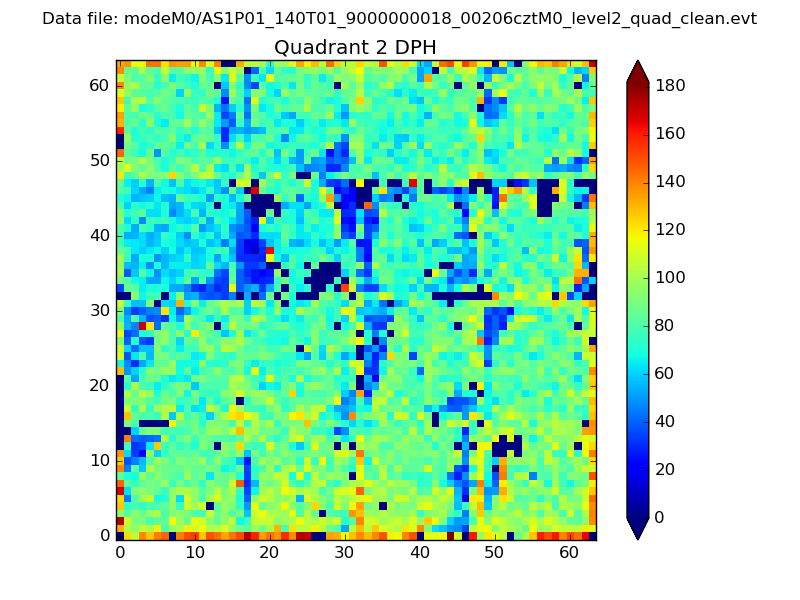
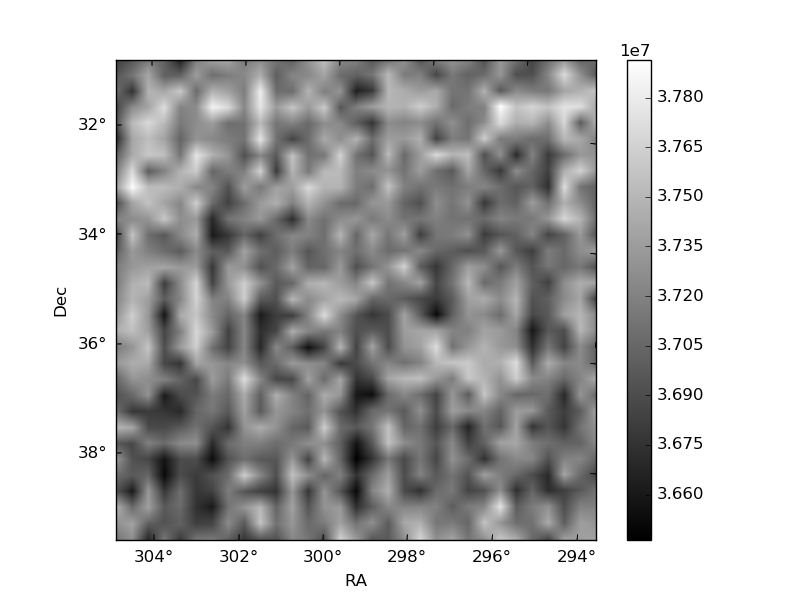
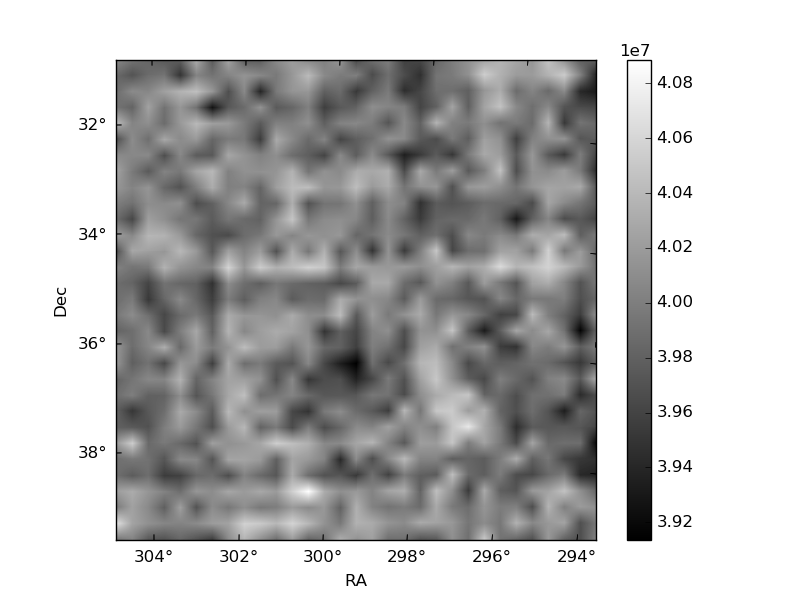
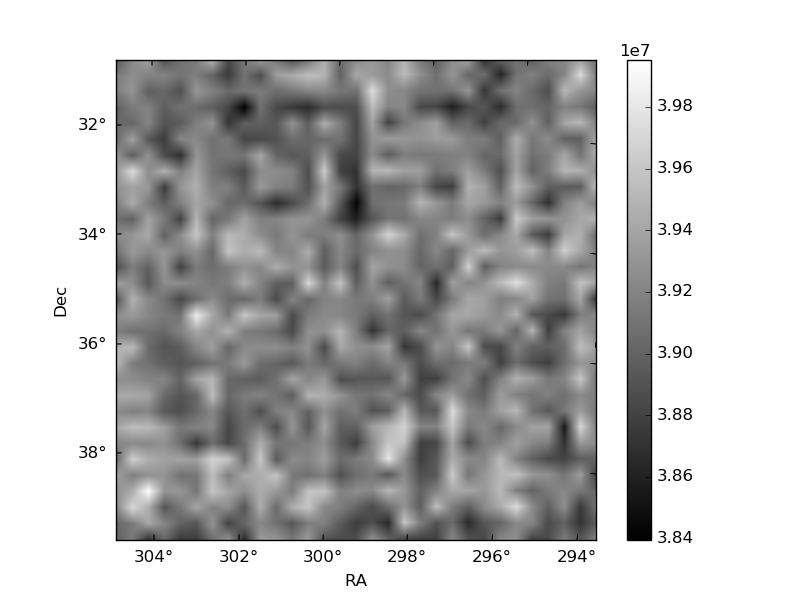
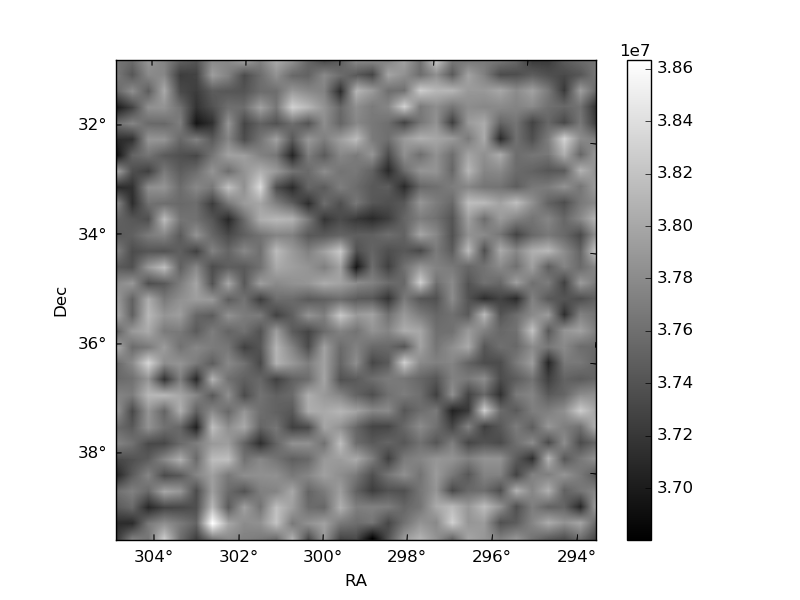
Histogram calculated using DETX and DETY for each event in the final _common_clean file
| Quadrant A | 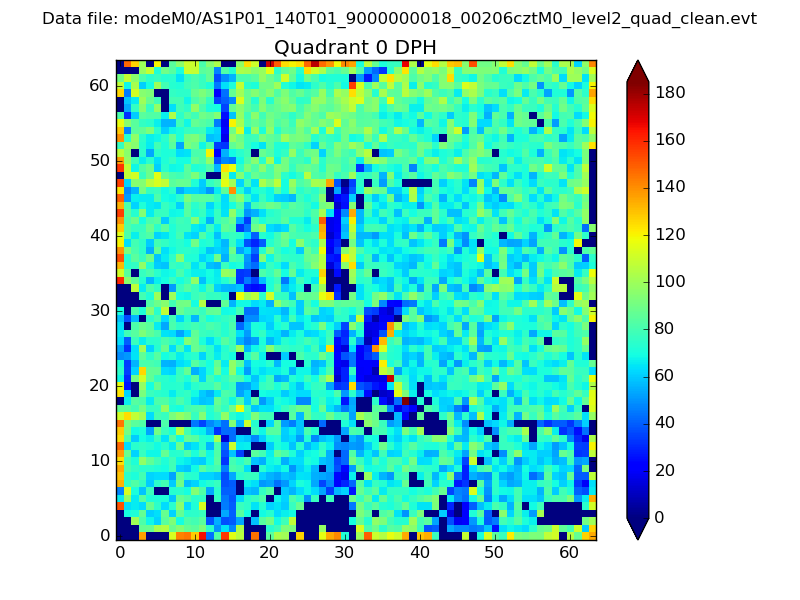 |
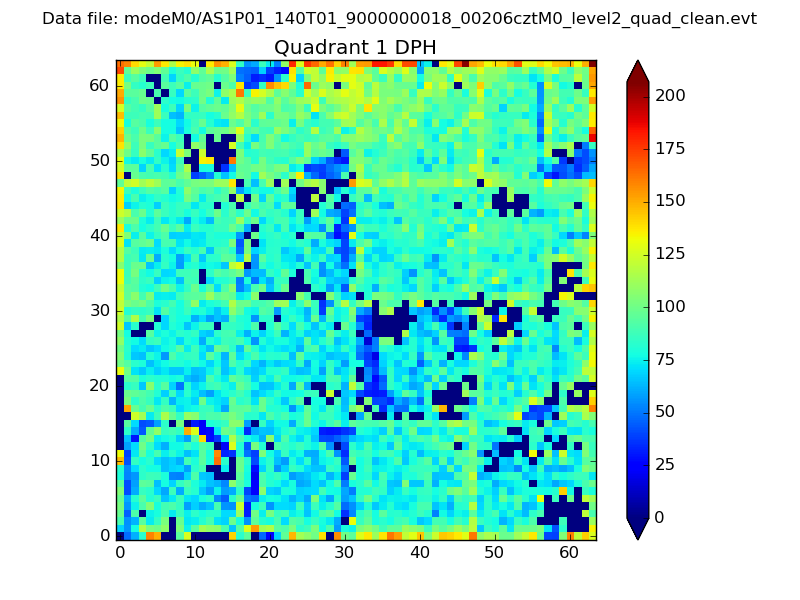 |
Quadrant B |
|---|---|---|---|
| Quadrant D | 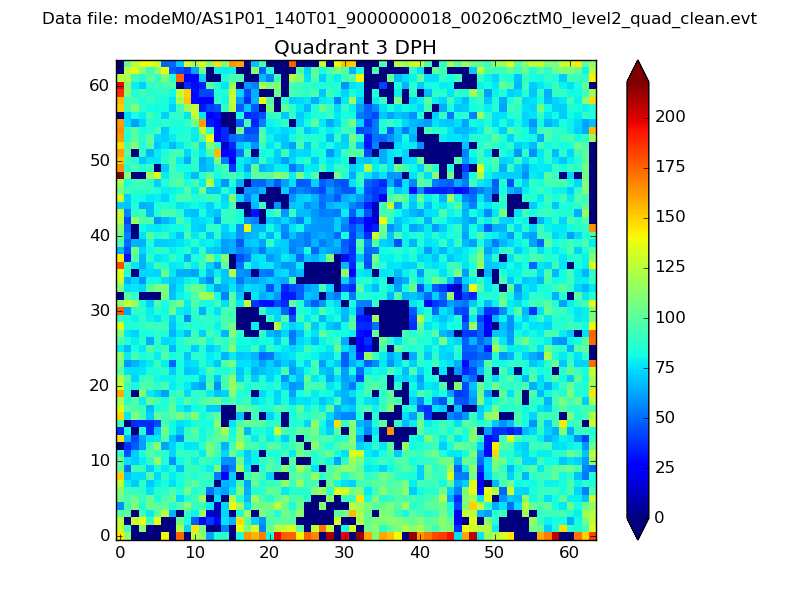 |
 |
Quadrant C |
| Plot type | Count rate plots | Images |
|---|---|---|
| Comparison with Poisson distribution Blue bars denote a histogram of data divided into 1 sec bins. Red curve is a Poisson curve with rate = median count rate of data. |
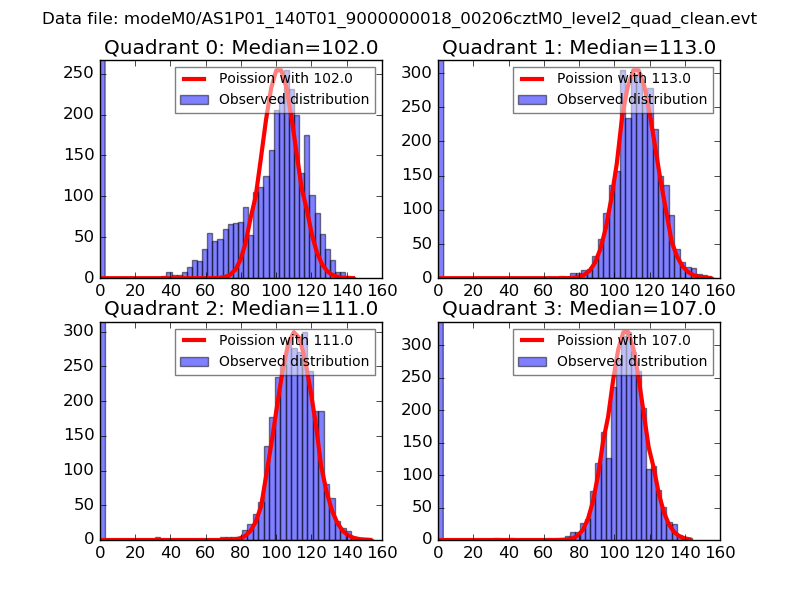 |
 |
| Quadrant-wise count rates Data is divided into 100 sec bins |
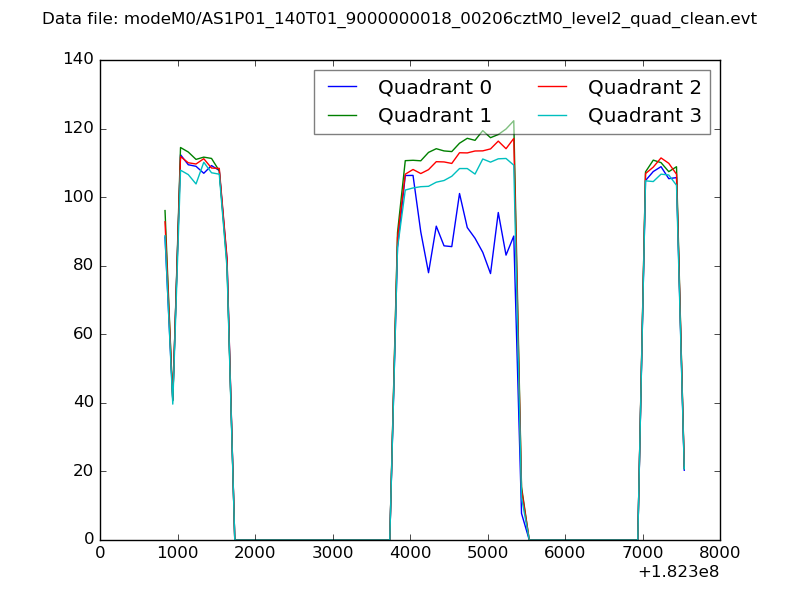 |
|
| Module-wise count rates for Quadrant A Data is divided into 100 sec bins |
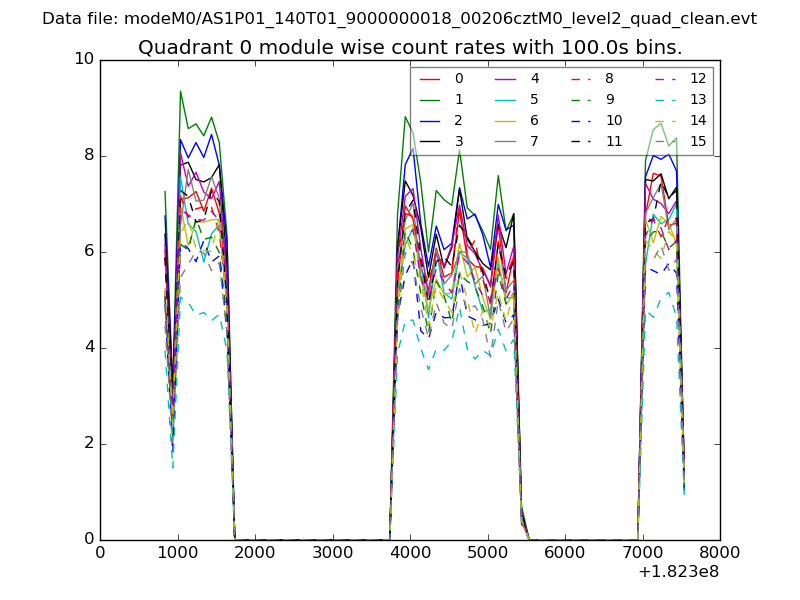 |
 |
| Module-wise count rates for Quadrant B Data is divided into 100 sec bins |
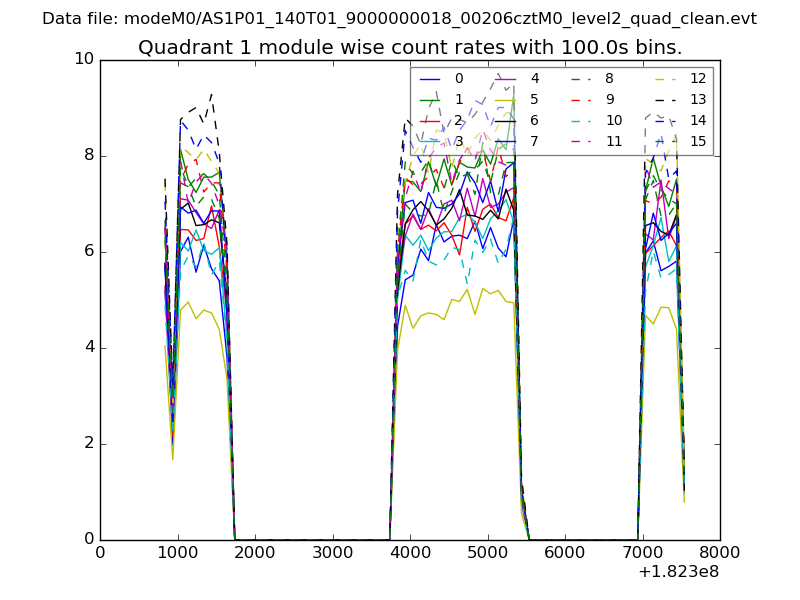 |
 |
| Module-wise count rates for Quadrant C Data is divided into 100 sec bins |
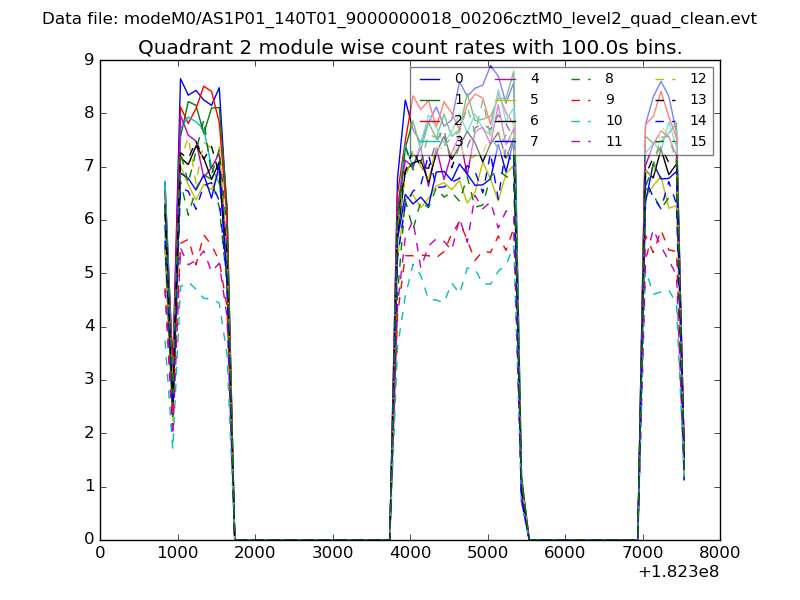 |
 |
| Module-wise count rates for Quadrant D Data is divided into 100 sec bins |
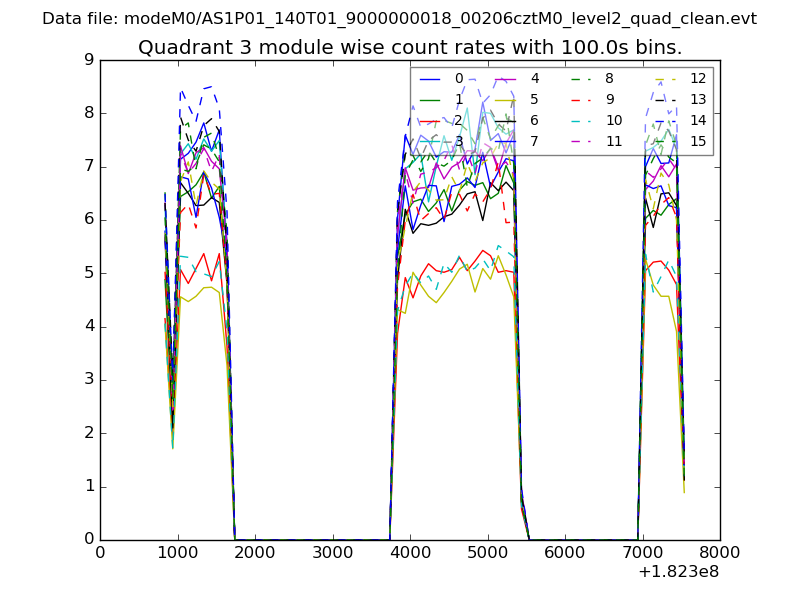 |
 |
| Parameter | Plot |
|---|---|
| CZT HV Monitor | 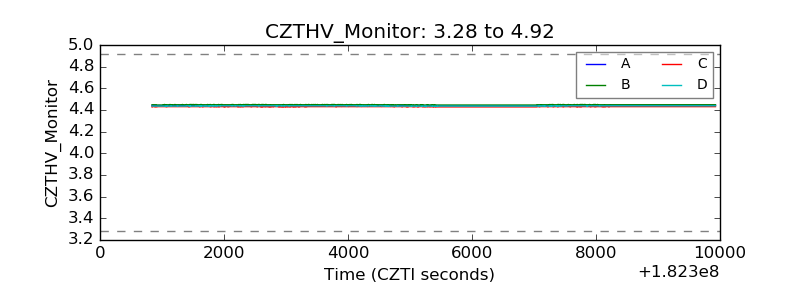 |
| D_VDD | 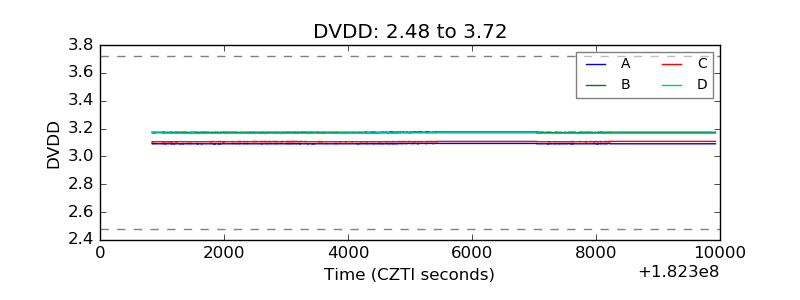 |
| Temperature 1 | 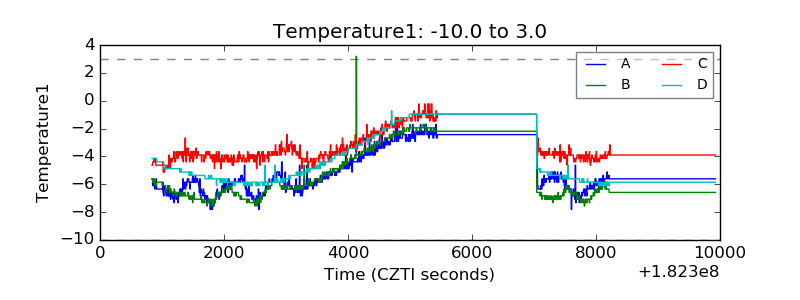 |
| Veto HV Monitor | 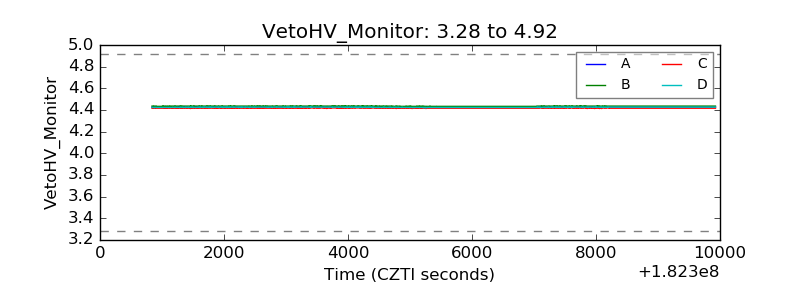 |
| Veto LLD | 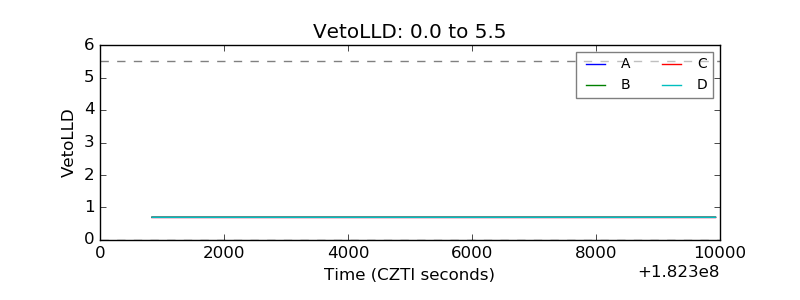 |
| Alpha Counter | 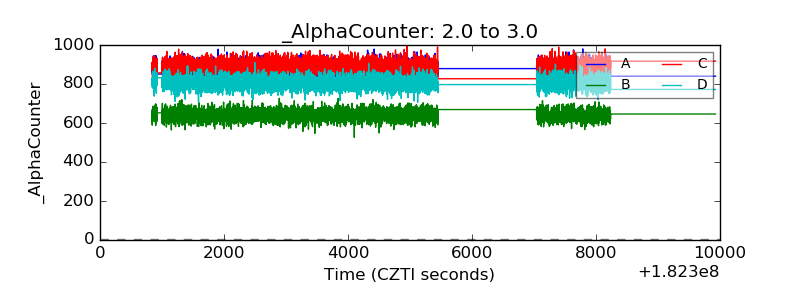 |
| _CPM_Rate | 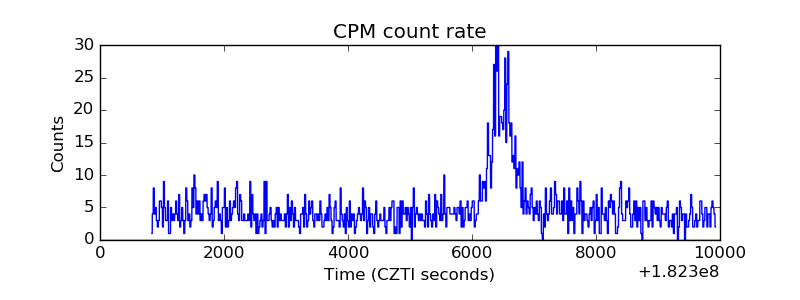 |
| CZT Counter | 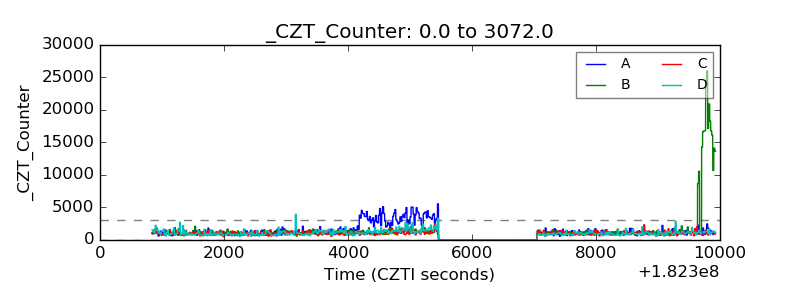 |
| +2.5 Volts monitor |  |
| +5 Volts monitor |  |
| _ROLL_ROT | 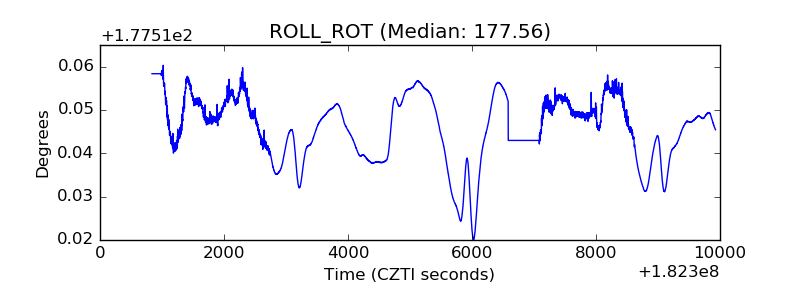 |
| _Roll_DEC | 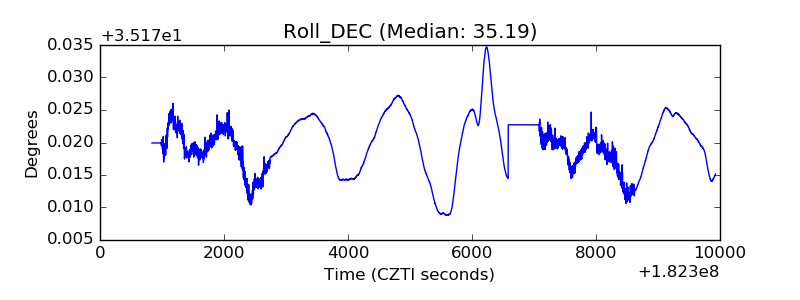 |
| _Roll_RA | 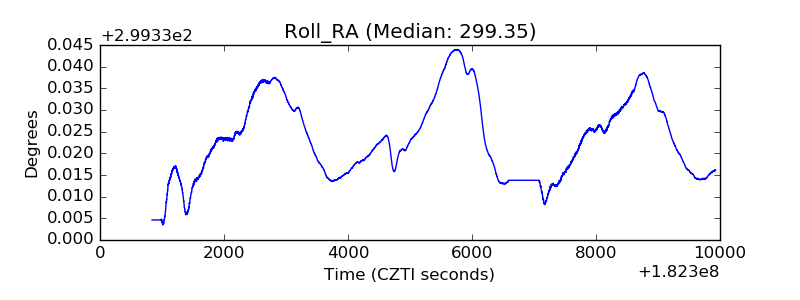 |
| Veto Counter | 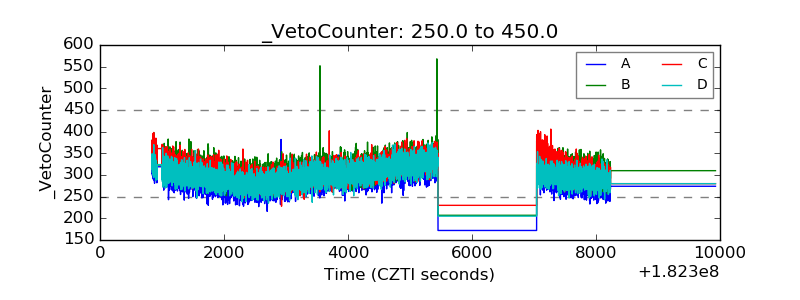 |