| Param | Original file | Final file |
|---|---|---|
| Filename | modeM0/AS1P01_140T01_9000000018_00207cztM0_level2.evt | modeM0/AS1P01_140T01_9000000018_00207cztM0_level2_quad_clean.evt |
| Size (bytes) | 933,704,640 | 50,086,080 |
| Size | 890.5 MB | 47.8 MB |
| Events in quadrant A | 7,121,611 | 282,979 |
| Events in quadrant B | 7,742,634 | 254,998 |
| Events in quadrant C | 6,461,590 | 282,585 |
| Events in quadrant D | 6,550,344 | 274,158 |
| Mode SS | |||
|---|---|---|---|
| Quadrant | BADHDUFLAG | Total packets | Discarded packets |
| A | 0 | 122 | 0 |
| B | 0 | 122 | 0 |
| C | 0 | 122 | 0 |
| D | 0 | 122 | 0 |
| Mode M9 | |||
|---|---|---|---|
| Quadrant | BADHDUFLAG | Total packets | Discarded packets |
| A | 0 | 16 | 0 |
| B | 0 | 16 | 0 |
| C | 0 | 16 | 0 |
| D | 0 | 16 | 0 |
| Mode M0 | |||
|---|---|---|---|
| Quadrant | BADHDUFLAG | Total packets | Discarded packets |
| A | 0 | 50859 | 25431 |
| B | 0 | 54666 | 27334 |
| C | 0 | 46944 | 23473 |
| D | 0 | 47503 | 23756 |
| Quadrant | Total seconds | Saturated seconds | Saturation percentage |
|---|---|---|---|
| A | 6033 | 6 | 0.099453% |
| B | 6033 | 375 | 6.215813% |
| C | 6033 | 1 | 0.016576% |
| D | 6032 | 5 | 0.082891% |
Noise dominated data is calculated using 1-second bins in cleaned event files. If a bin has >2000 counts, and if more than 50% of those come from <1% of pixels, then it is considered to be noise-dominated and hence unusable.
| Quadrant | # 1 sec bins | Bins with >0 counts | Bins with >2000 counts | High rate bins dominated by noise | Noise dominated (total time) | Noise dominated (detector-on time) | Marked lightcurve |
|---|---|---|---|---|---|---|---|
| A | 7624 | 6035 | 152 | 152 | 1.99% | 2.52% | 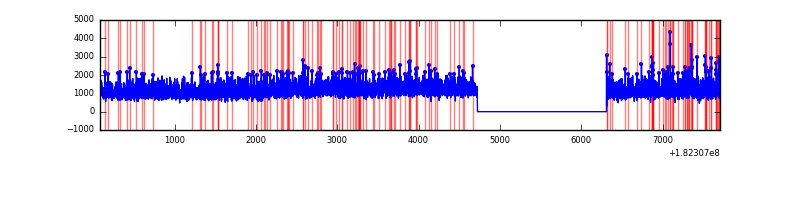 |
| B | 7624 | 6035 | 429 | 429 | 5.63% | 7.11% | 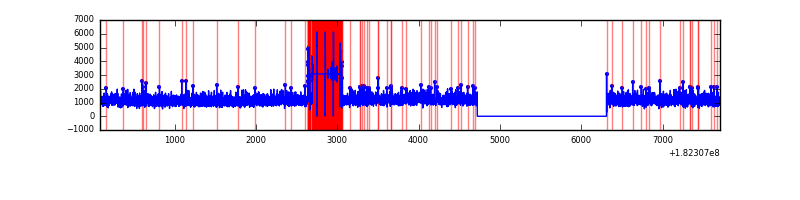 |
| C | 7624 | 6035 | 42 | 42 | 0.55% | 0.70% | 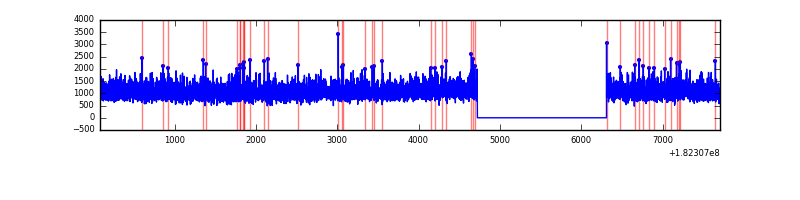 |
| D | 7624 | 6035 | 79 | 79 | 1.04% | 1.31% |  |
Top three noisy pixels from each quadrant. If the there are fewer than three noisy pixels in the level2.evt file, extra rows are filled as -1
| Pixel properties | Quadrant properties | ||||||
|---|---|---|---|---|---|---|---|
| Quadrant | DetID | PixID | Counts | Sigma | Mean | Median | Sigma |
| A | 15 | 66 | 65766 | 157.29 | 1808 | 1789 | 406.7 |
| A | 0 | 253 | 28750 | 66.28 | 1808 | 1789 | 406.7 |
| A | 0 | 96 | 15917 | 34.73 | 1808 | 1789 | 406.7 |
| B | 8 | 5 | 1087034 | 2645.71 | 1732 | 1738 | 410.2 |
| B | 0 | 190 | 12610 | 26.5 | 1732 | 1738 | 410.2 |
| B | 0 | 183 | 12410 | 26.02 | 1732 | 1738 | 410.2 |
| C | 7 | 222 | 9560 | 17.03 | 1640 | 1699 | 461.5 |
| C | 9 | 188 | 7226 | 11.98 | 1640 | 1699 | 461.5 |
| C | 1 | 1 | 4631 | 6.35 | 1640 | 1699 | 461.5 |
| D | 1 | 4 | 213261 | 432.32 | 1606 | 1659 | 489.5 |
| D | 9 | 51 | 48927 | 96.57 | 1606 | 1659 | 489.5 |
| D | 10 | 154 | 43309 | 85.09 | 1606 | 1659 | 489.5 |
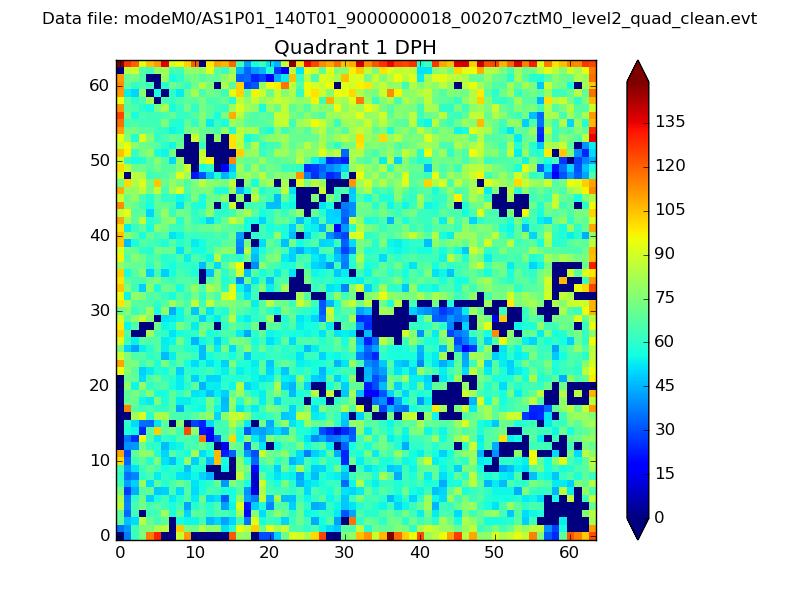
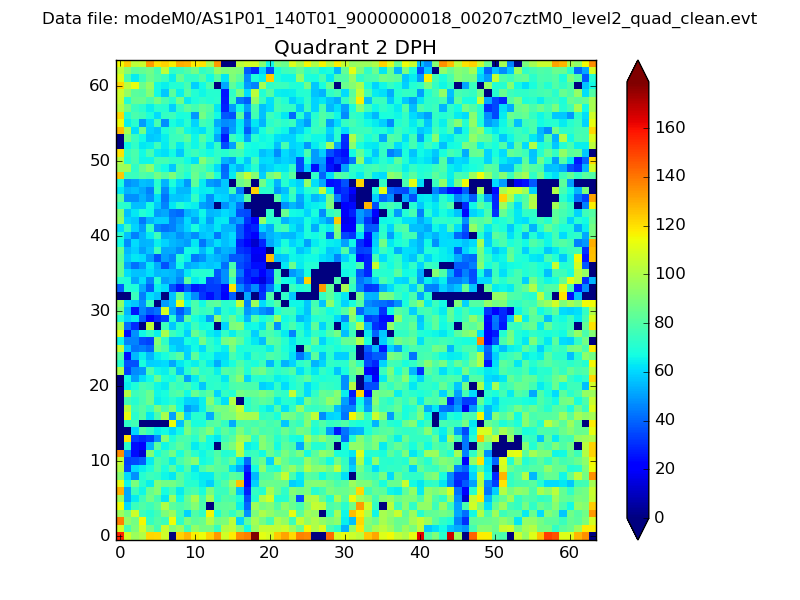
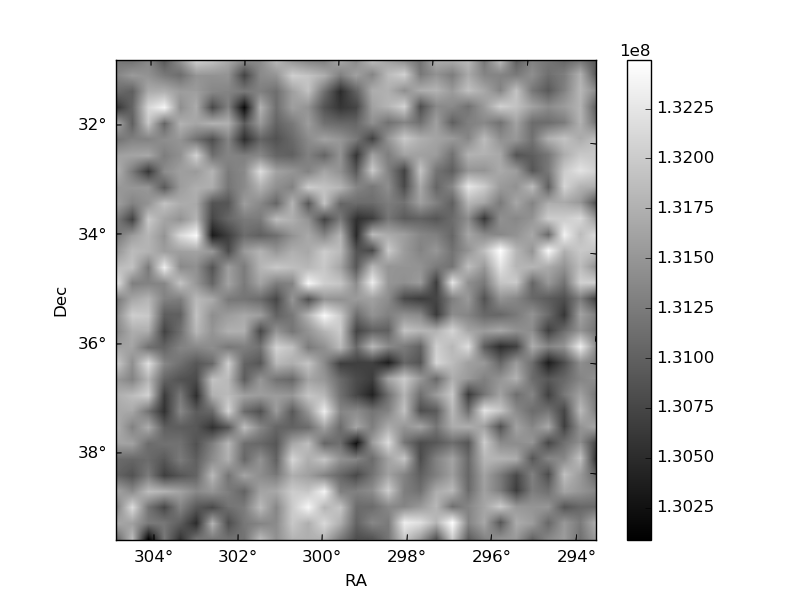
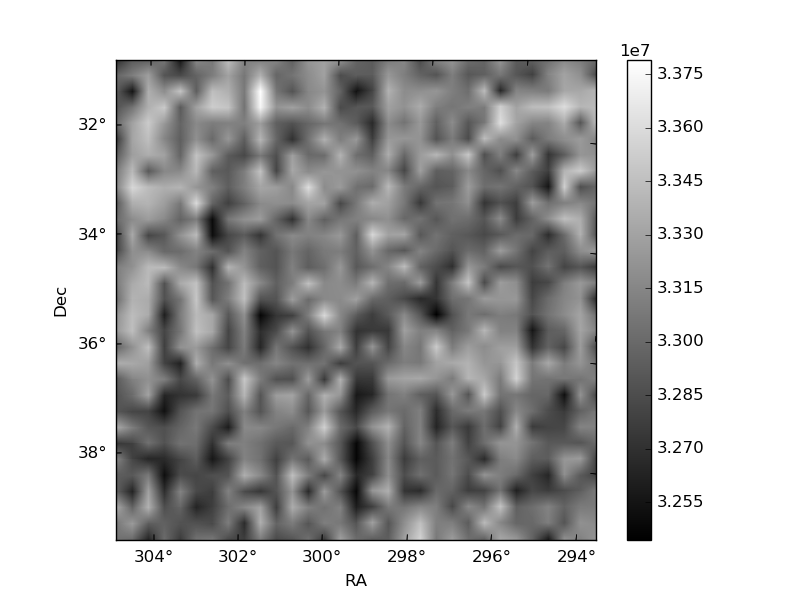
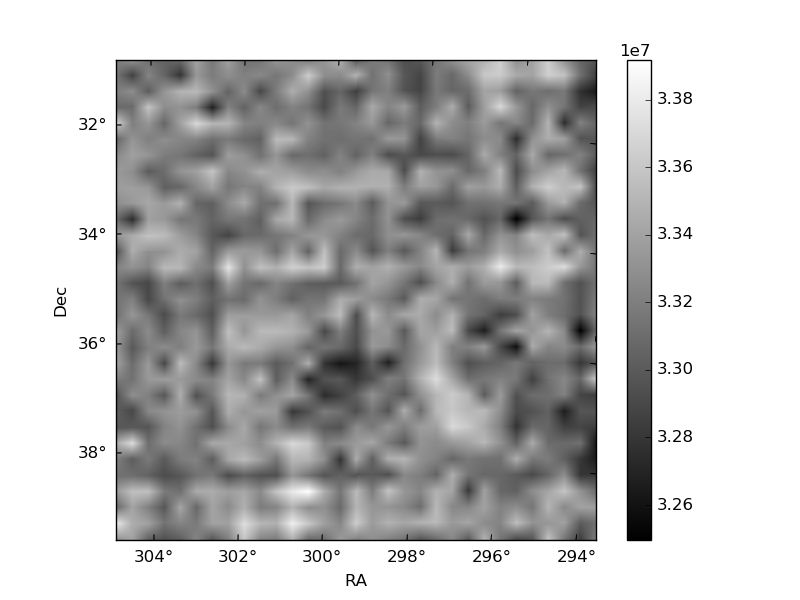
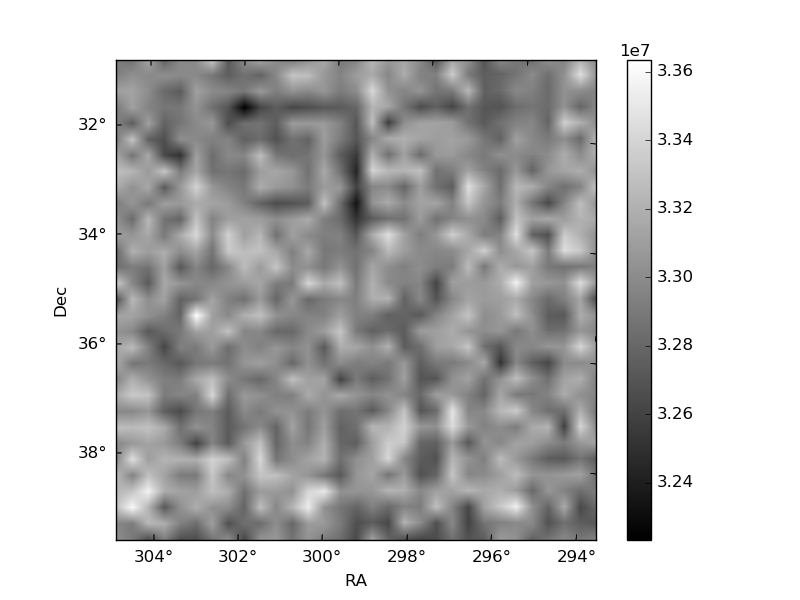
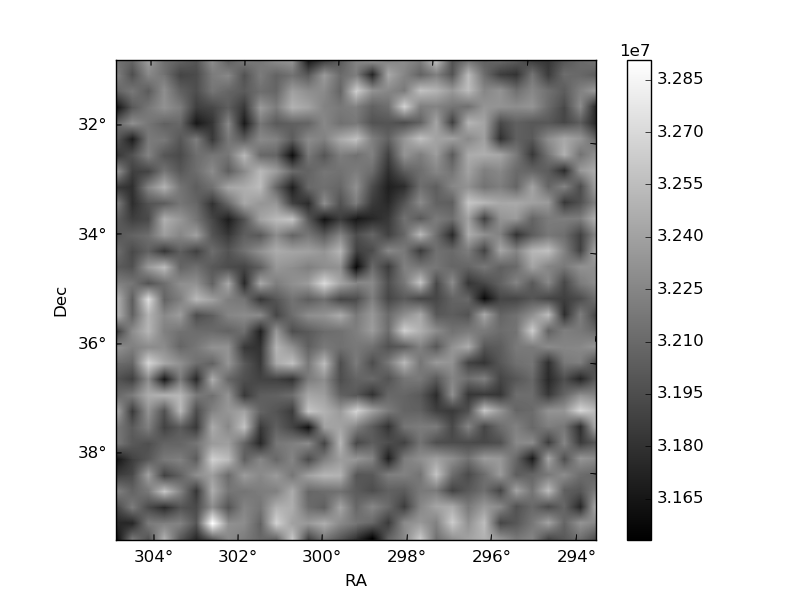
Histogram calculated using DETX and DETY for each event in the final _common_clean file
| Quadrant A | 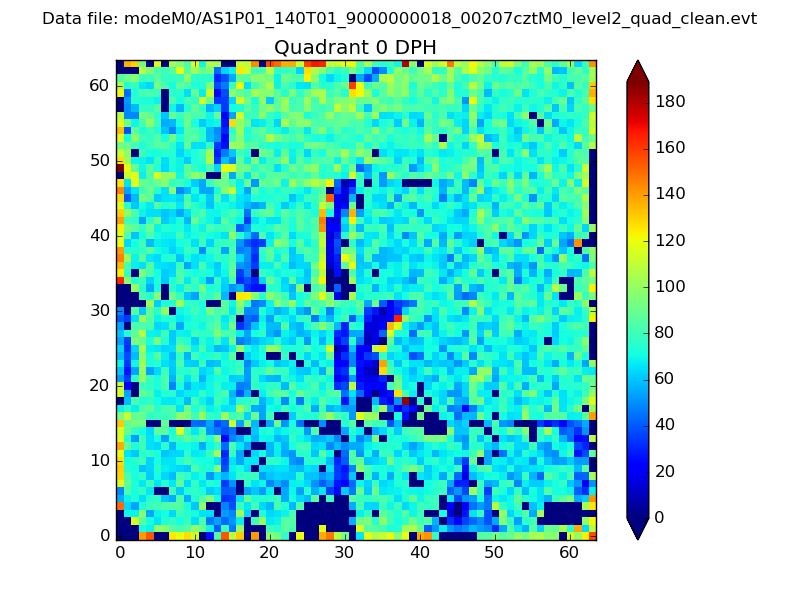 |
 |
Quadrant B |
|---|---|---|---|
| Quadrant D | 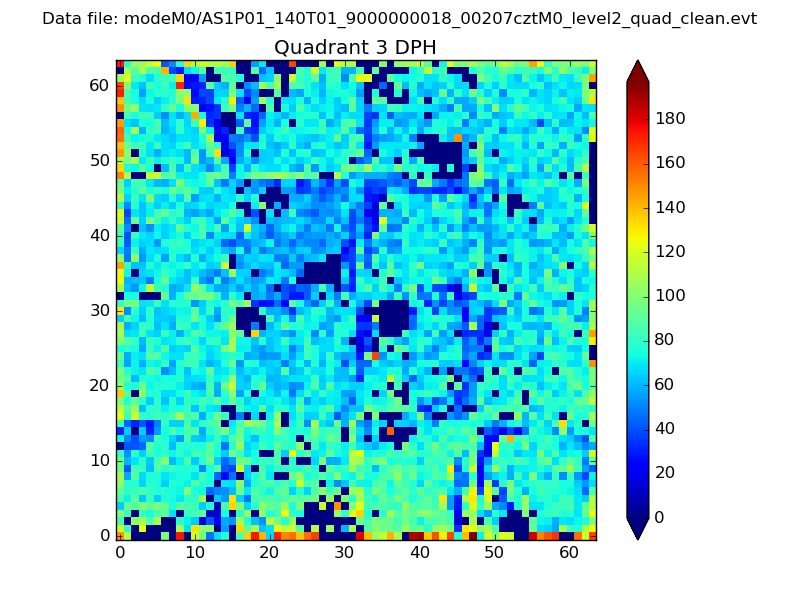 |
 |
Quadrant C |
| Plot type | Count rate plots | Images |
|---|---|---|
| Comparison with Poisson distribution Blue bars denote a histogram of data divided into 1 sec bins. Red curve is a Poisson curve with rate = median count rate of data. |
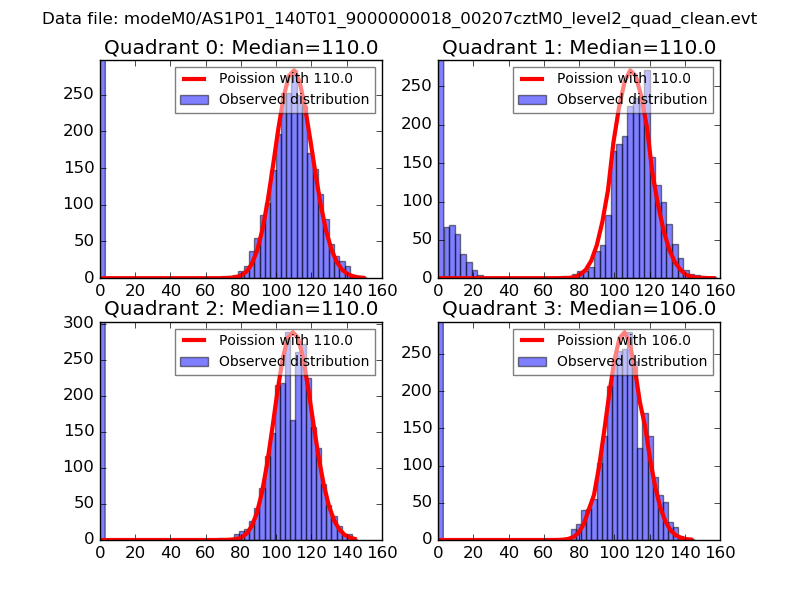 |
 |
| Quadrant-wise count rates Data is divided into 100 sec bins |
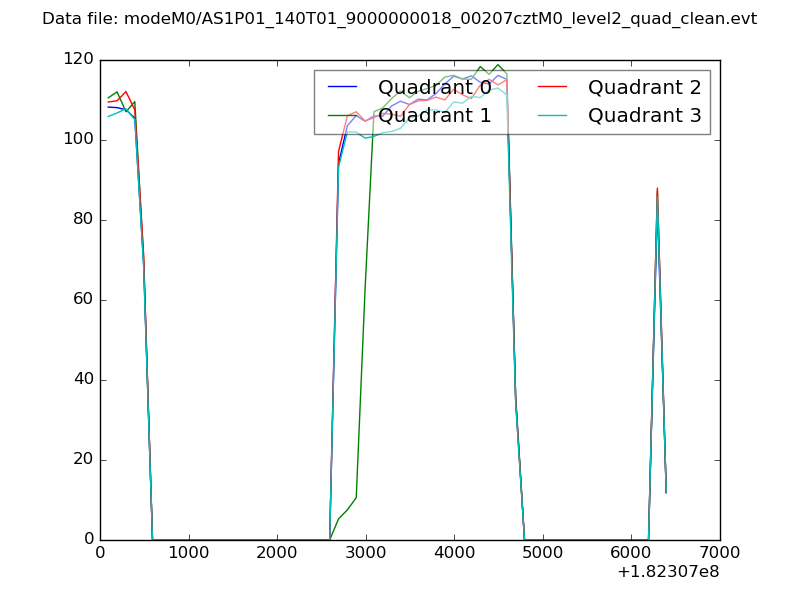 |
|
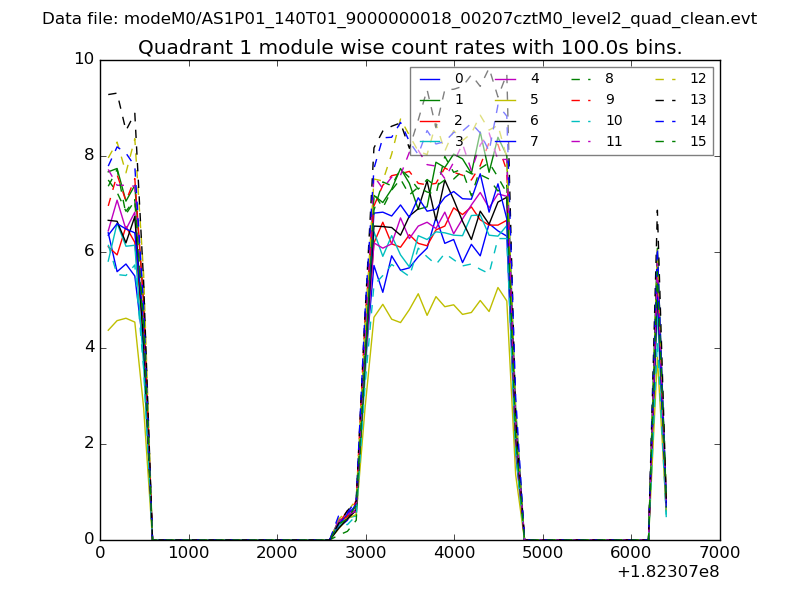
| Module-wise count rates for Quadrant A Data is divided into 100 sec bins |
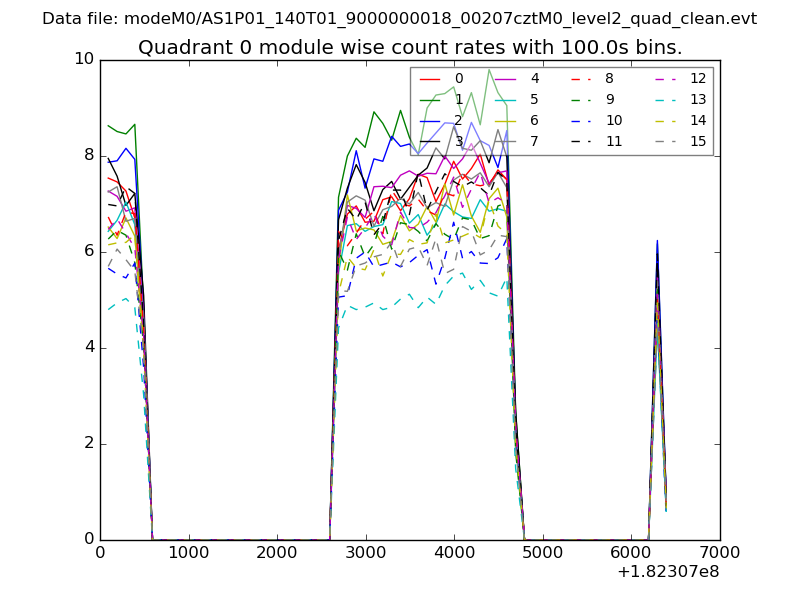 |
 |
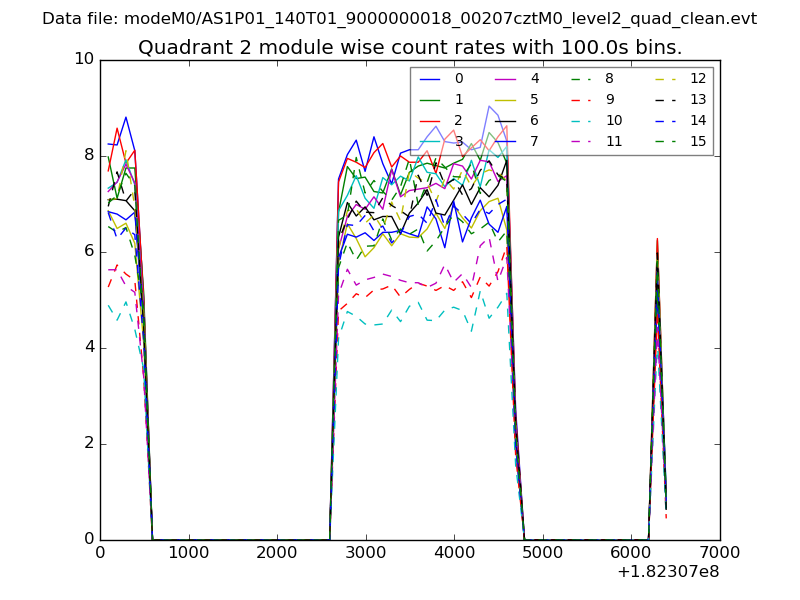
| Module-wise count rates for Quadrant B Data is divided into 100 sec bins |
 |
 |
| Module-wise count rates for Quadrant C Data is divided into 100 sec bins |
 |
 |
| Module-wise count rates for Quadrant D Data is divided into 100 sec bins |
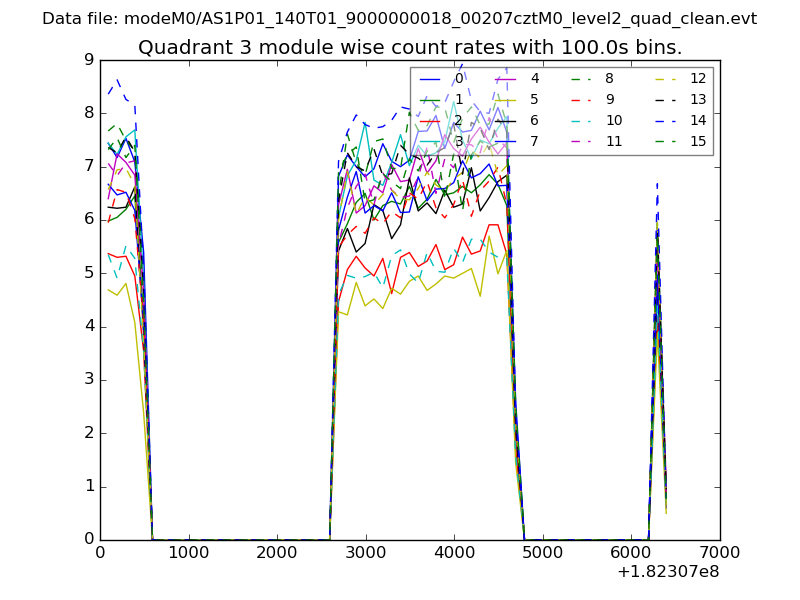 |
 |
| Parameter | Plot |
|---|---|
| CZT HV Monitor | 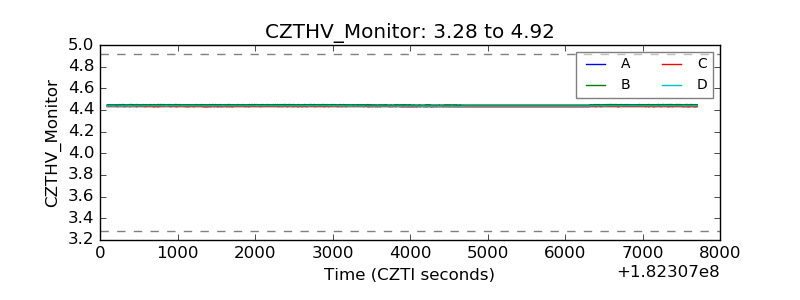 |
| D_VDD | 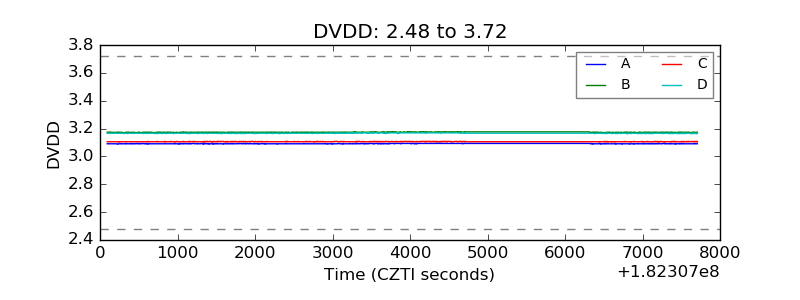 |
| Temperature 1 | 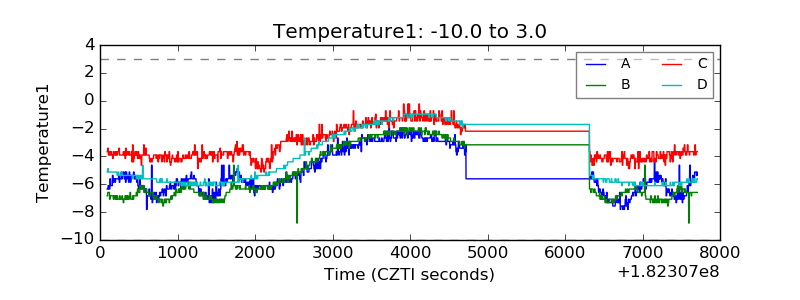 |
| Veto HV Monitor | 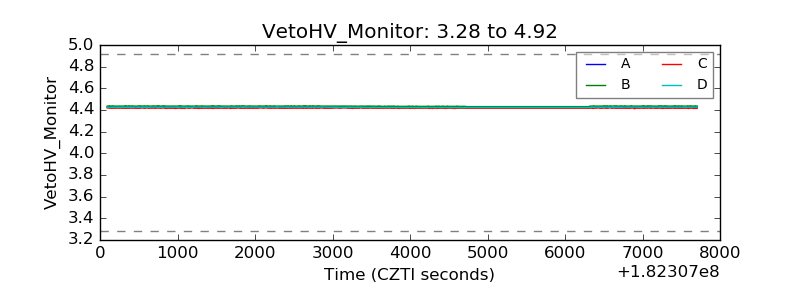 |
| Veto LLD | 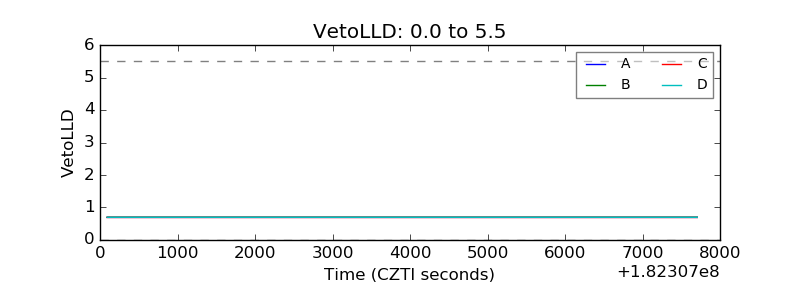 |
| Alpha Counter | 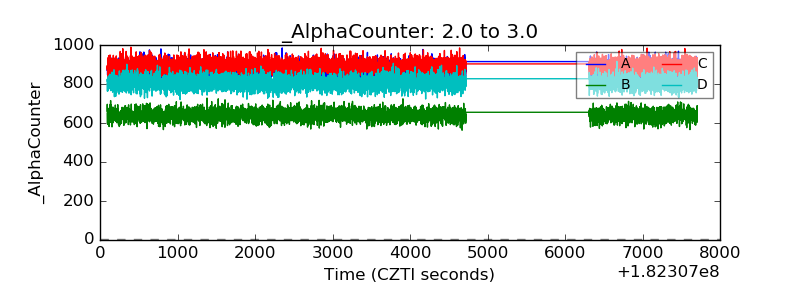 |
| _CPM_Rate | 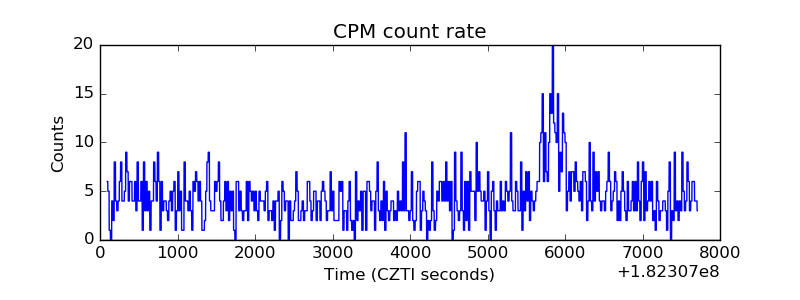 |
| CZT Counter | 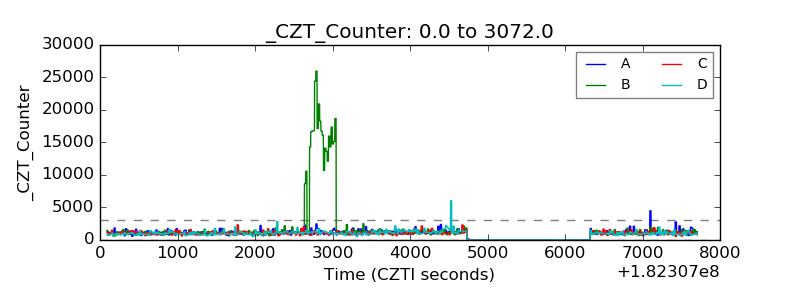 |
| +2.5 Volts monitor |  |
| +5 Volts monitor |  |
| _ROLL_ROT | 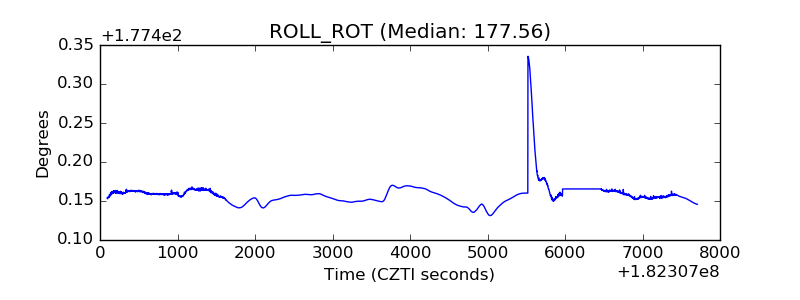 |
| _Roll_DEC | 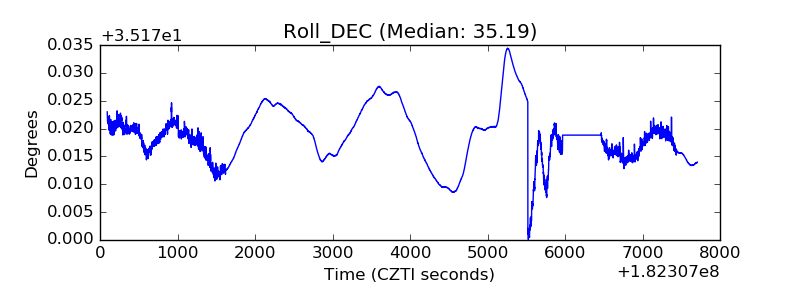 |
| _Roll_RA | 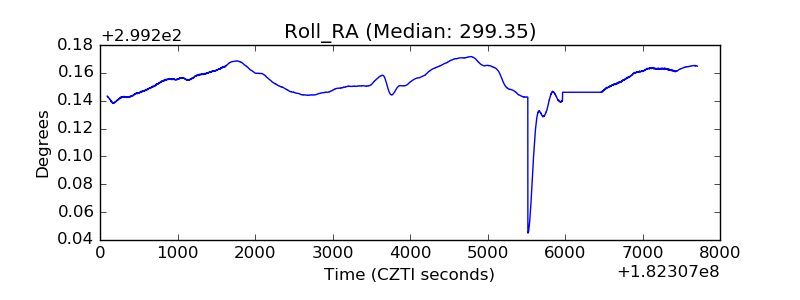 |
| Veto Counter | 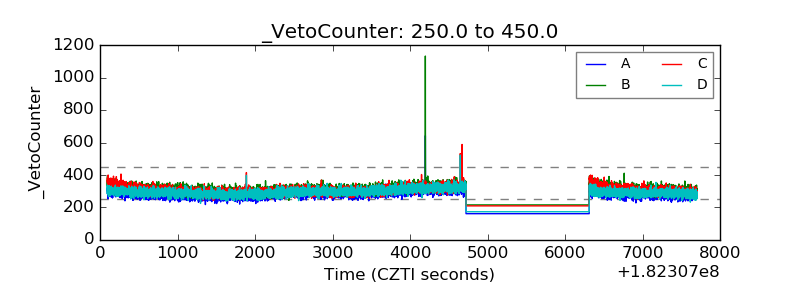 |