| Param | Original file | Final file |
|---|---|---|
| Filename | modeM0/AS1P01_140T01_9000000018_00209cztM0_level2.evt | modeM0/AS1P01_140T01_9000000018_00209cztM0_level2_quad_clean.evt |
| Size (bytes) | 1,061,576,640 | 52,113,600 |
| Size | 1012.4 MB | 49.7 MB |
| Events in quadrant A | 8,367,068 | 278,796 |
| Events in quadrant B | 7,958,276 | 287,466 |
| Events in quadrant C | 7,341,777 | 279,998 |
| Events in quadrant D | 8,038,326 | 264,139 |
| Mode SS | |||
|---|---|---|---|
| Quadrant | BADHDUFLAG | Total packets | Discarded packets |
| A | 0 | 136 | 0 |
| B | 0 | 136 | 0 |
| C | 0 | 136 | 0 |
| D | 0 | 136 | 0 |
| Mode M9 | |||
|---|---|---|---|
| Quadrant | BADHDUFLAG | Total packets | Discarded packets |
| A | 0 | 16 | 0 |
| B | 0 | 16 | 0 |
| C | 0 | 16 | 0 |
| D | 0 | 16 | 0 |
| Mode M0 | |||
|---|---|---|---|
| Quadrant | BADHDUFLAG | Total packets | Discarded packets |
| A | 0 | 29578 | 0 |
| B | 0 | 28407 | 0 |
| C | 0 | 26566 | 0 |
| D | 0 | 28650 | 0 |
| Quadrant | Total seconds | Saturated seconds | Saturation percentage |
|---|---|---|---|
| A | 6700 | 19 | 0.283582% |
| B | 6700 | 1 | 0.014925% |
| C | 6700 | 1 | 0.014925% |
| D | 6700 | 169 | 2.522388% |
Noise dominated data is calculated using 1-second bins in cleaned event files. If a bin has >2000 counts, and if more than 50% of those come from <1% of pixels, then it is considered to be noise-dominated and hence unusable.
| Quadrant | # 1 sec bins | Bins with >0 counts | Bins with >2000 counts | High rate bins dominated by noise | Noise dominated (total time) | Noise dominated (detector-on time) | Marked lightcurve |
|---|---|---|---|---|---|---|---|
| A | 8291 | 6702 | 216 | 216 | 2.61% | 3.22% | 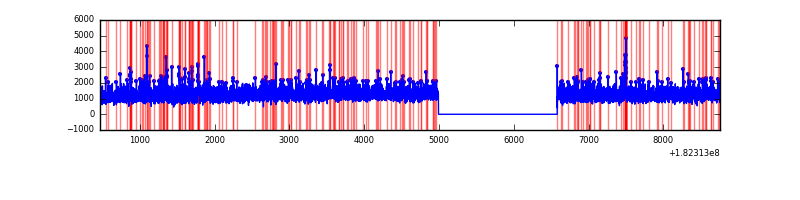 |
| B | 8291 | 6702 | 85 | 85 | 1.03% | 1.27% | 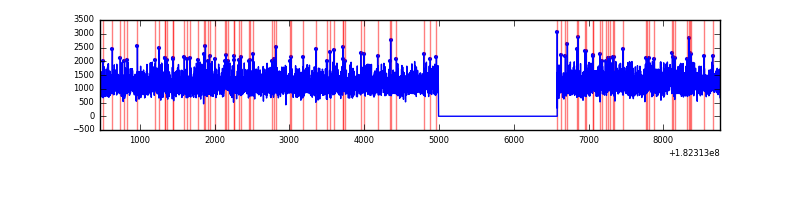 |
| C | 8291 | 6702 | 59 | 59 | 0.71% | 0.88% | 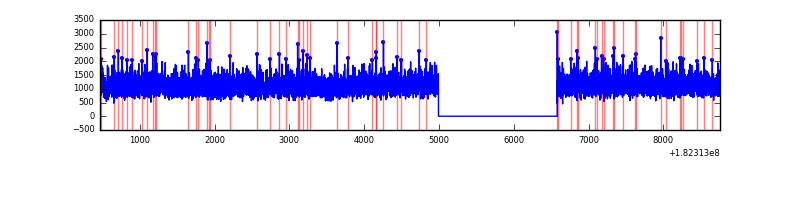 |
| D | 8291 | 6702 | 358 | 358 | 4.32% | 5.34% | 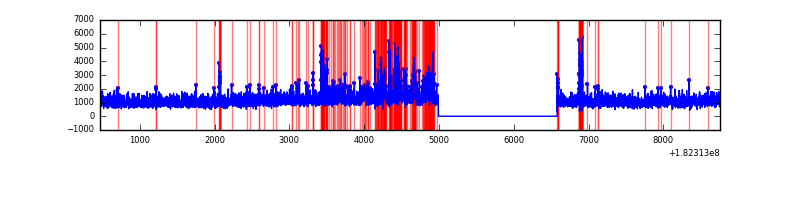 |
Top three noisy pixels from each quadrant. If the there are fewer than three noisy pixels in the level2.evt file, extra rows are filled as -1
| Pixel properties | Quadrant properties | ||||||
|---|---|---|---|---|---|---|---|
| Quadrant | DetID | PixID | Counts | Sigma | Mean | Median | Sigma |
| A | 0 | 96 | 169911 | 361.45 | 2071 | 2050 | 464.4 |
| A | 15 | 66 | 73924 | 154.76 | 2071 | 2050 | 464.4 |
| A | 12 | 150 | 54393 | 112.71 | 2071 | 2050 | 464.4 |
| B | 15 | 219 | 20320 | 37.03 | 2073 | 2087 | 492.4 |
| B | 0 | 183 | 11001 | 18.1 | 2073 | 2087 | 492.4 |
| B | 0 | 190 | 9297 | 14.64 | 2073 | 2087 | 492.4 |
| C | 9 | 54 | 26089 | 46.41 | 1857 | 1922 | 520.7 |
| C | 9 | 51 | 9255 | 14.08 | 1857 | 1922 | 520.7 |
| C | 1 | 1 | 8116 | 11.89 | 1857 | 1922 | 520.7 |
| D | 10 | 154 | 450811 | 809.74 | 1812 | 1871 | 554.4 |
| D | 1 | 5 | 171429 | 305.82 | 1812 | 1871 | 554.4 |
| D | 1 | 4 | 143412 | 255.29 | 1812 | 1871 | 554.4 |
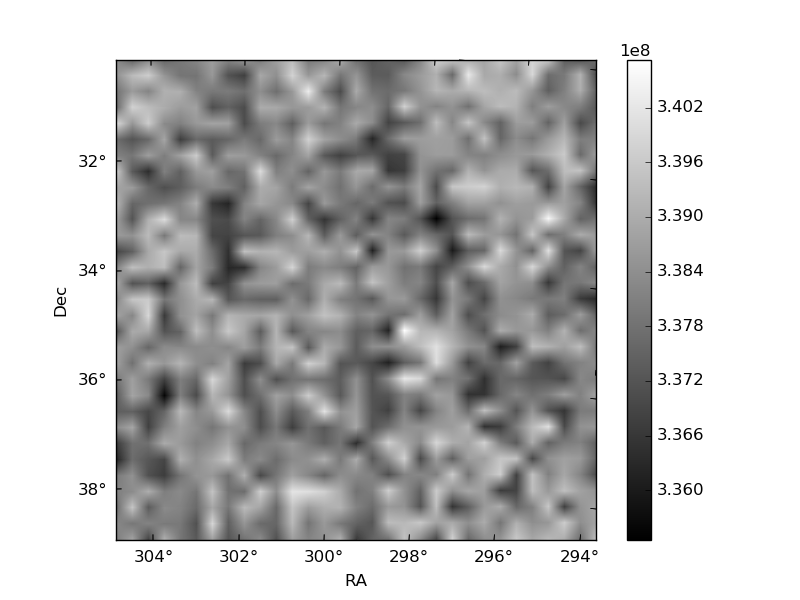
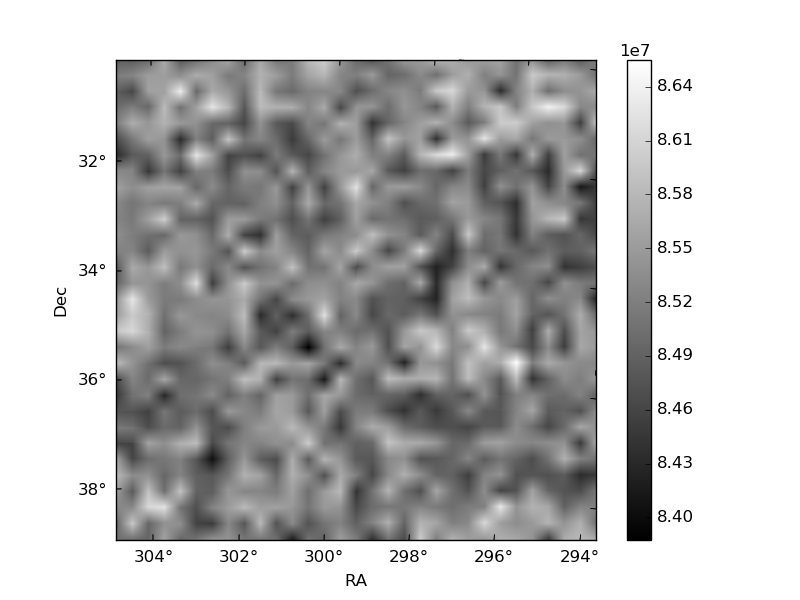
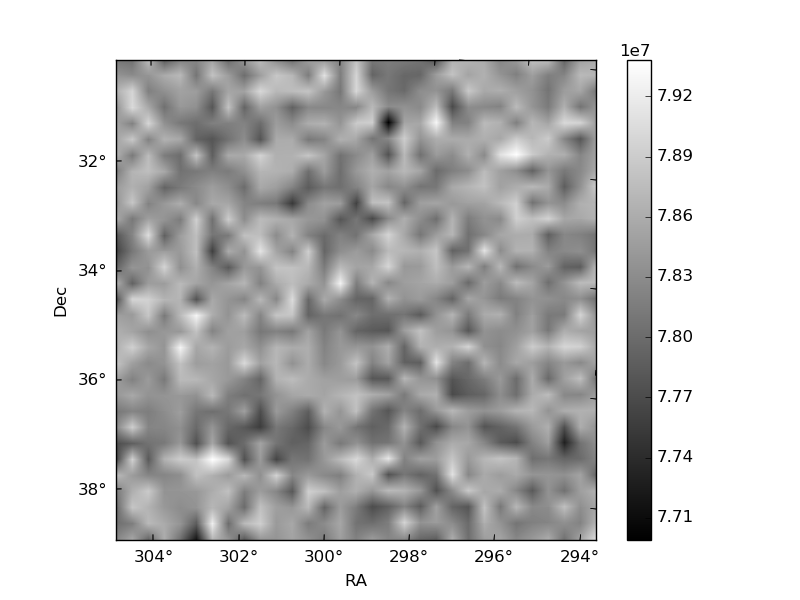
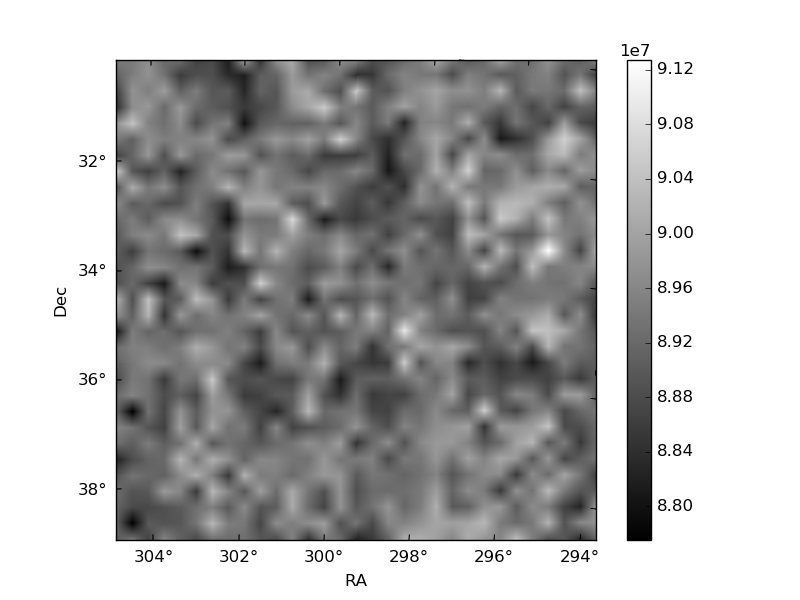
Histogram calculated using DETX and DETY for each event in the final _common_clean file
| Quadrant A | 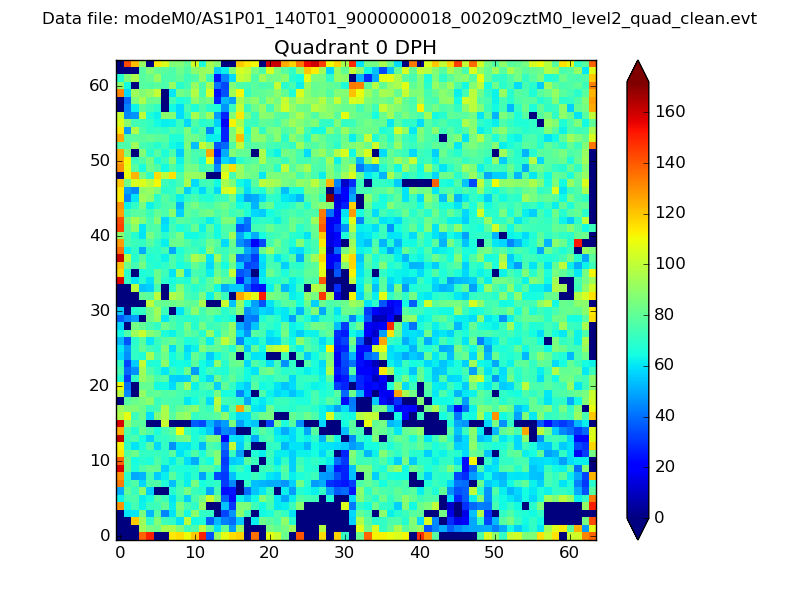 |
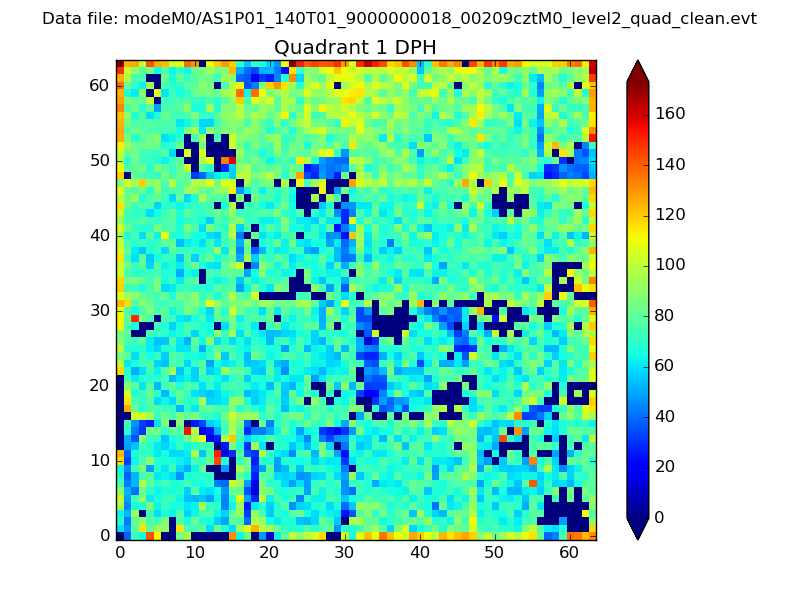 |
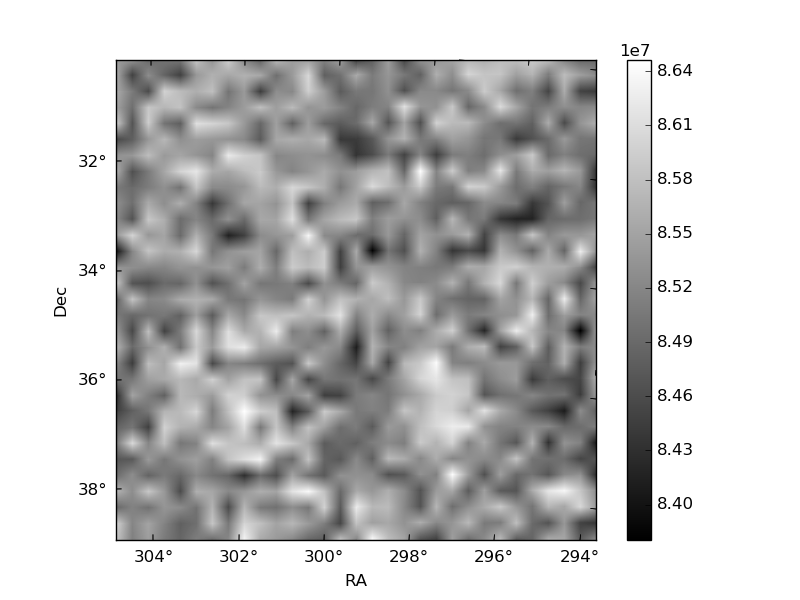
Quadrant B |
|---|---|---|---|
| Quadrant D | 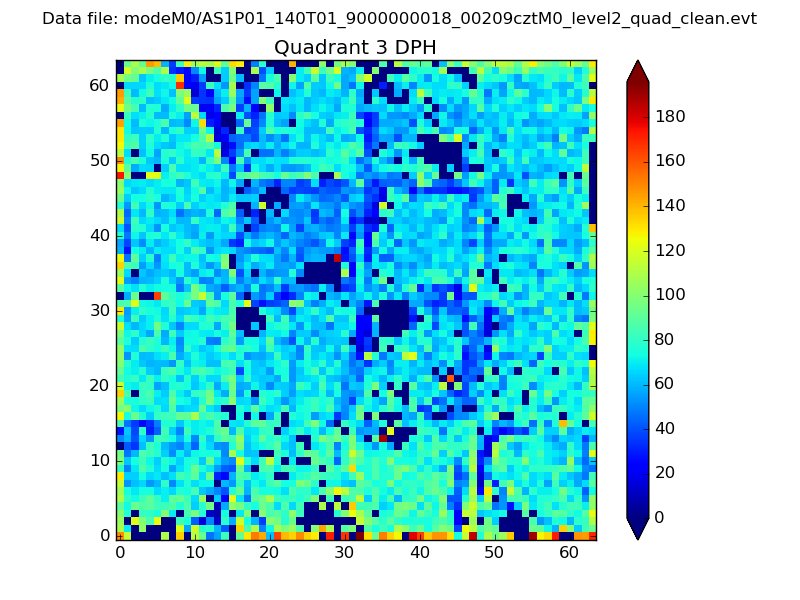 |
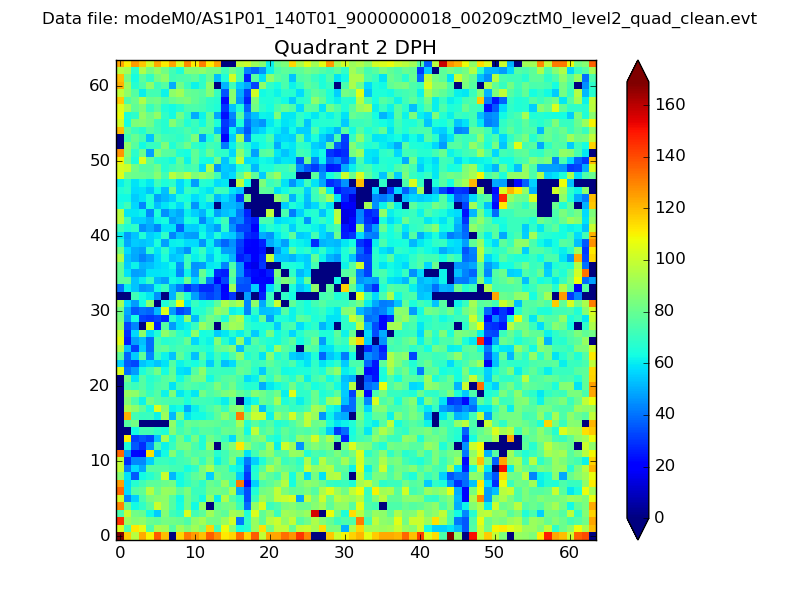 |
Quadrant C |
| Plot type | Count rate plots | Images |
|---|---|---|
| Comparison with Poisson distribution Blue bars denote a histogram of data divided into 1 sec bins. Red curve is a Poisson curve with rate = median count rate of data. |
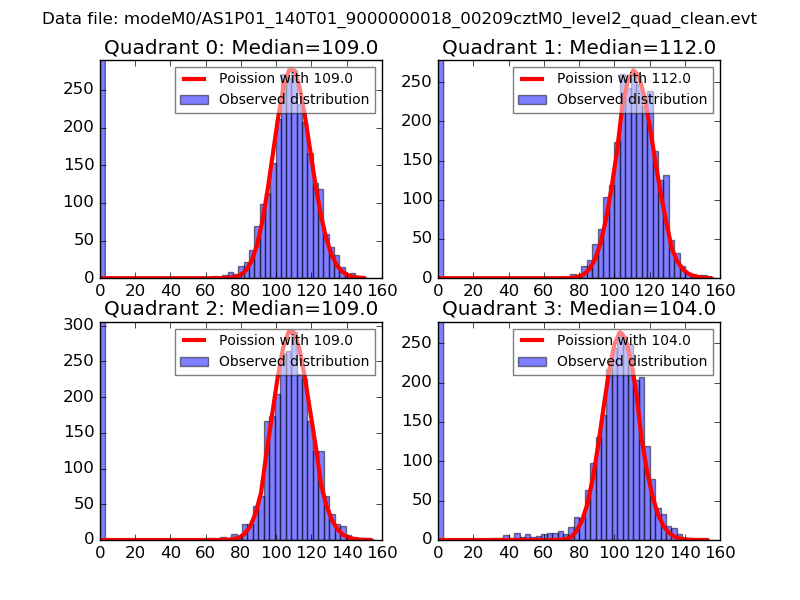 |
 |
| Quadrant-wise count rates Data is divided into 100 sec bins |
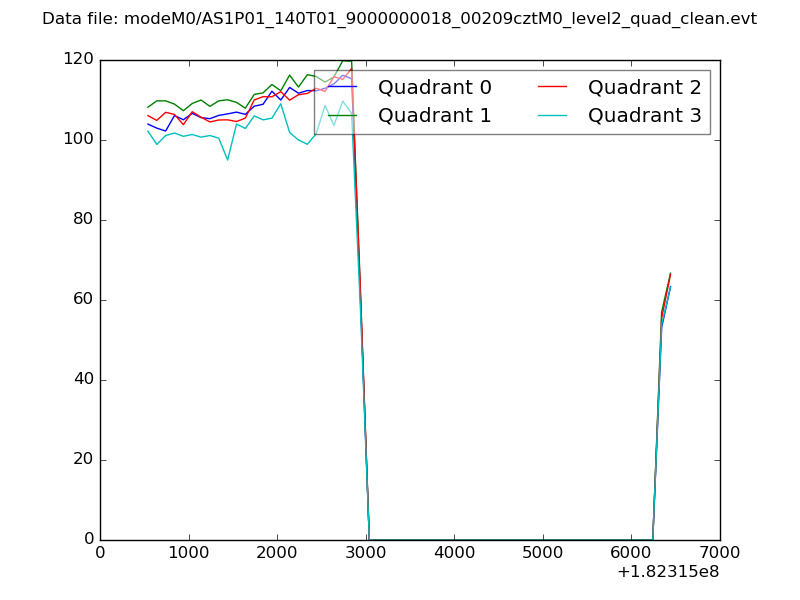 |
|
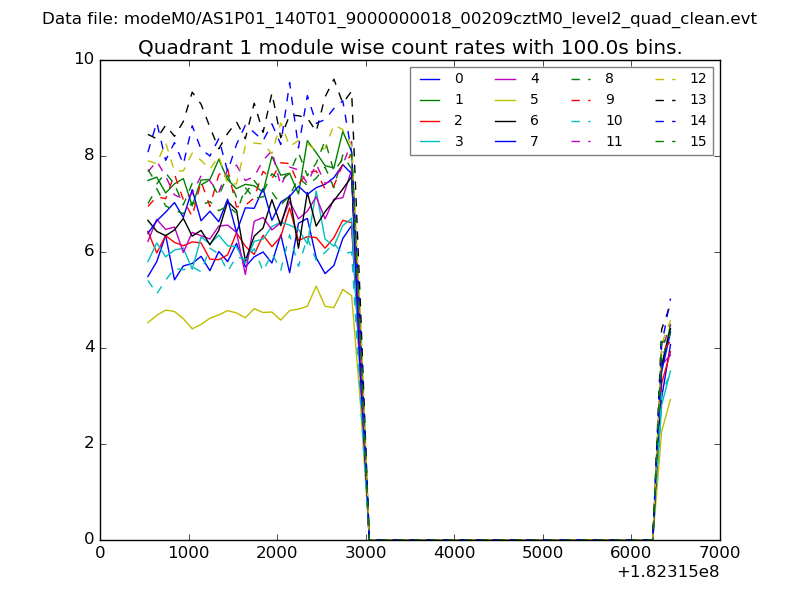
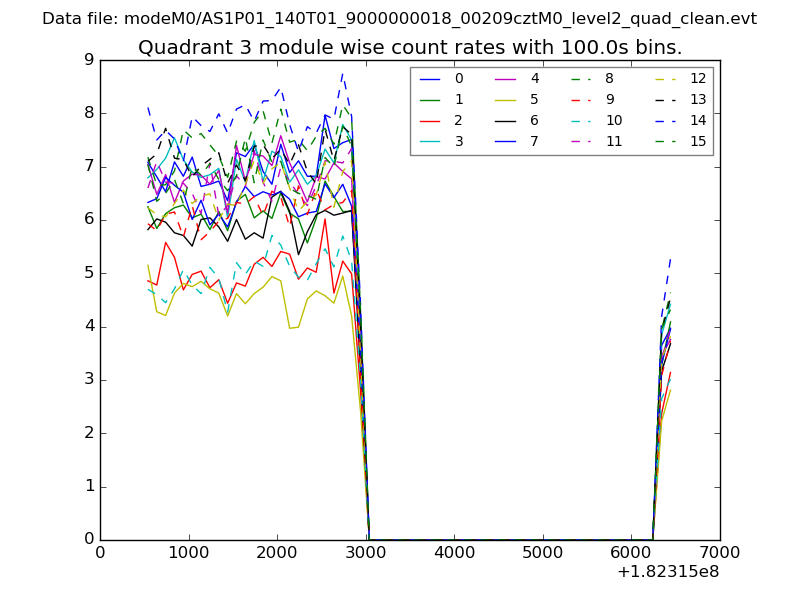
| Module-wise count rates for Quadrant A Data is divided into 100 sec bins |
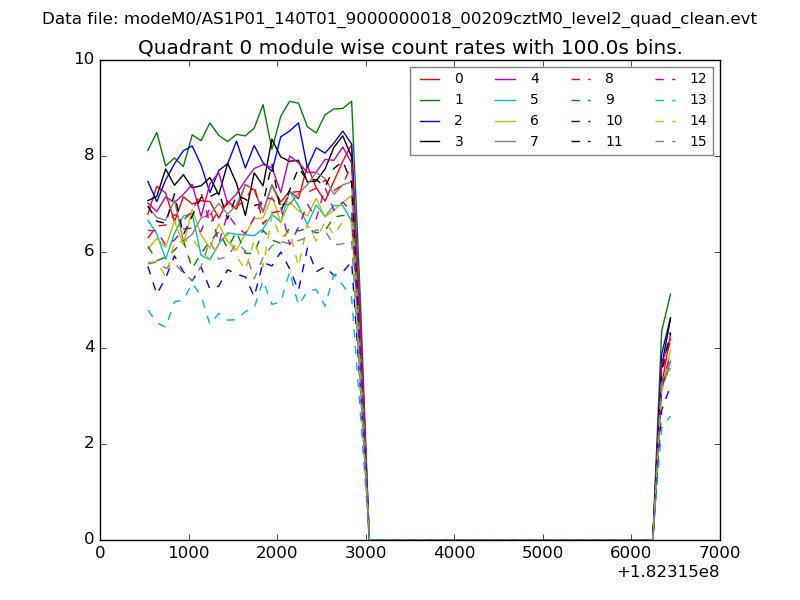 |
 |
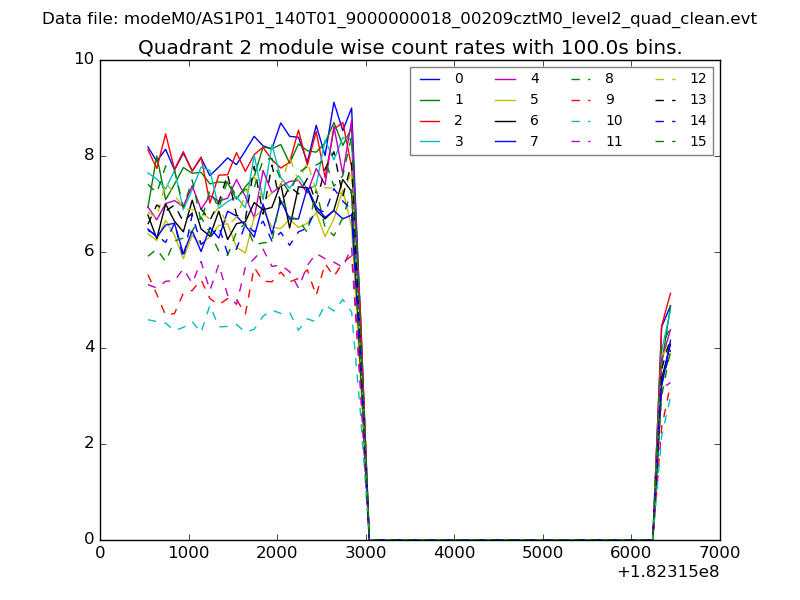
| Module-wise count rates for Quadrant B Data is divided into 100 sec bins |
 |
 |
| Module-wise count rates for Quadrant C Data is divided into 100 sec bins |
 |
 |
| Module-wise count rates for Quadrant D Data is divided into 100 sec bins |
 |
 |
| Parameter | Plot |
|---|---|
| CZT HV Monitor | 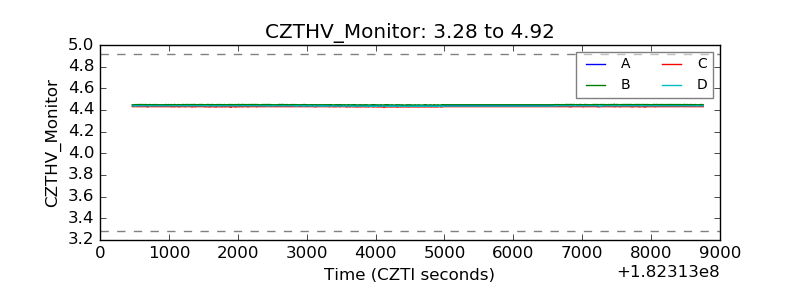 |
| D_VDD | 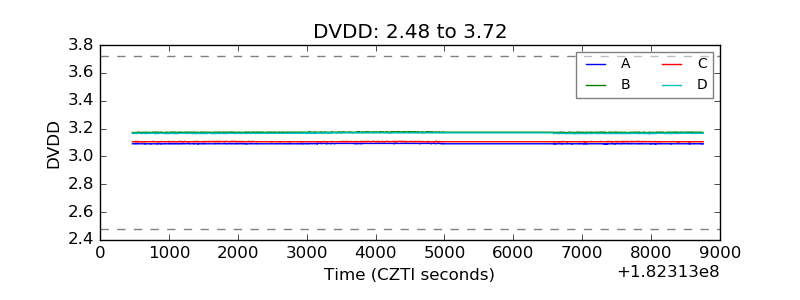 |
| Temperature 1 | 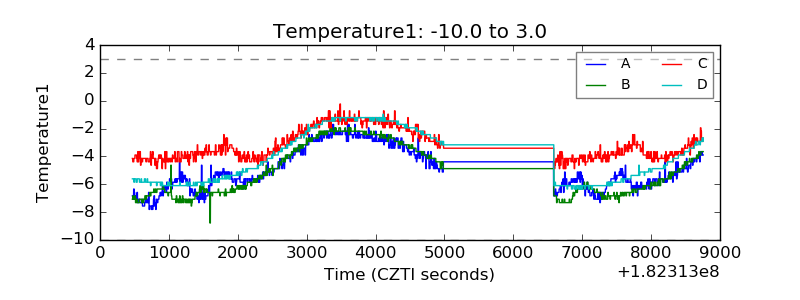 |
| Veto HV Monitor | 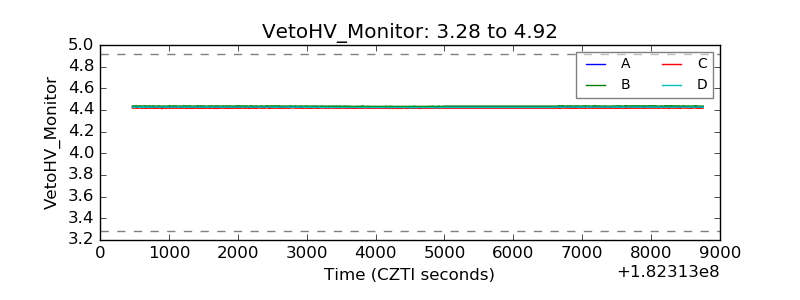 |
| Veto LLD | 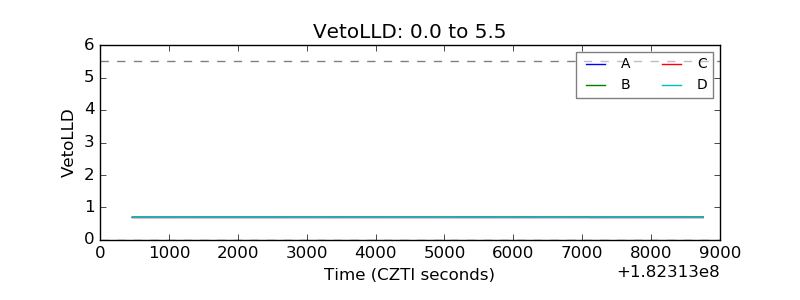 |
| Alpha Counter | 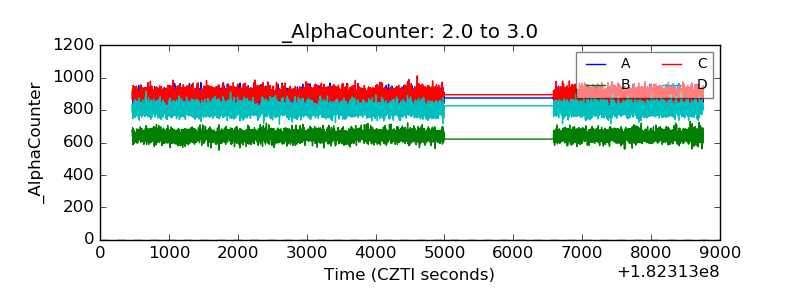 |
| _CPM_Rate | 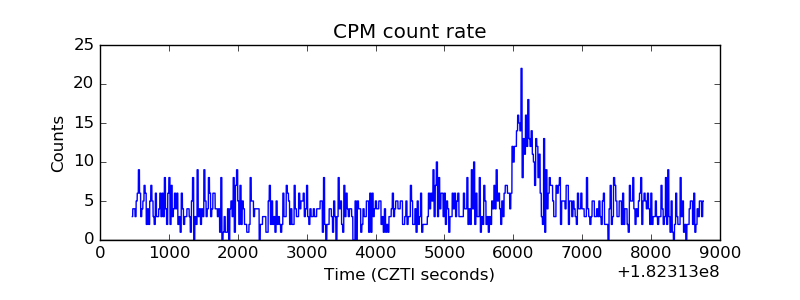 |
| CZT Counter | 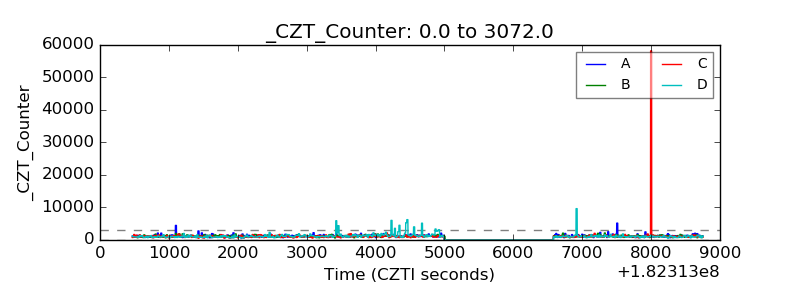 |
| +2.5 Volts monitor |  |
| +5 Volts monitor |  |
| _ROLL_ROT | 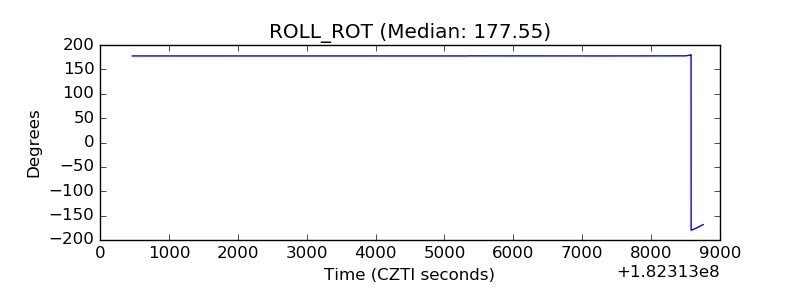 |
| _Roll_DEC | 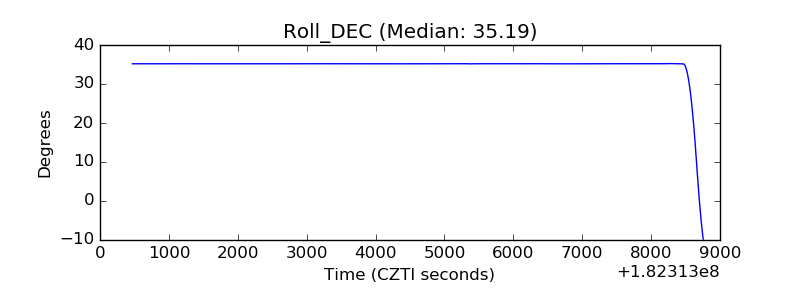 |
| _Roll_RA | 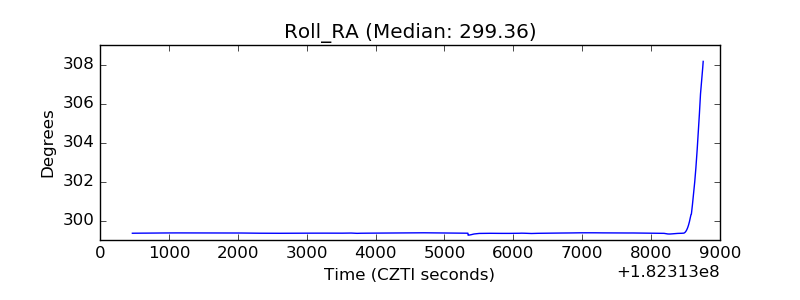 |
| Veto Counter | 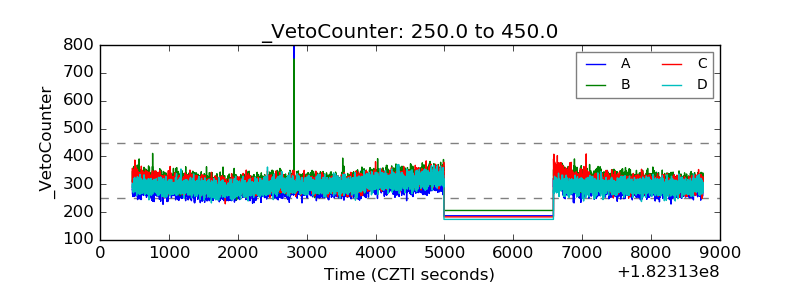 |