| Param | Original file | Final file |
|---|---|---|
| Filename | modeM0/AS1P01_118T01_9000000020_00211cztM0_level2.evt | modeM0/AS1P01_118T01_9000000020_00211cztM0_level2_quad_clean.evt |
| Size (bytes) | 931,921,920 | 64,681,920 |
| Size | 888.8 MB | 61.7 MB |
| Events in quadrant A | 7,267,058 | 389,136 |
| Events in quadrant B | 7,002,747 | 394,696 |
| Events in quadrant C | 6,649,002 | 390,601 |
| Events in quadrant D | 6,922,958 | 381,935 |
| Mode SS | |||
|---|---|---|---|
| Quadrant | BADHDUFLAG | Total packets | Discarded packets |
| A | 0 | 118 | 0 |
| B | 0 | 118 | 0 |
| C | 0 | 118 | 0 |
| D | 0 | 118 | 0 |
| Mode M0 | |||
|---|---|---|---|
| Quadrant | BADHDUFLAG | Total packets | Discarded packets |
| A | 0 | 25691 | 3 |
| B | 0 | 24877 | 2 |
| C | 0 | 23843 | 6 |
| D | 0 | 24626 | 2 |
| Mode M9 | |||
|---|---|---|---|
| Quadrant | BADHDUFLAG | Total packets | Discarded packets |
| A | 0 | 20 | 0 |
| B | 0 | 20 | 0 |
| C | 0 | 20 | 0 |
| D | 0 | 21 | 0 |
| Quadrant | Total seconds | Saturated seconds | Saturation percentage |
|---|---|---|---|
| A | 5748 | 7 | 0.121781% |
| B | 5748 | 4 | 0.069589% |
| C | 5747 | 5 | 0.087002% |
| D | 5748 | 10 | 0.173974% |
Noise dominated data is calculated using 1-second bins in cleaned event files. If a bin has >2000 counts, and if more than 50% of those come from <1% of pixels, then it is considered to be noise-dominated and hence unusable.
| Quadrant | # 1 sec bins | Bins with >0 counts | Bins with >2000 counts | High rate bins dominated by noise | Noise dominated (total time) | Noise dominated (detector-on time) | Marked lightcurve |
|---|---|---|---|---|---|---|---|
| A | 7454 | 5749 | 220 | 220 | 2.95% | 3.83% | 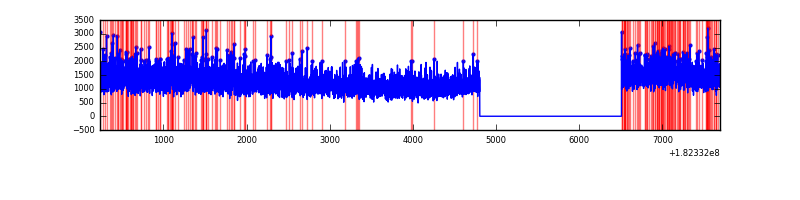 |
| B | 7454 | 5749 | 112 | 112 | 1.50% | 1.95% | 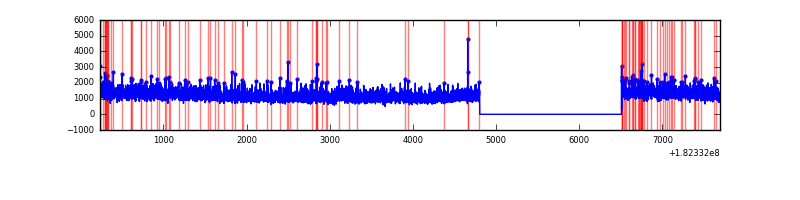 |
| C | 7454 | 5749 | 98 | 98 | 1.31% | 1.70% | 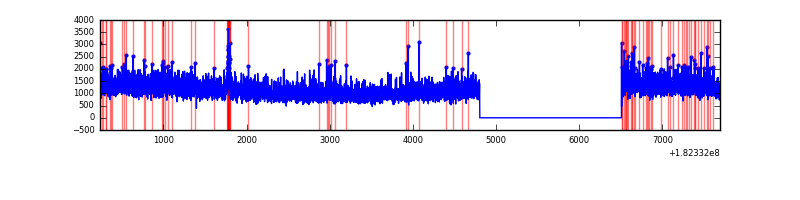 |
| D | 7454 | 5749 | 114 | 114 | 1.53% | 1.98% | 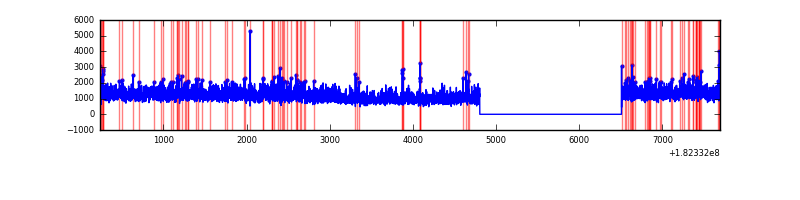 |
Top three noisy pixels from each quadrant. If the there are fewer than three noisy pixels in the level2.evt file, extra rows are filled as -1
| Pixel properties | Quadrant properties | ||||||
|---|---|---|---|---|---|---|---|
| Quadrant | DetID | PixID | Counts | Sigma | Mean | Median | Sigma |
| A | 15 | 127 | 116031 | 279.61 | 1832 | 1817 | 408.5 |
| A | 0 | 253 | 21856 | 49.06 | 1832 | 1817 | 408.5 |
| A | 12 | 150 | 21687 | 48.64 | 1832 | 1817 | 408.5 |
| B | 5 | 2 | 19619 | 42.05 | 1807 | 1818 | 423.3 |
| B | 15 | 222 | 18227 | 38.76 | 1807 | 1818 | 423.3 |
| B | 0 | 148 | 16635 | 35.0 | 1807 | 1818 | 423.3 |
| C | 3 | 159 | 56416 | 116.24 | 1655 | 1710 | 470.6 |
| C | 0 | 186 | 45780 | 93.64 | 1655 | 1710 | 470.6 |
| C | 1 | 1 | 35902 | 72.65 | 1655 | 1710 | 470.6 |
| D | 1 | 4 | 330383 | 656.6 | 1646 | 1698 | 500.6 |
| D | 1 | 5 | 61788 | 120.04 | 1646 | 1698 | 500.6 |
| D | 13 | 117 | 39783 | 76.08 | 1646 | 1698 | 500.6 |
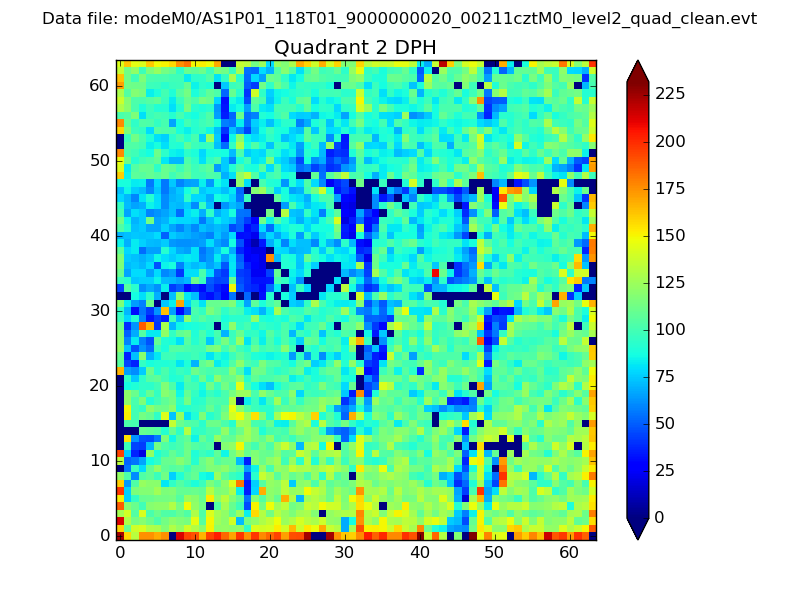
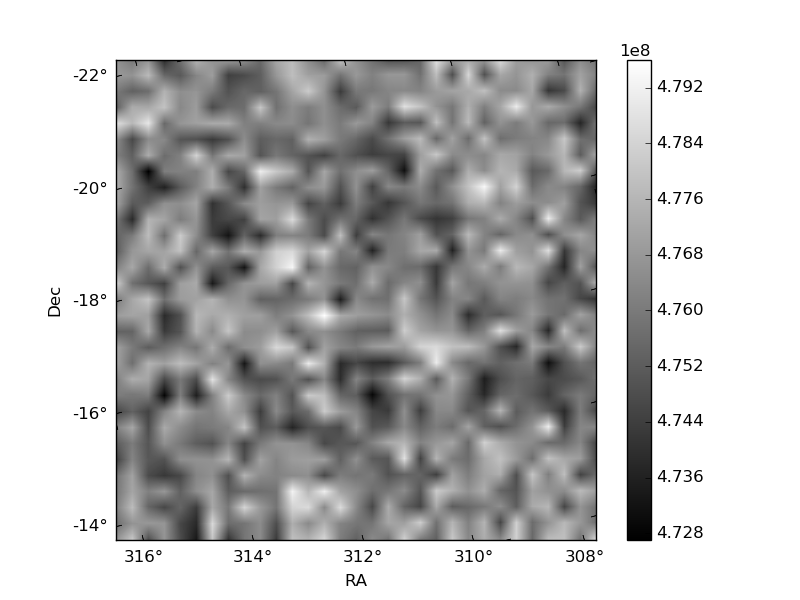
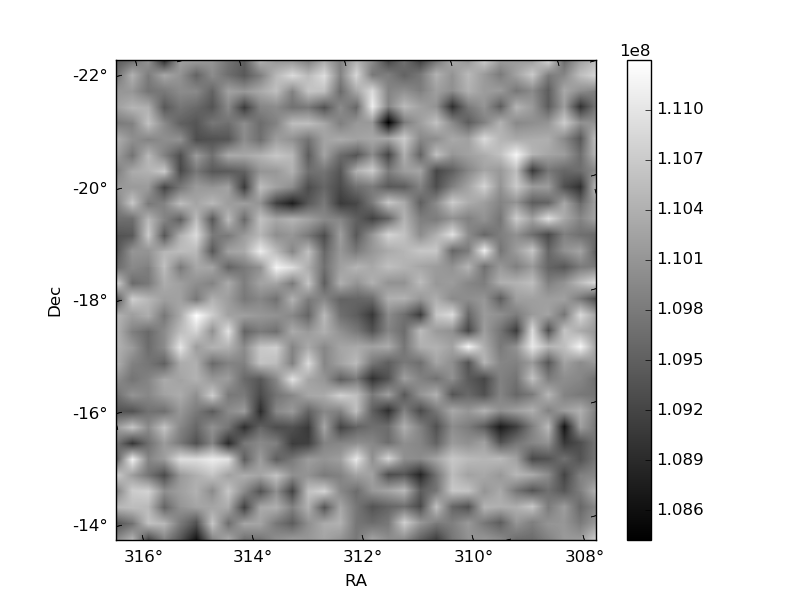
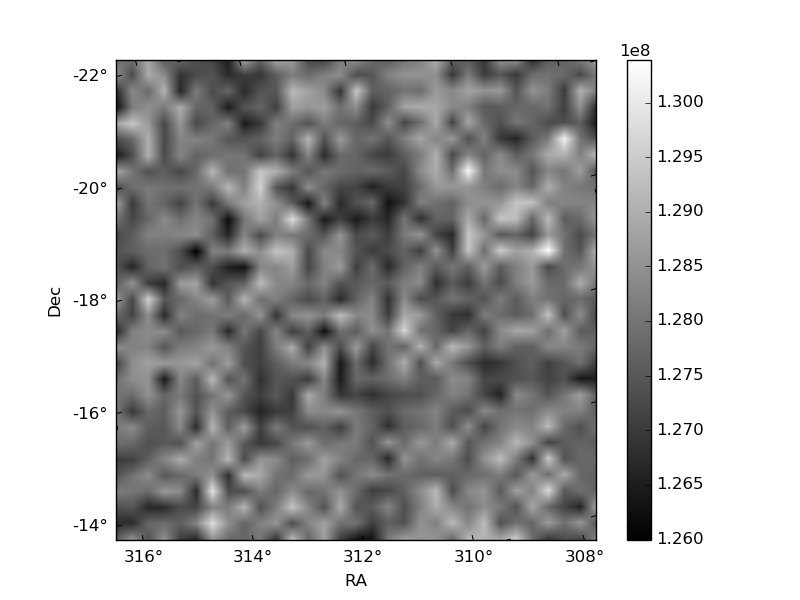
Histogram calculated using DETX and DETY for each event in the final _common_clean file
| Quadrant A | 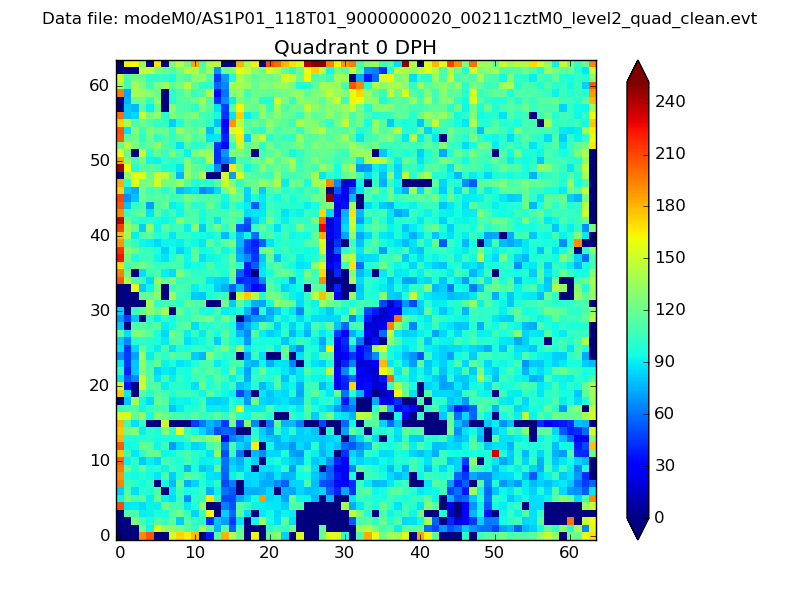 |
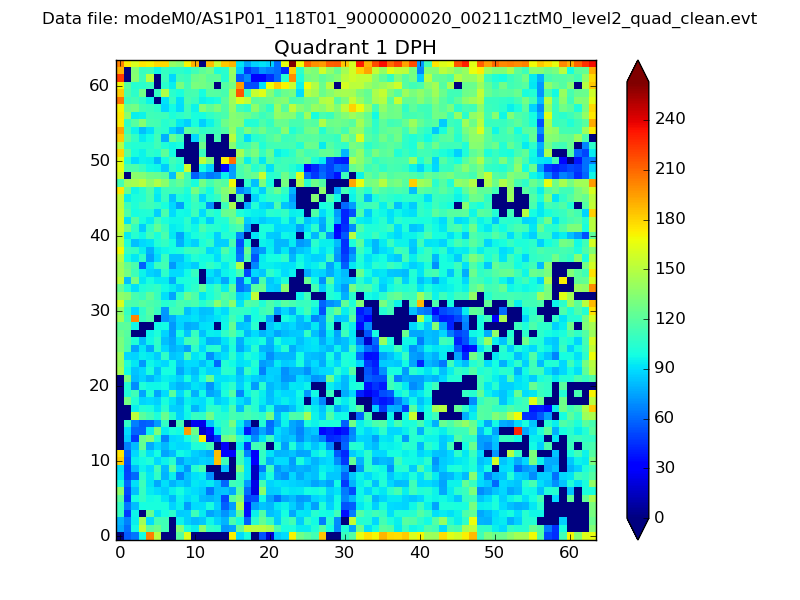 |
Quadrant B |
|---|---|---|---|
| Quadrant D | 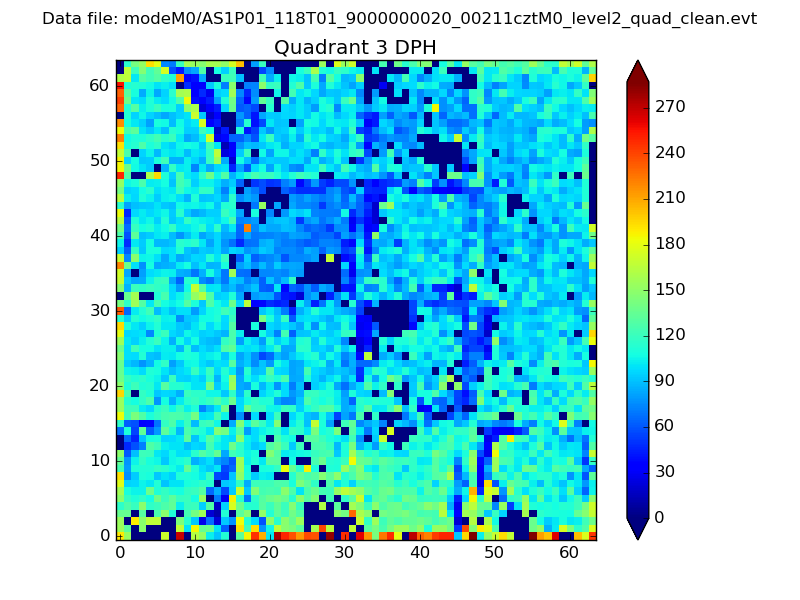 |
 |
Quadrant C |
| Plot type | Count rate plots | Images |
|---|---|---|
| Comparison with Poisson distribution Blue bars denote a histogram of data divided into 1 sec bins. Red curve is a Poisson curve with rate = median count rate of data. |
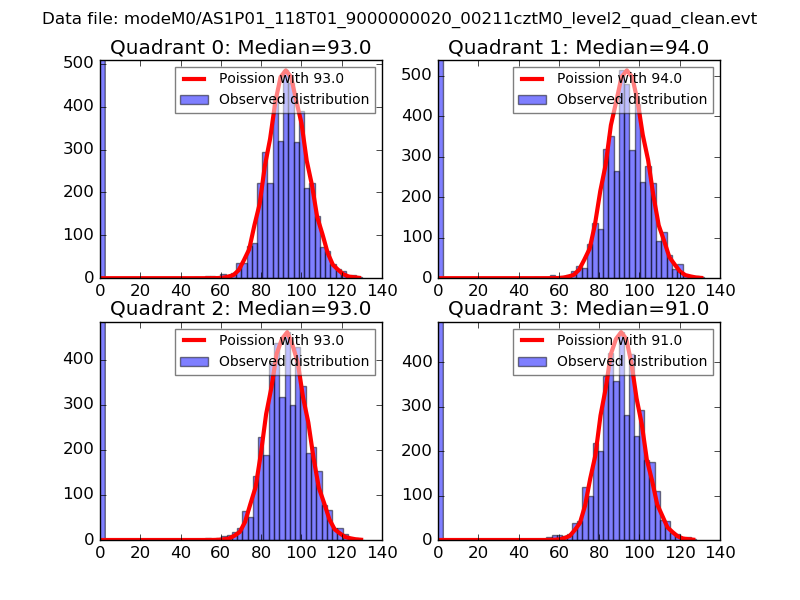 |
 |
| Quadrant-wise count rates Data is divided into 100 sec bins |
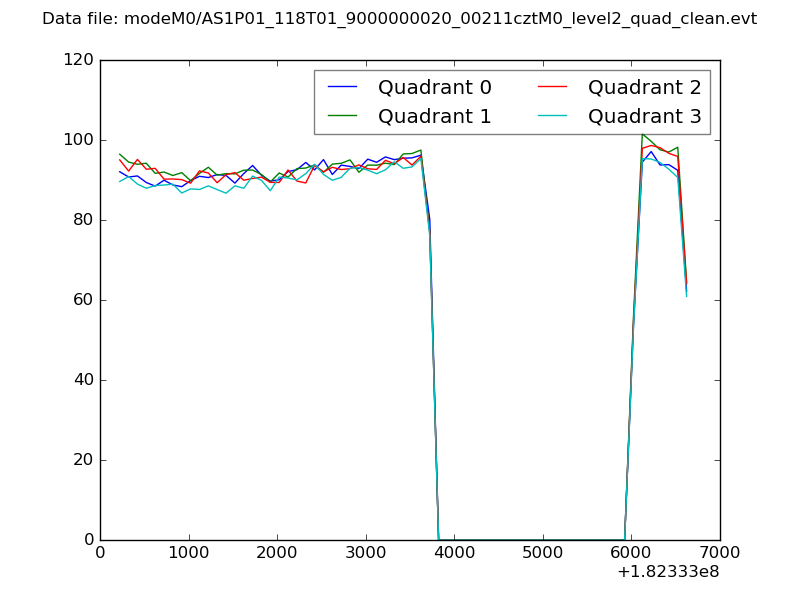 |
|
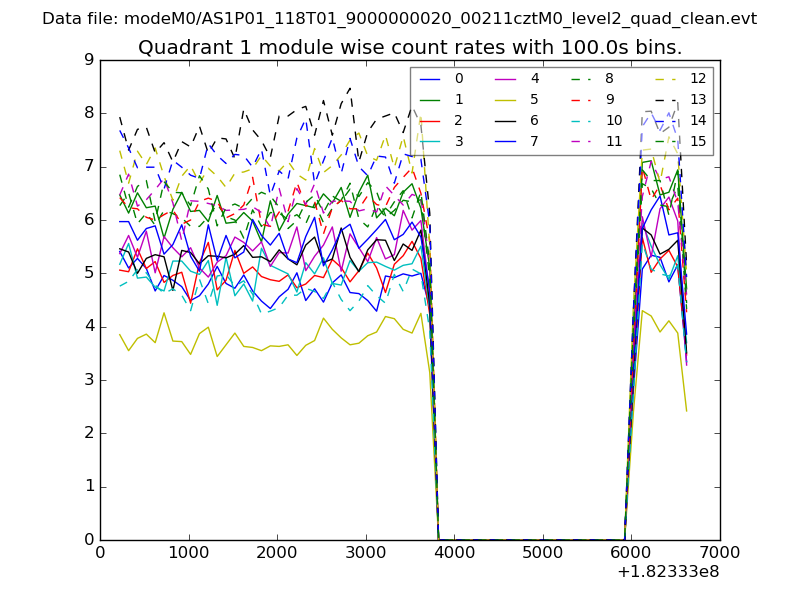
| Module-wise count rates for Quadrant A Data is divided into 100 sec bins |
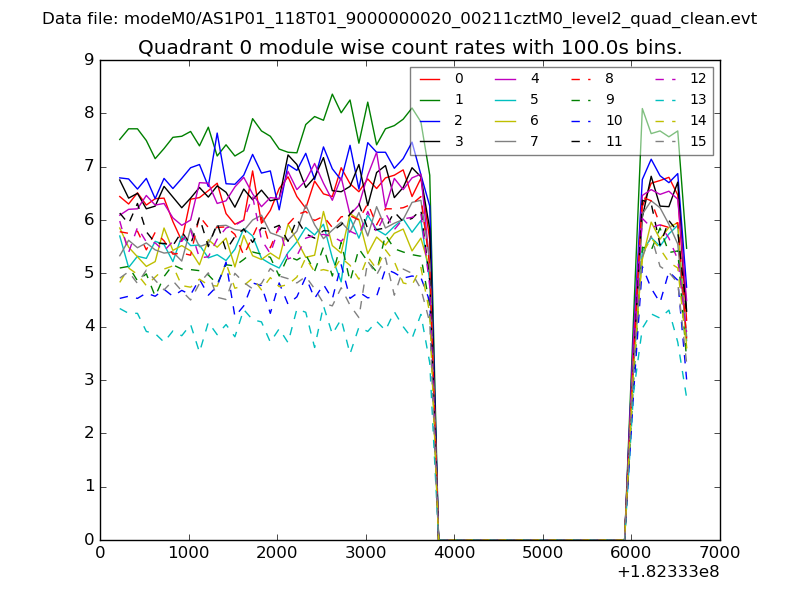 |
 |
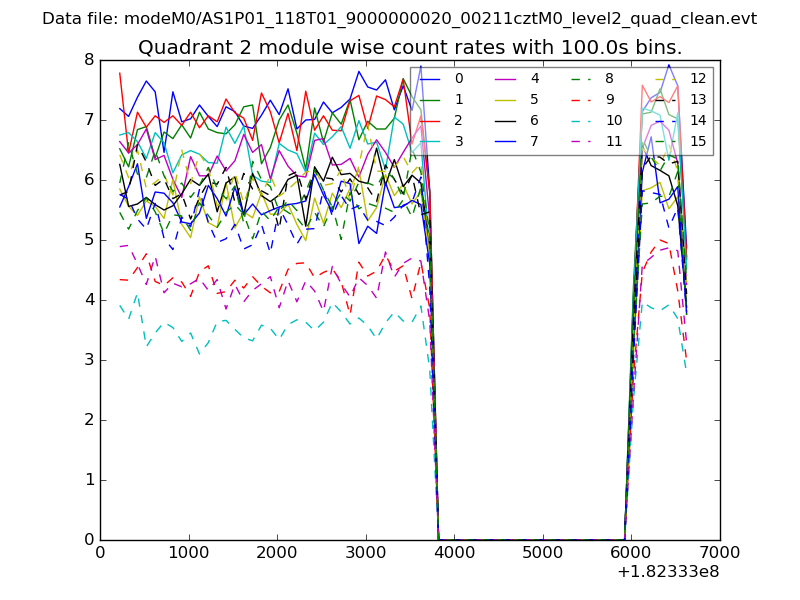
| Module-wise count rates for Quadrant B Data is divided into 100 sec bins |
 |
 |
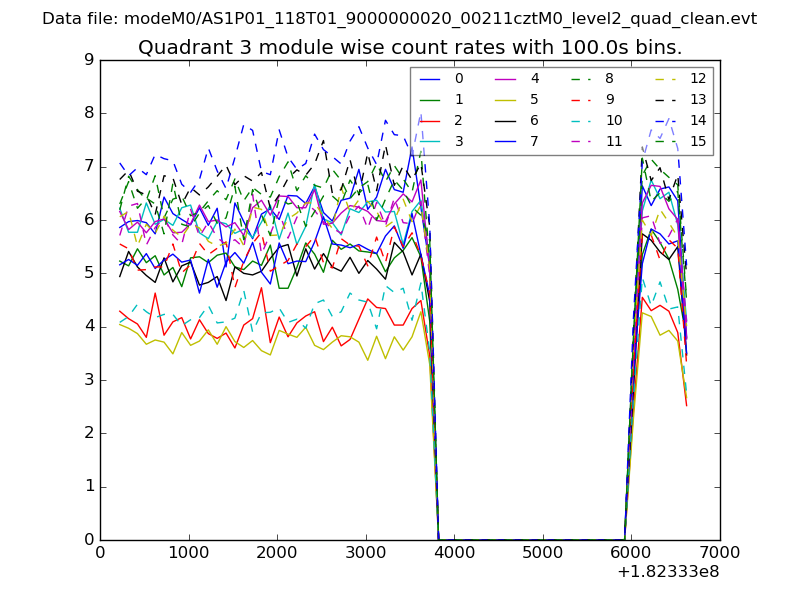
| Module-wise count rates for Quadrant C Data is divided into 100 sec bins |
 |
 |
| Module-wise count rates for Quadrant D Data is divided into 100 sec bins |
 |
 |
| Parameter | Plot |
|---|---|
| CZT HV Monitor | 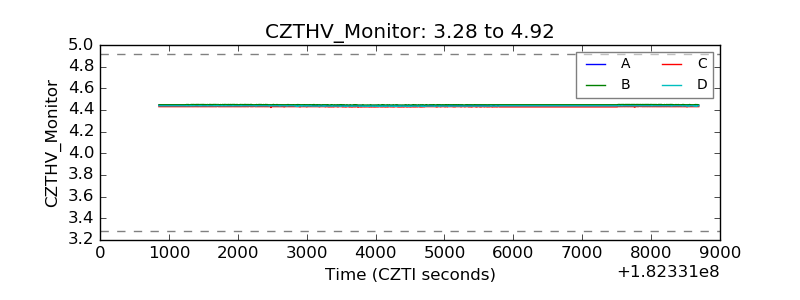 |
| D_VDD | 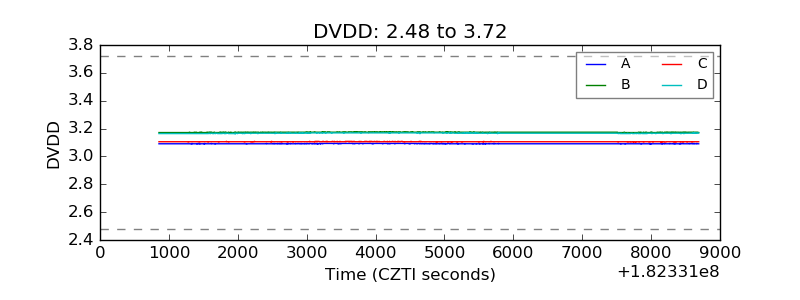 |
| Temperature 1 | 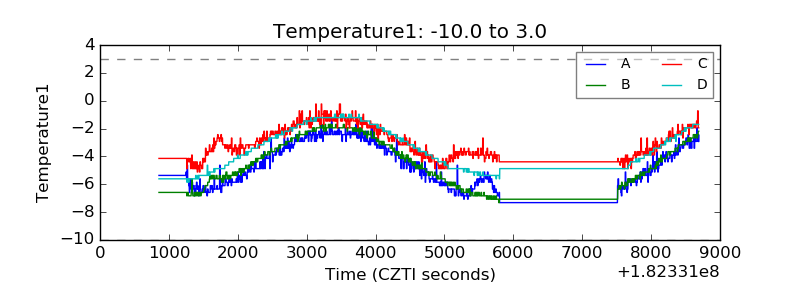 |
| Veto HV Monitor | 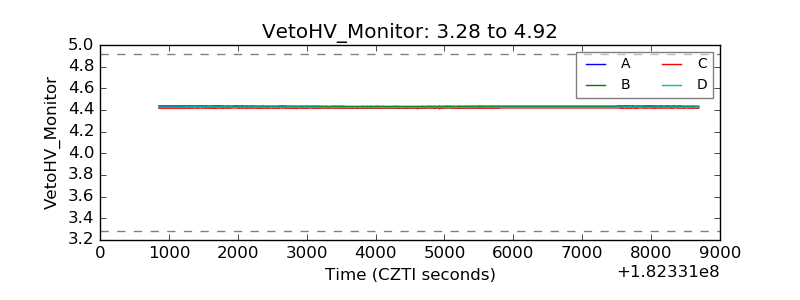 |
| Veto LLD | 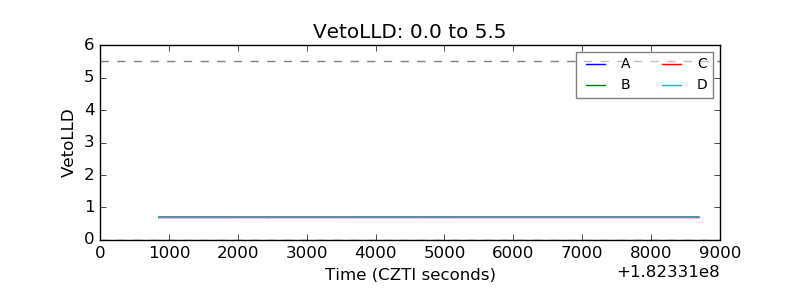 |
| Alpha Counter | 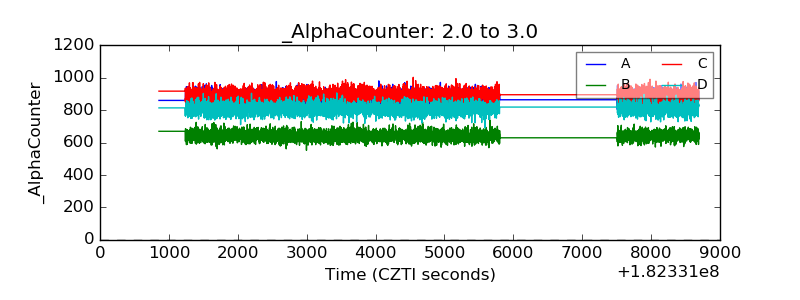 |
| _CPM_Rate | 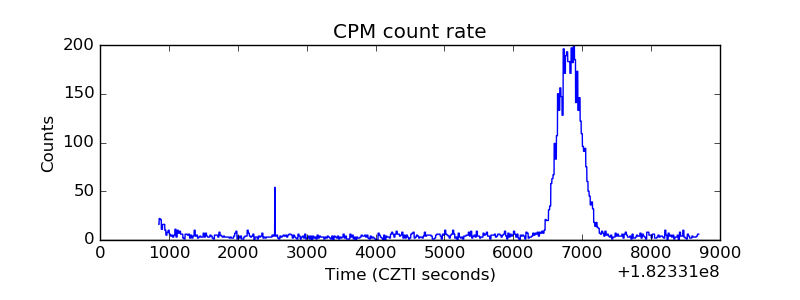 |
| CZT Counter | 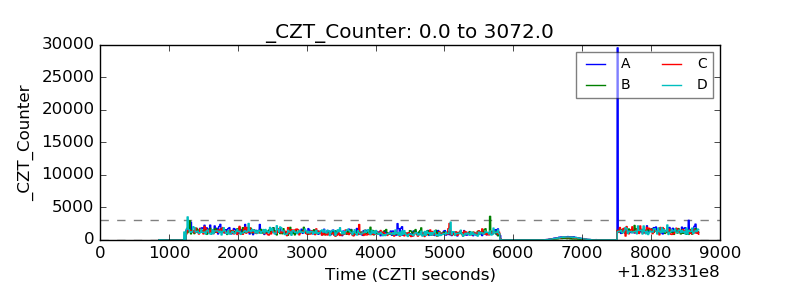 |
| +2.5 Volts monitor |  |
| +5 Volts monitor |  |
| _ROLL_ROT | 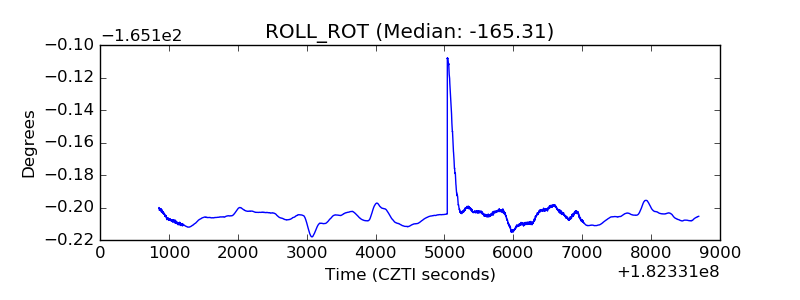 |
| _Roll_DEC | 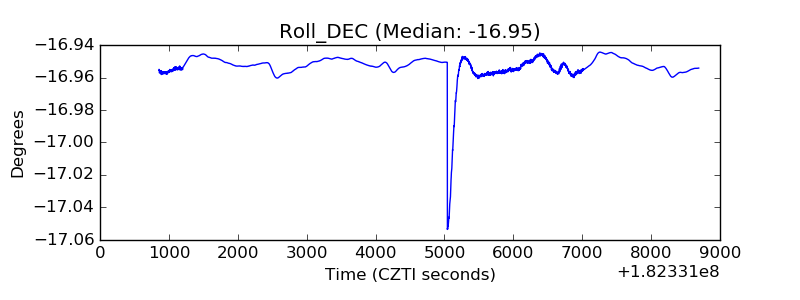 |
| _Roll_RA | 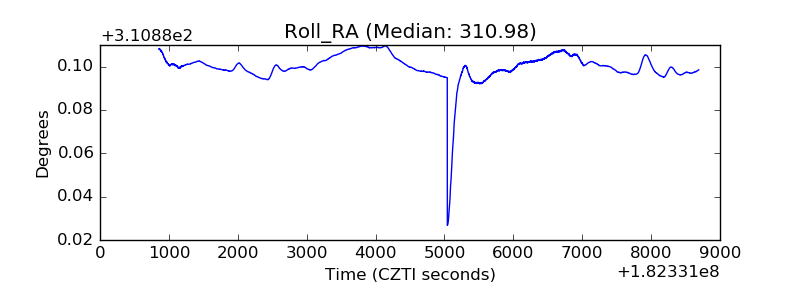 |
| Veto Counter | 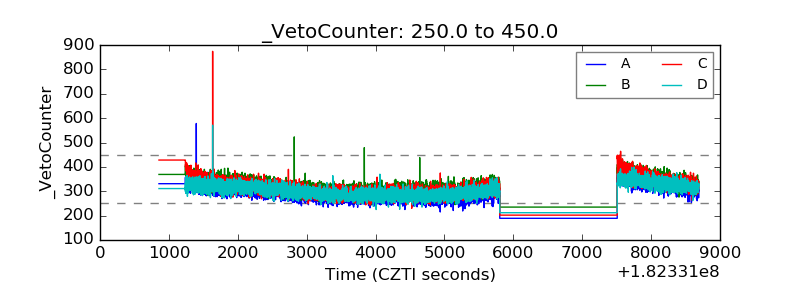 |