| Param | Original file | Final file |
|---|---|---|
| Filename | modeM0/AS1P01_118T01_9000000020_00212cztM0_level2.evt | modeM0/AS1P01_118T01_9000000020_00212cztM0_level2_quad_clean.evt |
| Size (bytes) | 942,076,800 | 66,936,960 |
| Size | 898.4 MB | 63.8 MB |
| Events in quadrant A | 8,785,453 | 399,801 |
| Events in quadrant B | 6,680,279 | 419,952 |
| Events in quadrant C | 6,208,417 | 417,038 |
| Events in quadrant D | 6,494,239 | 406,995 |
| Mode SS | |||
|---|---|---|---|
| Quadrant | BADHDUFLAG | Total packets | Discarded packets |
| A | 0 | 112 | 0 |
| B | 0 | 112 | 0 |
| C | 0 | 112 | 0 |
| D | 0 | 112 | 0 |
| Mode M0 | |||
|---|---|---|---|
| Quadrant | BADHDUFLAG | Total packets | Discarded packets |
| A | 0 | 30058 | 4 |
| B | 0 | 23749 | 3 |
| C | 0 | 22359 | 3 |
| D | 0 | 23168 | 3 |
| Mode M9 | |||
|---|---|---|---|
| Quadrant | BADHDUFLAG | Total packets | Discarded packets |
| A | 0 | 21 | 0 |
| B | 0 | 21 | 0 |
| C | 0 | 21 | 0 |
| D | 0 | 22 | 0 |
| Quadrant | Total seconds | Saturated seconds | Saturation percentage |
|---|---|---|---|
| A | 5473 | 365 | 6.669103% |
| B | 5473 | 3 | 0.054815% |
| C | 5473 | 5 | 0.091358% |
| D | 5473 | 14 | 0.255801% |
Noise dominated data is calculated using 1-second bins in cleaned event files. If a bin has >2000 counts, and if more than 50% of those come from <1% of pixels, then it is considered to be noise-dominated and hence unusable.
| Quadrant | # 1 sec bins | Bins with >0 counts | Bins with >2000 counts | High rate bins dominated by noise | Noise dominated (total time) | Noise dominated (detector-on time) | Marked lightcurve |
|---|---|---|---|---|---|---|---|
| A | 7432 | 5475 | 1160 | 1160 | 15.61% | 21.19% | 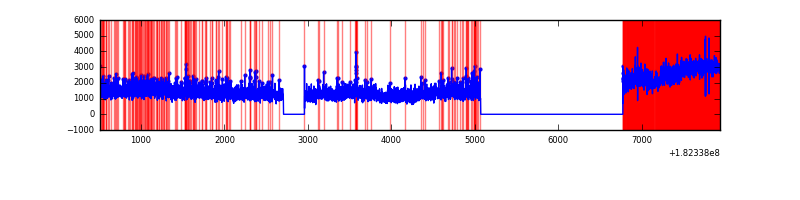 |
| B | 7432 | 5475 | 115 | 115 | 1.55% | 2.10% | 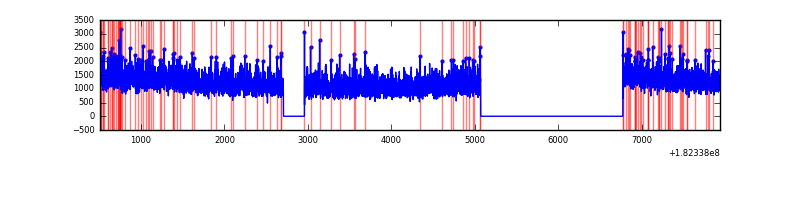 |
| C | 7432 | 5475 | 73 | 73 | 0.98% | 1.33% | 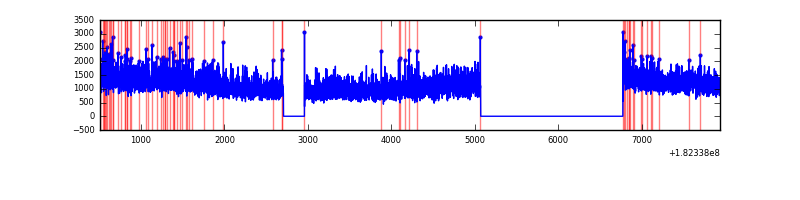 |
| D | 7432 | 5475 | 122 | 122 | 1.64% | 2.23% | 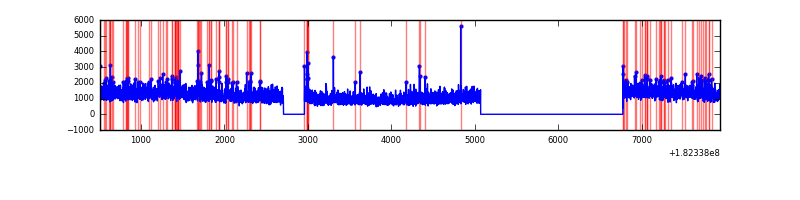 |
Top three noisy pixels from each quadrant. If the there are fewer than three noisy pixels in the level2.evt file, extra rows are filled as -1
| Pixel properties | Quadrant properties | ||||||
|---|---|---|---|---|---|---|---|
| Quadrant | DetID | PixID | Counts | Sigma | Mean | Median | Sigma |
| A | 15 | 127 | 2044486 | 5367.52 | 1725 | 1717 | 380.6 |
| A | 0 | 253 | 32096 | 79.82 | 1725 | 1717 | 380.6 |
| A | 12 | 133 | 11046 | 24.51 | 1725 | 1717 | 380.6 |
| B | 4 | 235 | 30591 | 71.68 | 1716 | 1727 | 402.7 |
| B | 5 | 46 | 25671 | 59.46 | 1716 | 1727 | 402.7 |
| B | 5 | 2 | 18796 | 42.39 | 1716 | 1727 | 402.7 |
| C | 1 | 1 | 26896 | 56.29 | 1563 | 1608 | 449.3 |
| C | 0 | 186 | 21486 | 44.24 | 1563 | 1608 | 449.3 |
| C | 1 | 192 | 9562 | 17.7 | 1563 | 1608 | 449.3 |
| D | 1 | 4 | 173667 | 358.46 | 1569 | 1621 | 480.0 |
| D | 13 | 117 | 81324 | 166.06 | 1569 | 1621 | 480.0 |
| D | 1 | 5 | 32995 | 65.37 | 1569 | 1621 | 480.0 |
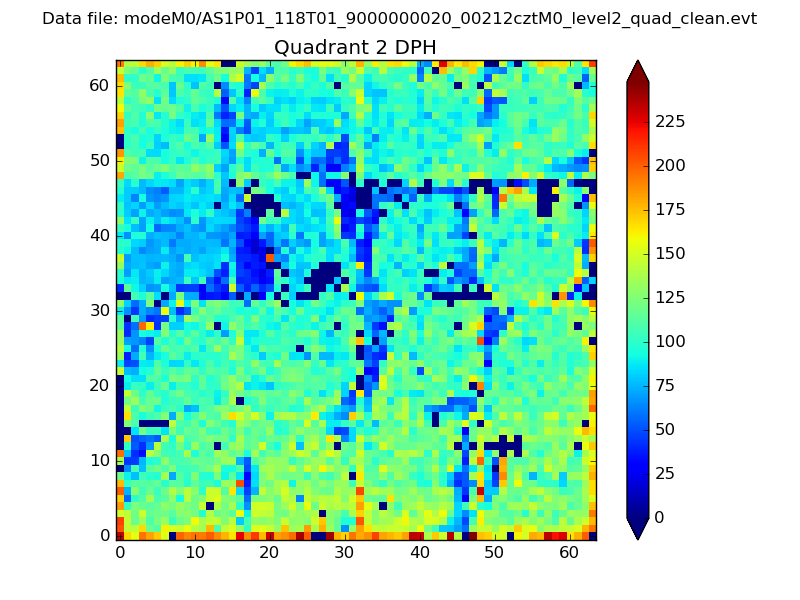
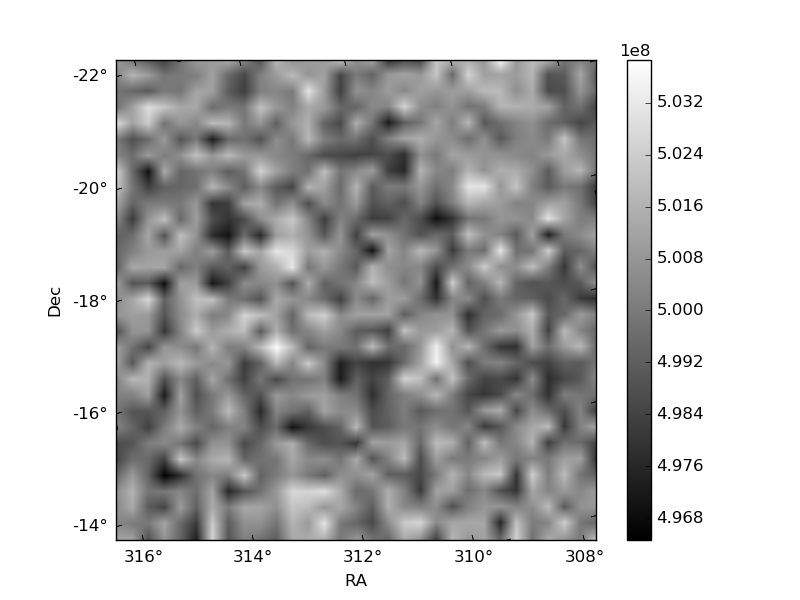
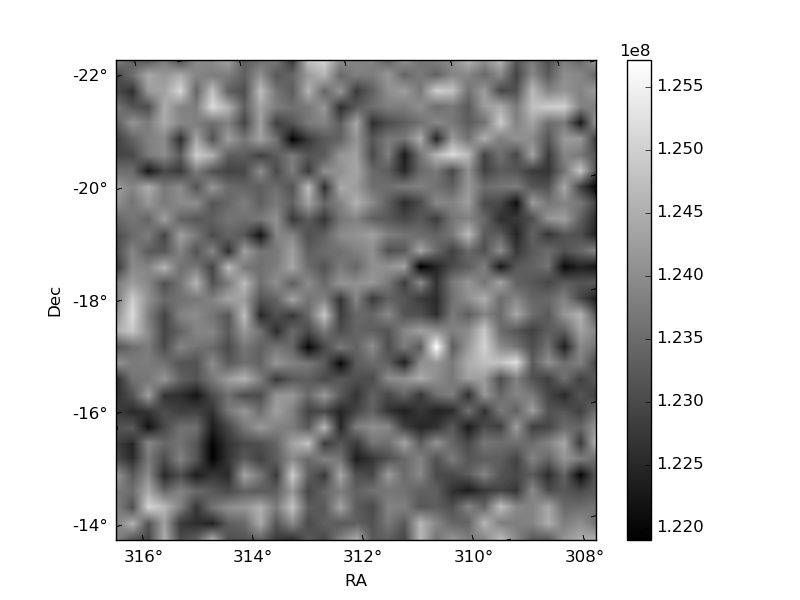
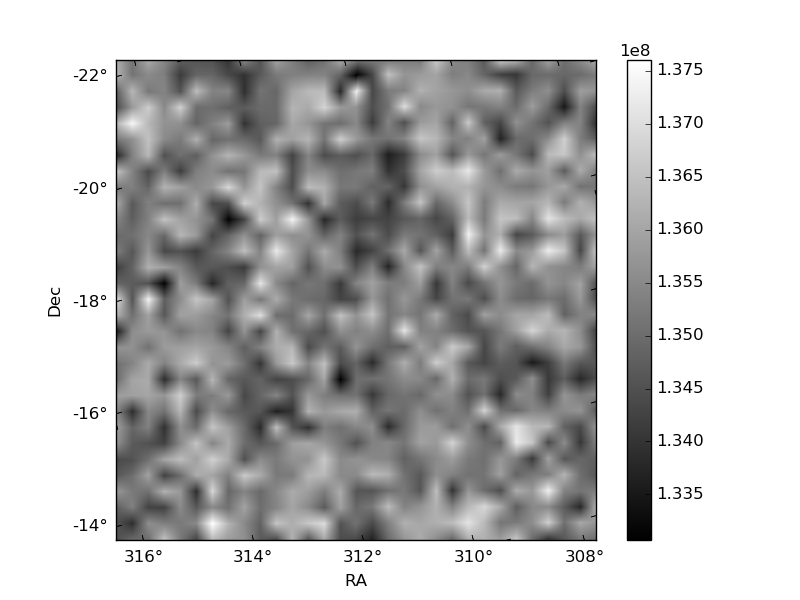
Histogram calculated using DETX and DETY for each event in the final _common_clean file
| Quadrant A | 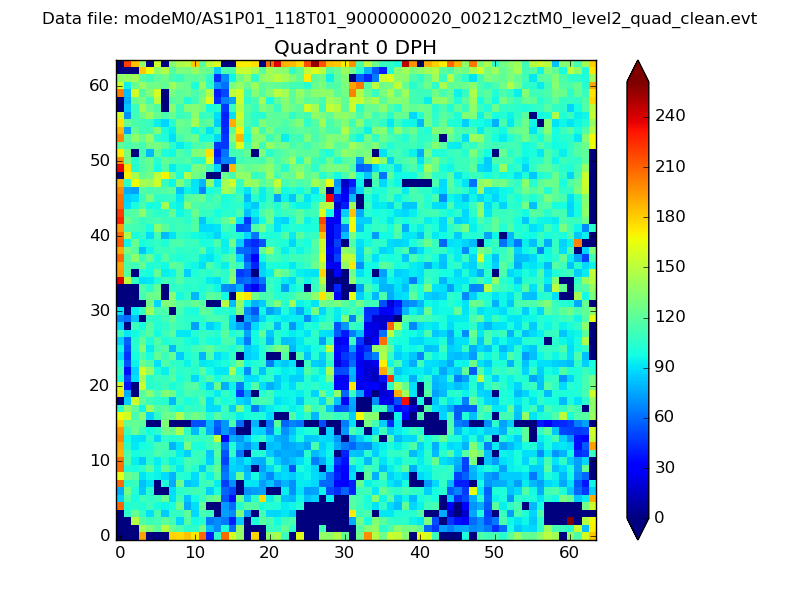 |
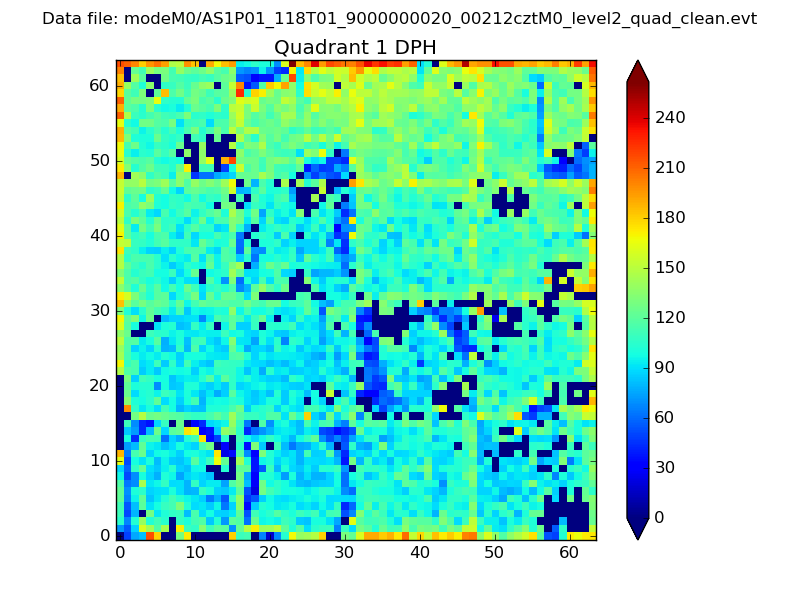 |
Quadrant B |
|---|---|---|---|
| Quadrant D | 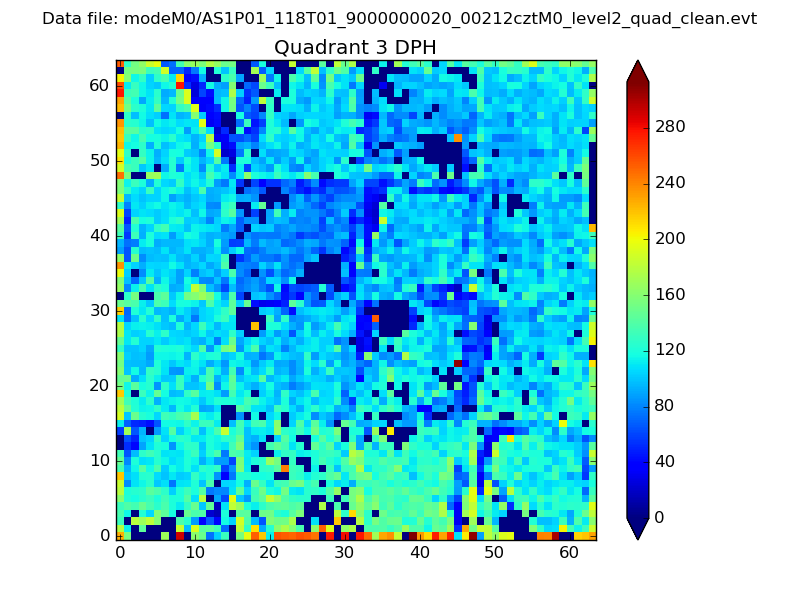 |
 |
Quadrant C |
| Plot type | Count rate plots | Images |
|---|---|---|
| Comparison with Poisson distribution Blue bars denote a histogram of data divided into 1 sec bins. Red curve is a Poisson curve with rate = median count rate of data. |
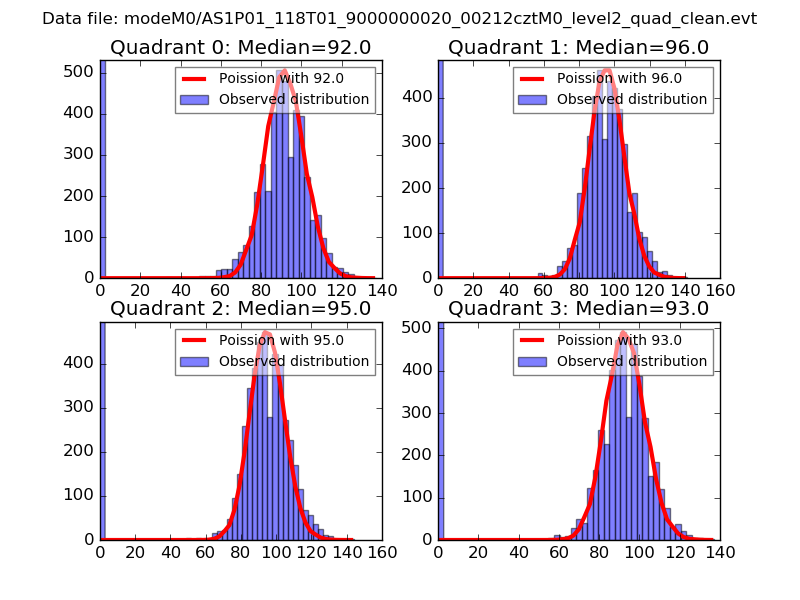 |
 |
| Quadrant-wise count rates Data is divided into 100 sec bins |
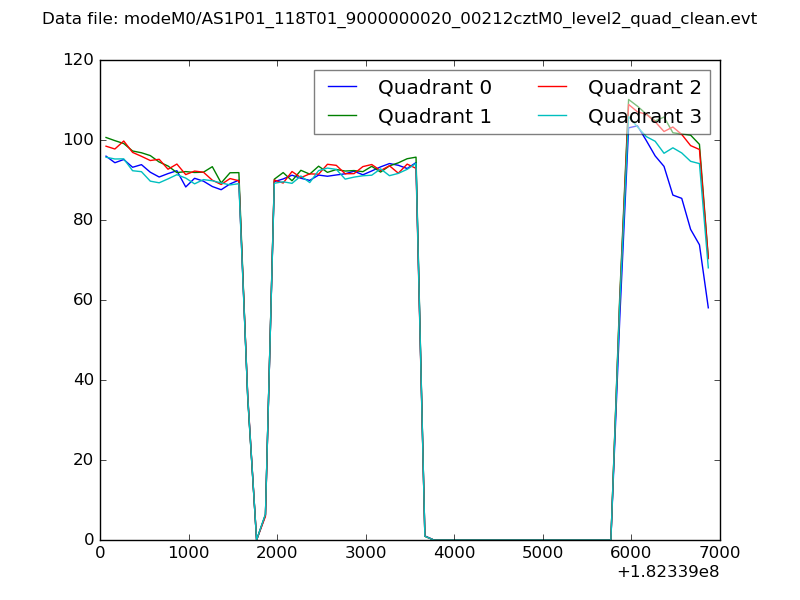 |
|
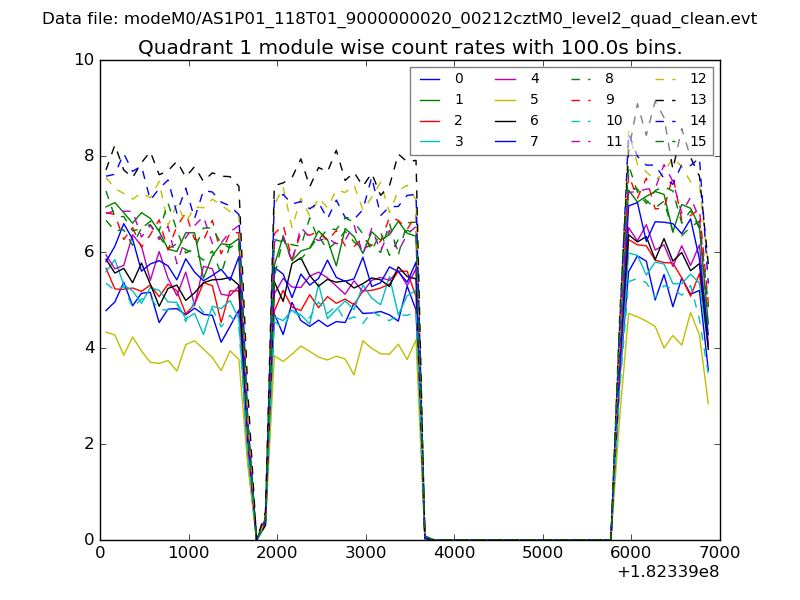
| Module-wise count rates for Quadrant A Data is divided into 100 sec bins |
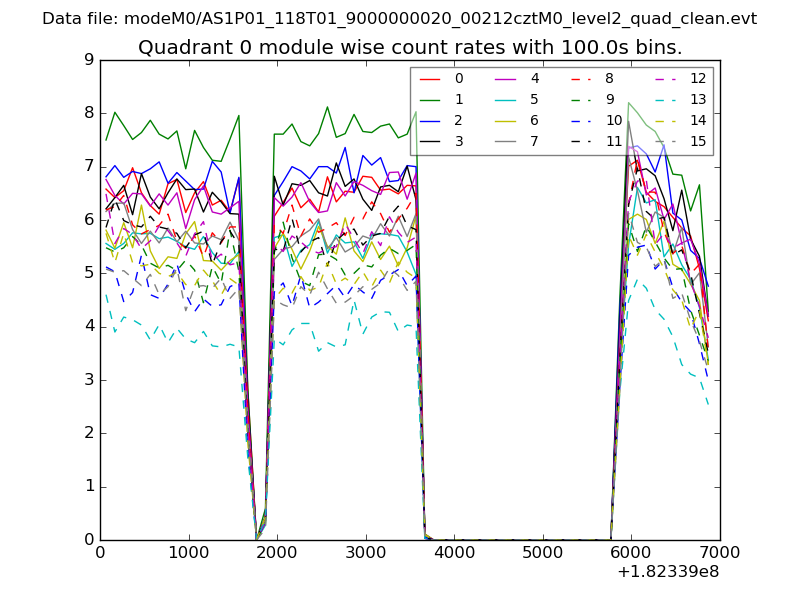 |
 |
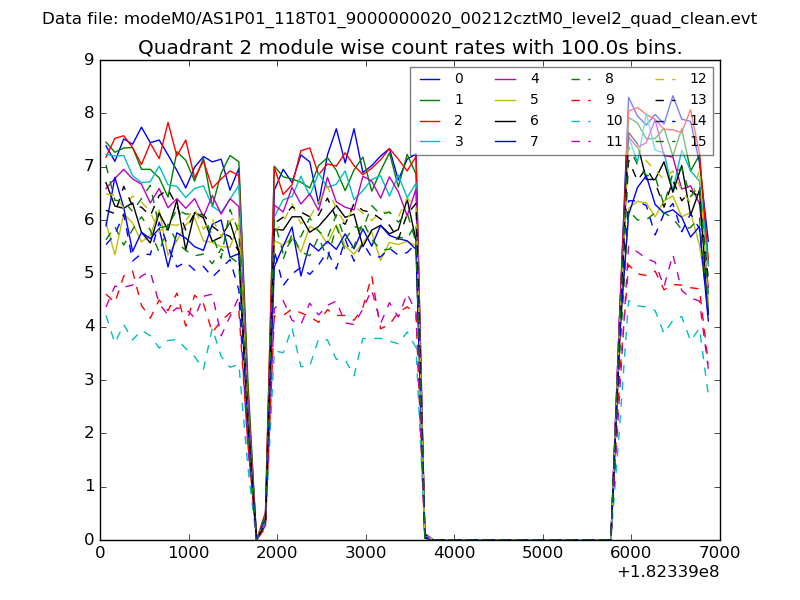
| Module-wise count rates for Quadrant B Data is divided into 100 sec bins |
 |
 |
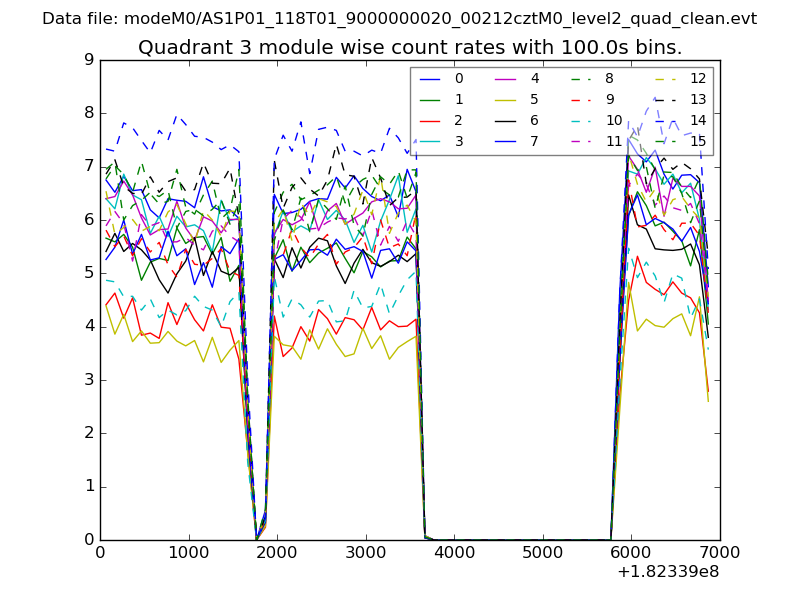
| Module-wise count rates for Quadrant C Data is divided into 100 sec bins |
 |
 |
| Module-wise count rates for Quadrant D Data is divided into 100 sec bins |
 |
 |
| Parameter | Plot |
|---|---|
| CZT HV Monitor | 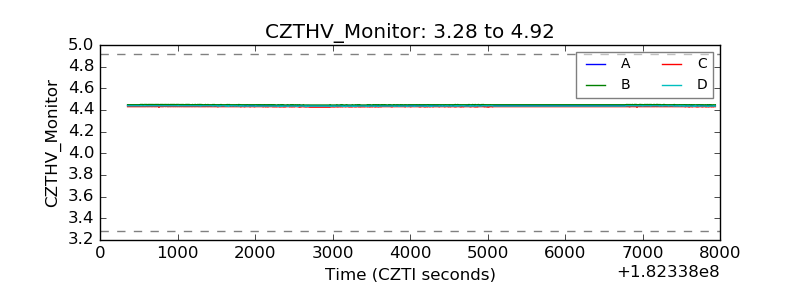 |
| D_VDD | 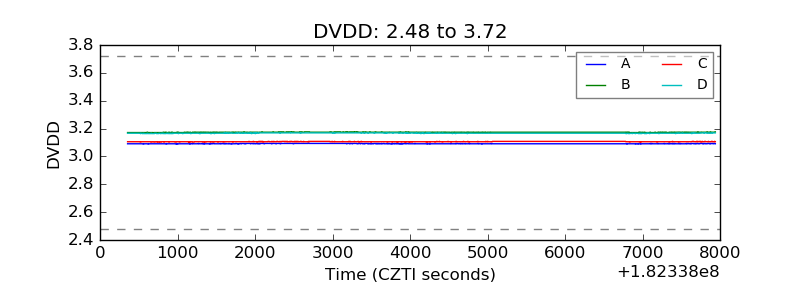 |
| Temperature 1 | 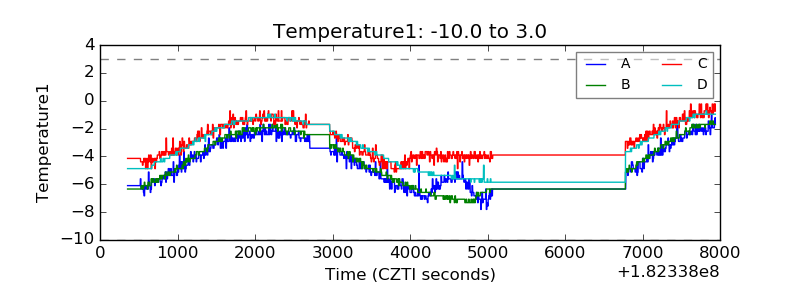 |
| Veto HV Monitor | 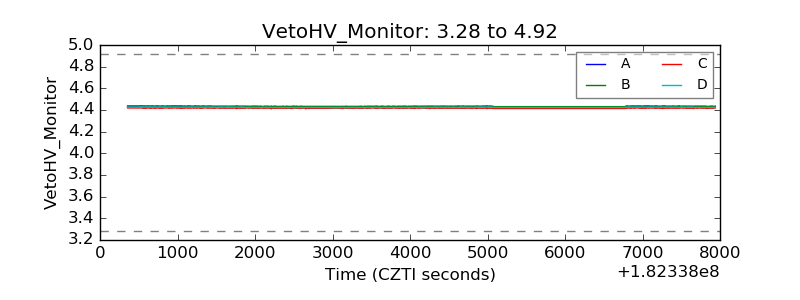 |
| Veto LLD | 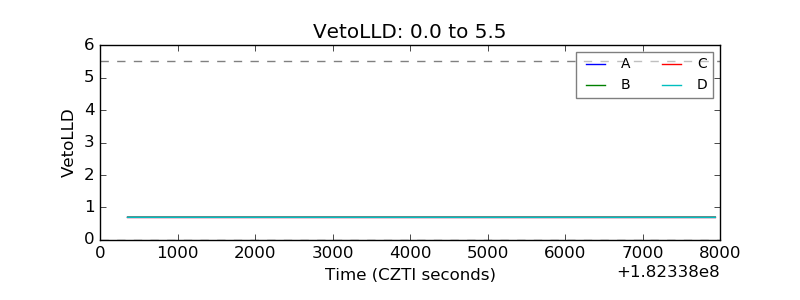 |
| Alpha Counter | 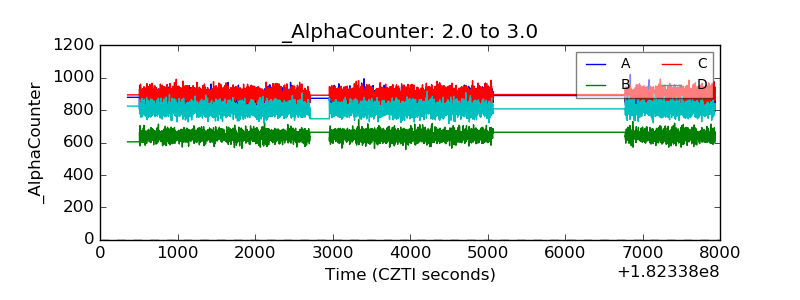 |
| _CPM_Rate | 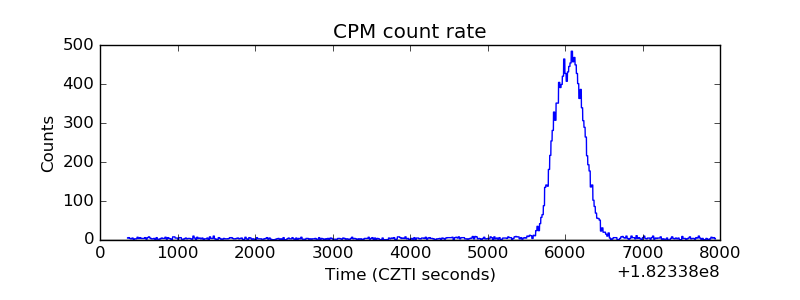 |
| CZT Counter | 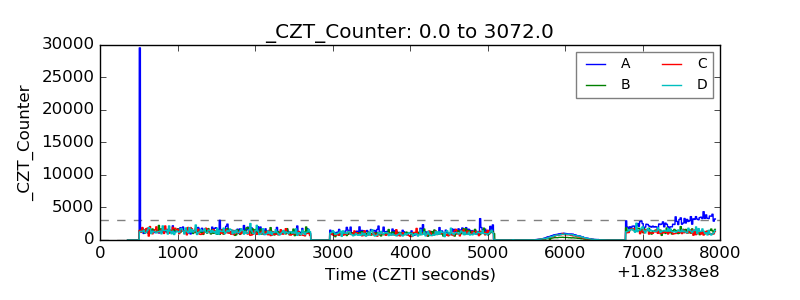 |
| +2.5 Volts monitor |  |
| +5 Volts monitor |  |
| _ROLL_ROT | 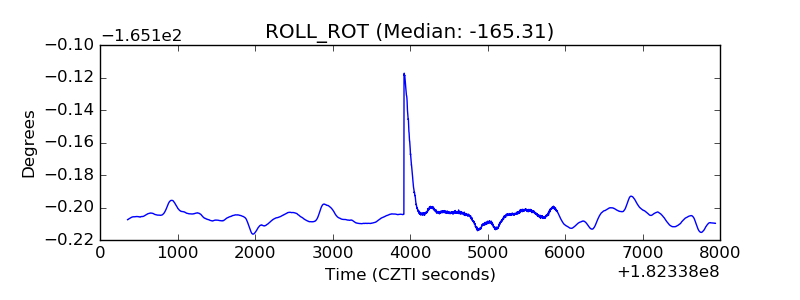 |
| _Roll_DEC | 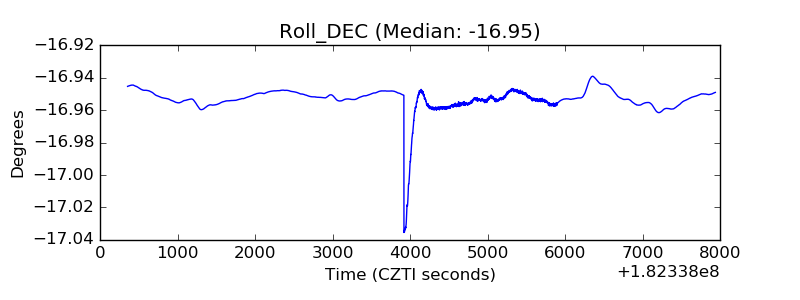 |
| _Roll_RA | 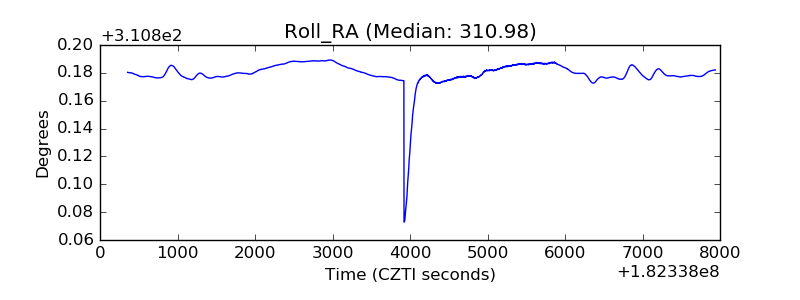 |
| Veto Counter | 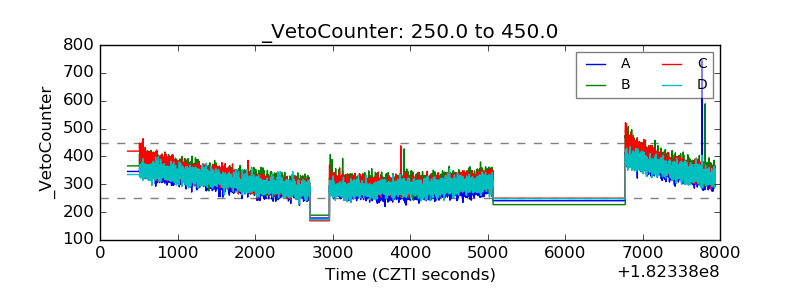 |