| Param | Original file | Final file |
|---|---|---|
| Filename | modeM0/AS1P01_118T01_9000000020_00213cztM0_level2.evt | modeM0/AS1P01_118T01_9000000020_00213cztM0_level2_quad_clean.evt |
| Size (bytes) | 1,064,882,880 | 71,786,880 |
| Size | 1015.6 MB | 68.5 MB |
| Events in quadrant A | 12,318,407 | 428,421 |
| Events in quadrant B | 7,186,124 | 457,326 |
| Events in quadrant C | 6,138,362 | 461,295 |
| Events in quadrant D | 6,238,011 | 435,010 |
| Mode SS | |||
|---|---|---|---|
| Quadrant | BADHDUFLAG | Total packets | Discarded packets |
| A | 0 | 114 | 0 |
| B | 0 | 114 | 0 |
| C | 0 | 114 | 0 |
| D | 0 | 114 | 0 |
| Mode M0 | |||
|---|---|---|---|
| Quadrant | BADHDUFLAG | Total packets | Discarded packets |
| A | 0 | 40610 | 3 |
| B | 0 | 25372 | 2 |
| C | 0 | 22261 | 2 |
| D | 0 | 22608 | 2 |
| Mode M9 | |||
|---|---|---|---|
| Quadrant | BADHDUFLAG | Total packets | Discarded packets |
| A | 0 | 17 | 0 |
| B | 0 | 17 | 0 |
| C | 0 | 17 | 0 |
| D | 0 | 18 | 0 |
| Quadrant | Total seconds | Saturated seconds | Saturation percentage |
|---|---|---|---|
| A | 5641 | 625 | 11.079596% |
| B | 5593 | 34 | 0.607903% |
| C | 5641 | 2 | 0.035455% |
| D | 5518 | 10 | 0.181225% |
Noise dominated data is calculated using 1-second bins in cleaned event files. If a bin has >2000 counts, and if more than 50% of those come from <1% of pixels, then it is considered to be noise-dominated and hence unusable.
| Quadrant | # 1 sec bins | Bins with >0 counts | Bins with >2000 counts | High rate bins dominated by noise | Noise dominated (total time) | Noise dominated (detector-on time) | Marked lightcurve |
|---|---|---|---|---|---|---|---|
| A | 7346 | 5642 | 3282 | 3282 | 44.68% | 58.17% | 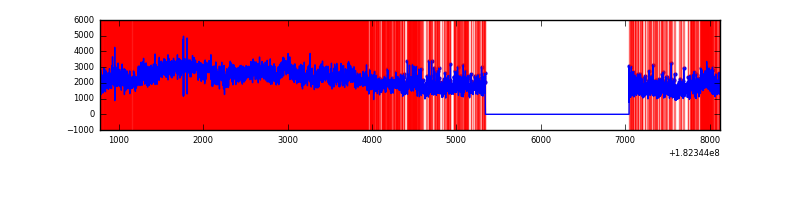 |
| B | 7346 | 5595 | 224 | 224 | 3.05% | 4.00% | 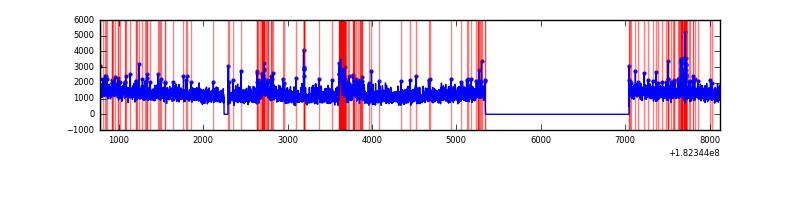 |
| C | 7346 | 5642 | 52 | 52 | 0.71% | 0.92% | 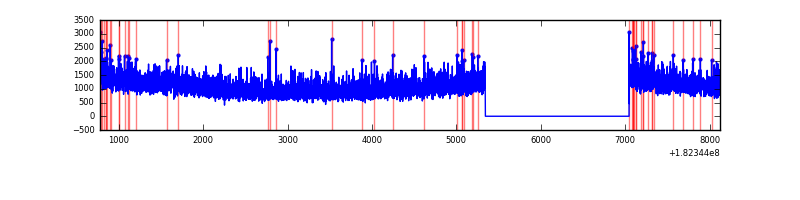 |
| D | 7346 | 5521 | 90 | 90 | 1.23% | 1.63% | 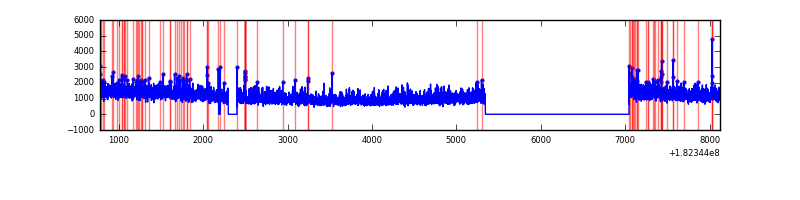 |
Top three noisy pixels from each quadrant. If the there are fewer than three noisy pixels in the level2.evt file, extra rows are filled as -1
| Pixel properties | Quadrant properties | ||||||
|---|---|---|---|---|---|---|---|
| Quadrant | DetID | PixID | Counts | Sigma | Mean | Median | Sigma |
| A | 15 | 127 | 5573600 | 14503.19 | 1736 | 1727 | 384.2 |
| A | 13 | 17 | 10446 | 22.69 | 1736 | 1727 | 384.2 |
| A | 11 | 242 | 9414 | 20.01 | 1736 | 1727 | 384.2 |
| B | 14 | 50 | 453076 | 1118.79 | 1716 | 1731 | 403.4 |
| B | 5 | 46 | 61553 | 148.29 | 1716 | 1731 | 403.4 |
| B | 0 | 183 | 33024 | 77.57 | 1716 | 1731 | 403.4 |
| C | 1 | 192 | 9815 | 18.74 | 1558 | 1610 | 437.9 |
| C | 1 | 1 | 5943 | 9.89 | 1558 | 1610 | 437.9 |
| C | 7 | 111 | 4063 | 5.6 | 1558 | 1610 | 437.9 |
| D | 1 | 4 | 219631 | 469.3 | 1516 | 1560 | 464.7 |
| D | 1 | 5 | 60837 | 127.57 | 1516 | 1560 | 464.7 |
| D | 13 | 117 | 47495 | 98.85 | 1516 | 1560 | 464.7 |
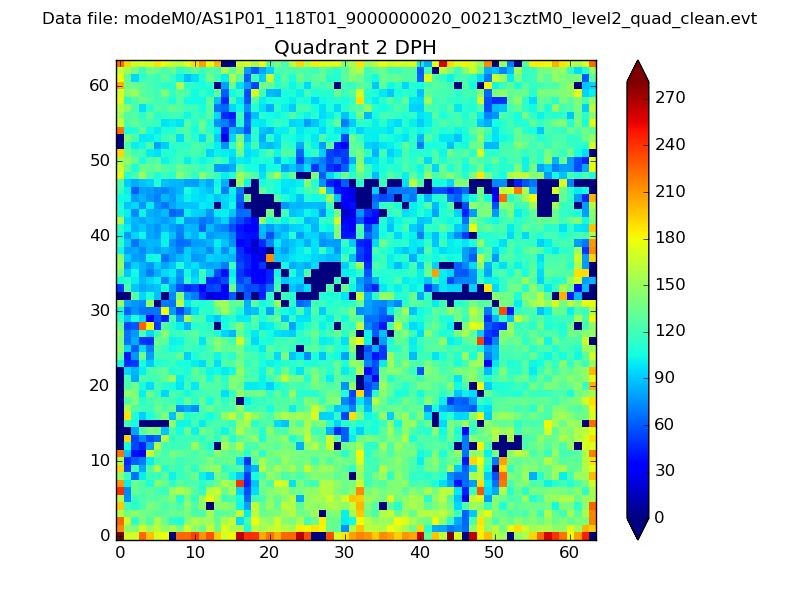
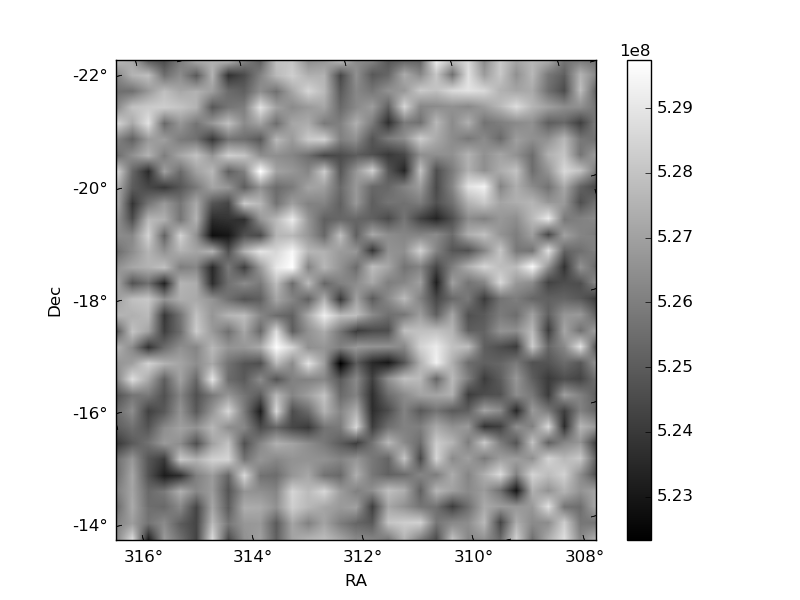
Histogram calculated using DETX and DETY for each event in the final _common_clean file
| Quadrant A | 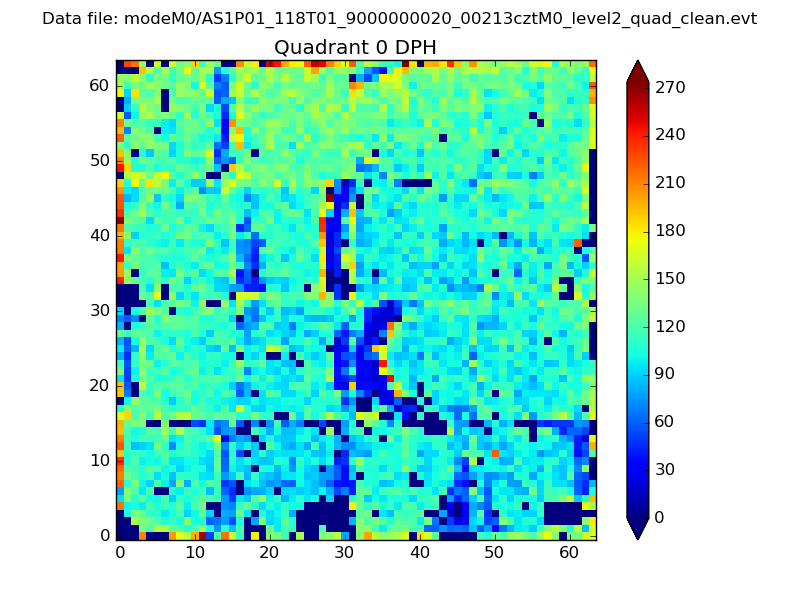 |
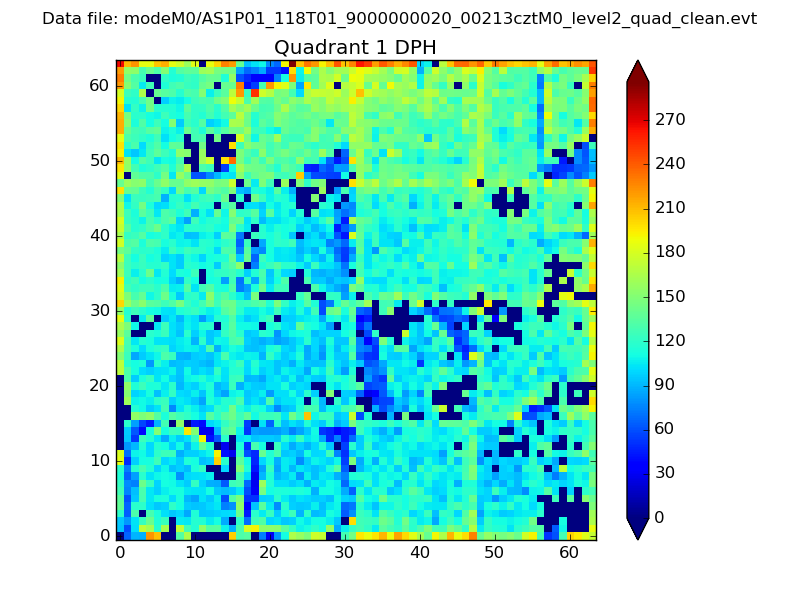 |
Quadrant B |
|---|---|---|---|
| Quadrant D | 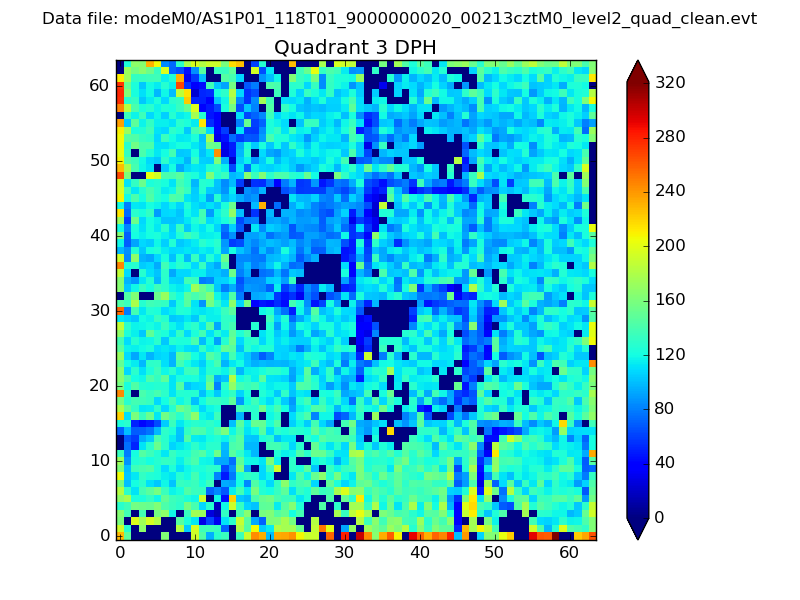 |
 |
Quadrant C |
| Plot type | Count rate plots | Images |
|---|---|---|
| Comparison with Poisson distribution Blue bars denote a histogram of data divided into 1 sec bins. Red curve is a Poisson curve with rate = median count rate of data. |
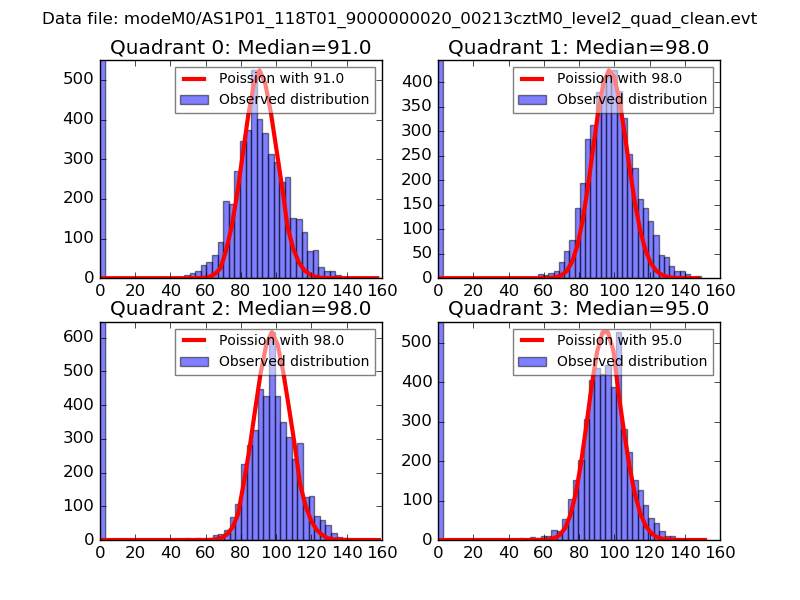 |
 |
| Quadrant-wise count rates Data is divided into 100 sec bins |
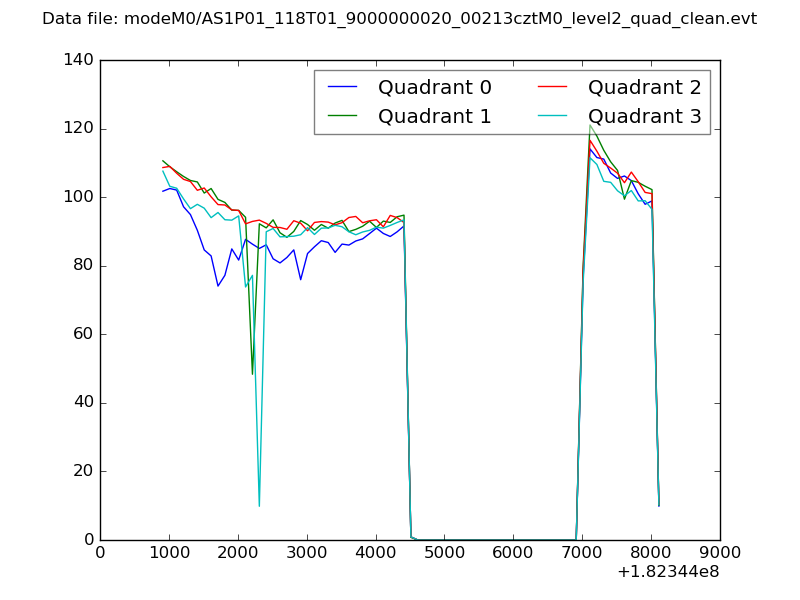 |
|
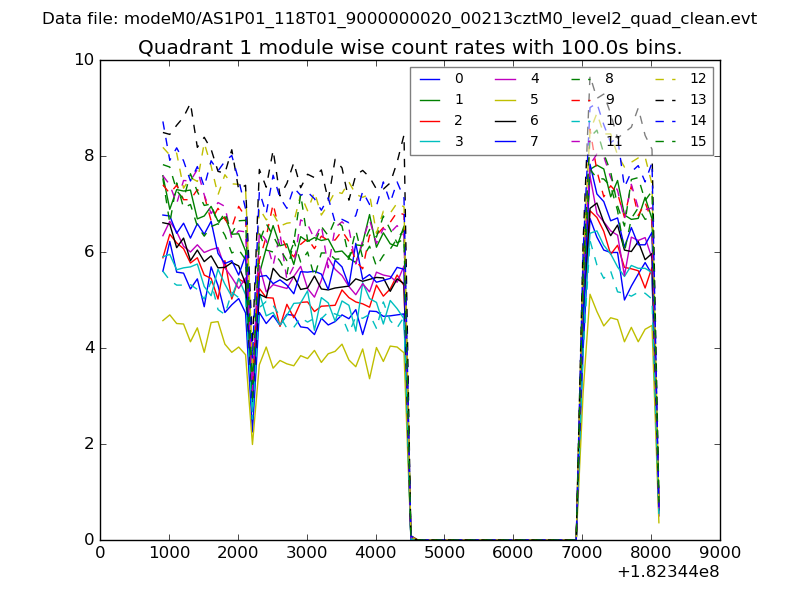
| Module-wise count rates for Quadrant A Data is divided into 100 sec bins |
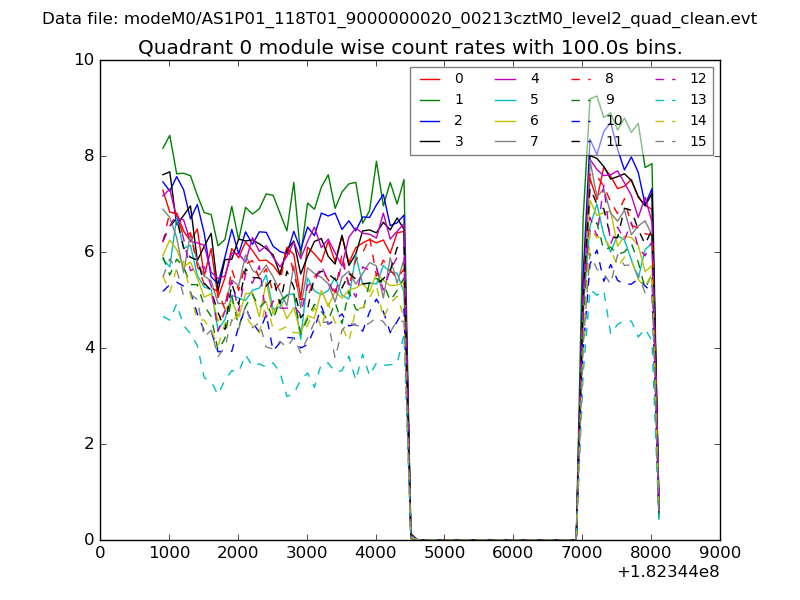 |
 |
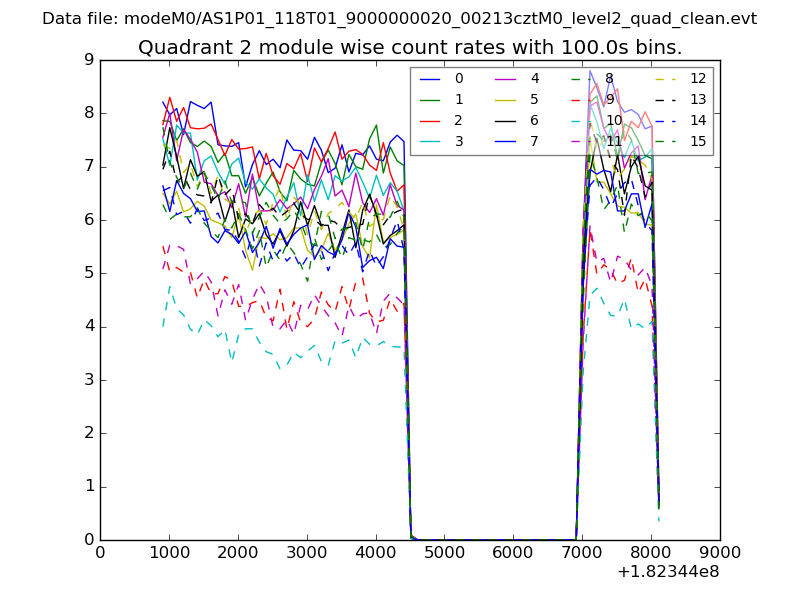
| Module-wise count rates for Quadrant B Data is divided into 100 sec bins |
 |
 |
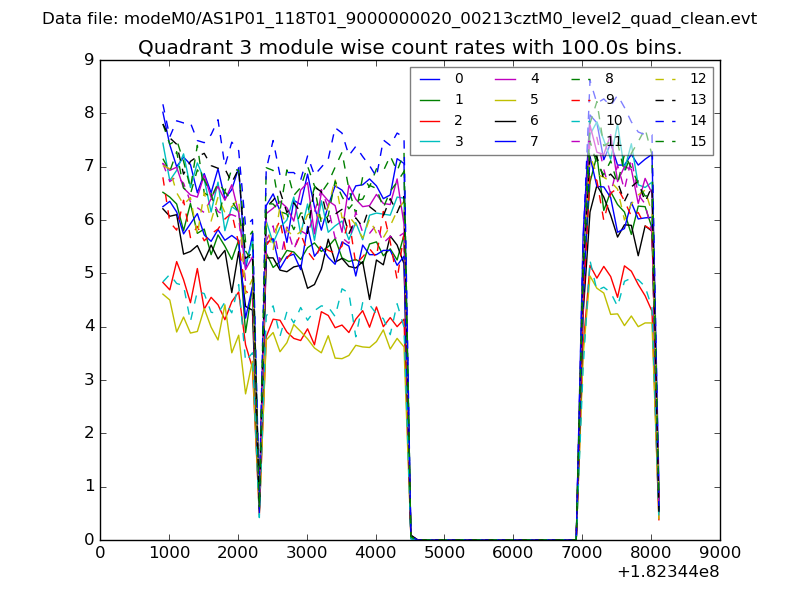
| Module-wise count rates for Quadrant C Data is divided into 100 sec bins |
 |
 |
| Module-wise count rates for Quadrant D Data is divided into 100 sec bins |
 |
 |
| Parameter | Plot |
|---|---|
| CZT HV Monitor | 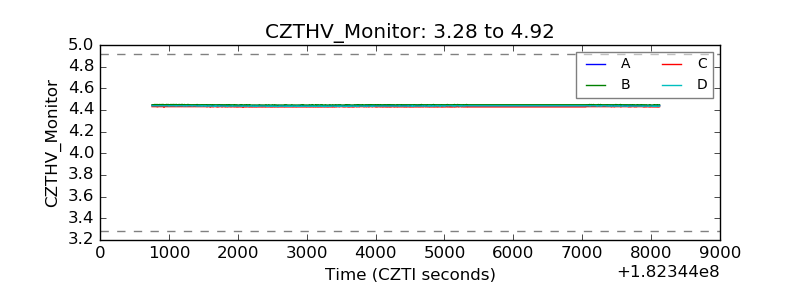 |
| D_VDD | 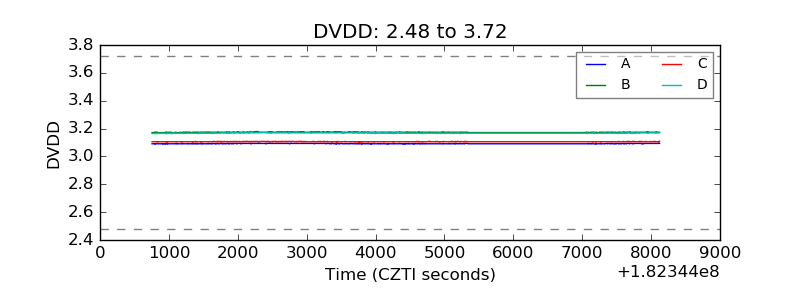 |
| Temperature 1 | 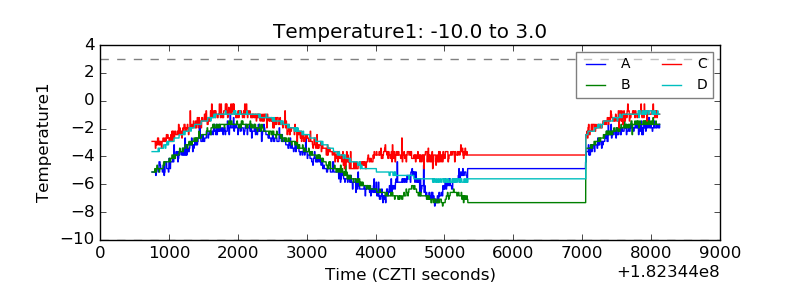 |
| Veto HV Monitor | 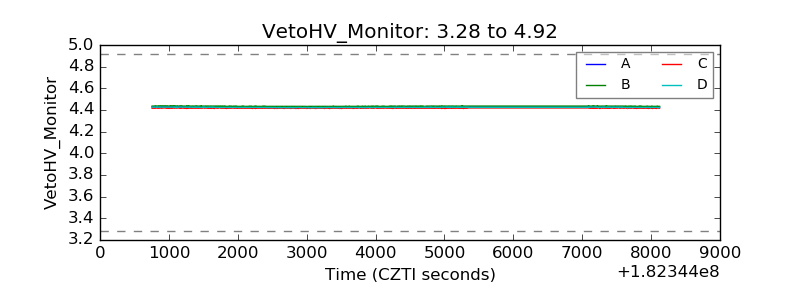 |
| Veto LLD | 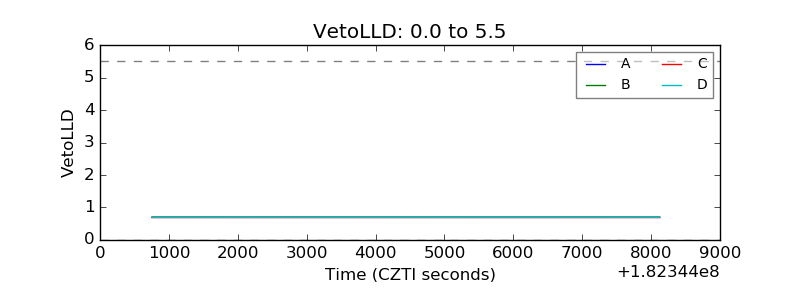 |
| Alpha Counter | 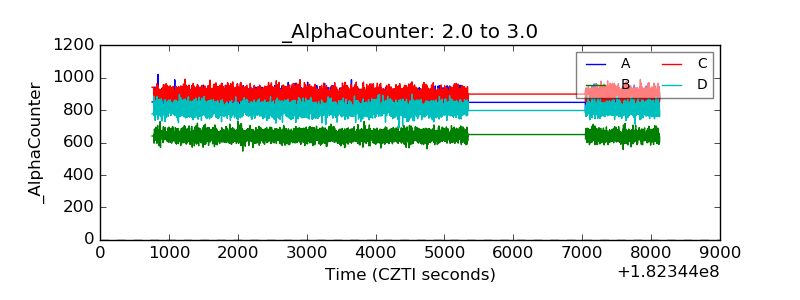 |
| _CPM_Rate | 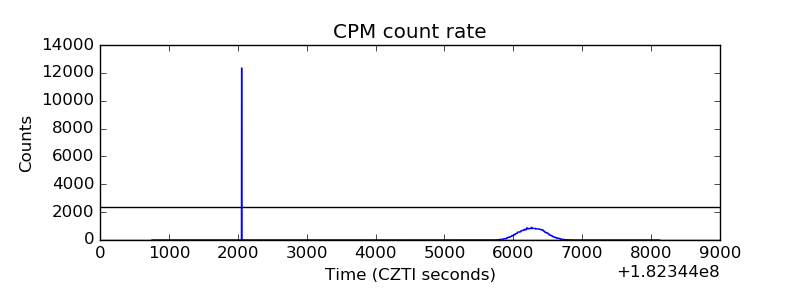 |
| CZT Counter | 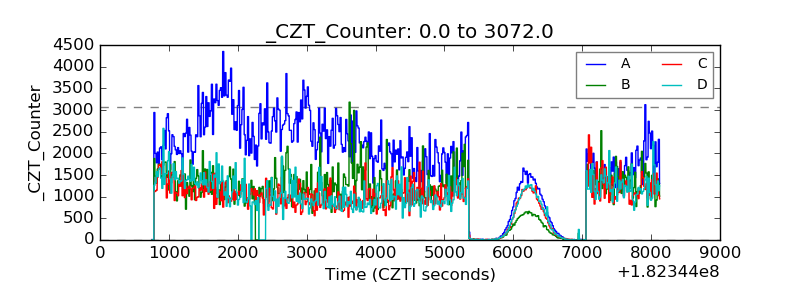 |
| +2.5 Volts monitor | 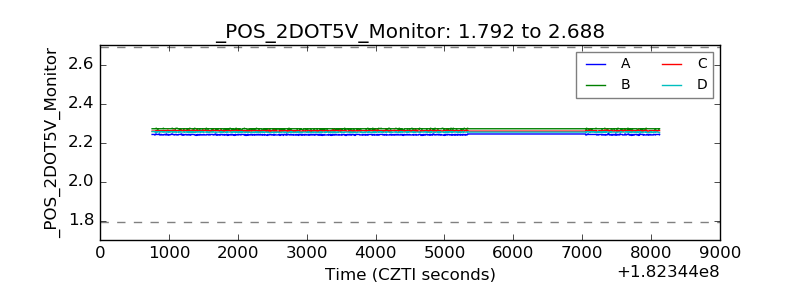 |
| +5 Volts monitor |  |
| _ROLL_ROT | 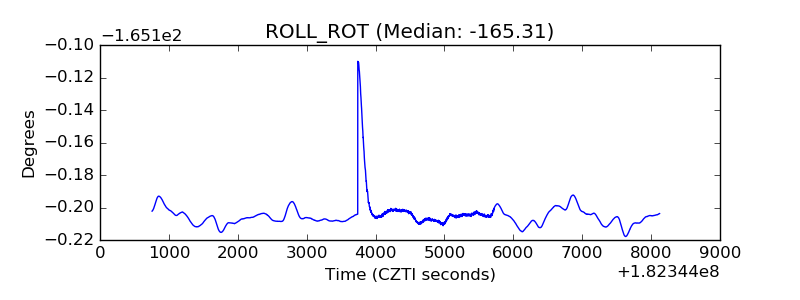 |
| _Roll_DEC | 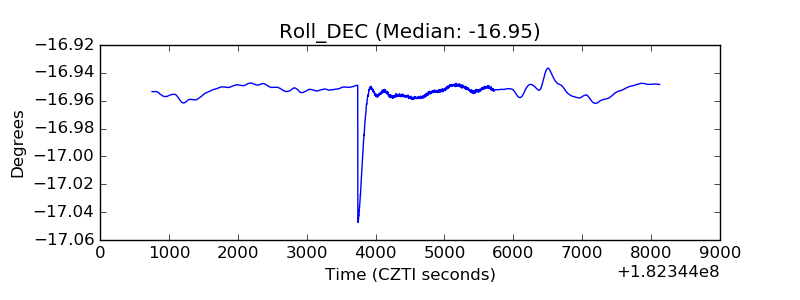 |
| _Roll_RA | 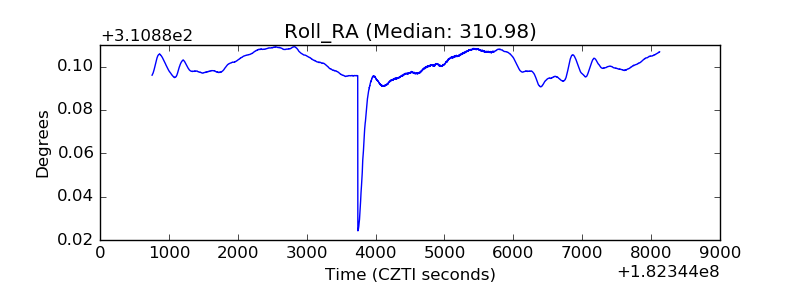 |
| Veto Counter | 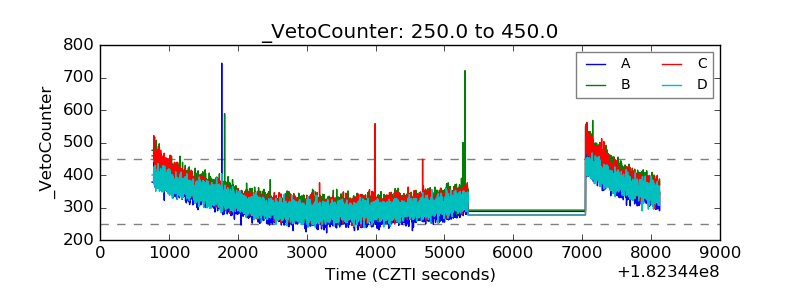 |