| Param | Original file | Final file |
|---|---|---|
| Filename | modeM0/AS1P01_118T01_9000000020_00215cztM0_level2.evt | modeM0/AS1P01_118T01_9000000020_00215cztM0_level2_quad_clean.evt |
| Size (bytes) | 813,317,760 | 69,649,920 |
| Size | 775.6 MB | 66.4 MB |
| Events in quadrant A | 7,193,328 | 437,534 |
| Events in quadrant B | 6,032,055 | 450,655 |
| Events in quadrant C | 5,487,330 | 435,578 |
| Events in quadrant D | 5,580,092 | 428,253 |
| Mode SS | |||
|---|---|---|---|
| Quadrant | BADHDUFLAG | Total packets | Discarded packets |
| A | 0 | 104 | 0 |
| B | 0 | 104 | 0 |
| C | 0 | 104 | 0 |
| D | 0 | 104 | 0 |
| Mode M0 | |||
|---|---|---|---|
| Quadrant | BADHDUFLAG | Total packets | Discarded packets |
| A | 0 | 24924 | 0 |
| B | 0 | 21543 | 0 |
| C | 0 | 19940 | 0 |
| D | 0 | 20200 | 0 |
| Mode M9 | |||
|---|---|---|---|
| Quadrant | BADHDUFLAG | Total packets | Discarded packets |
| A | 0 | 17 | 0 |
| B | 0 | 17 | 0 |
| C | 0 | 17 | 0 |
| D | 0 | 17 | 0 |
| Quadrant | Total seconds | Saturated seconds | Saturation percentage |
|---|---|---|---|
| A | 5092 | 17 | 0.333857% |
| B | 5092 | 21 | 0.412412% |
| C | 5092 | 50 | 0.981932% |
| D | 5092 | 29 | 0.569521% |
Noise dominated data is calculated using 1-second bins in cleaned event files. If a bin has >2000 counts, and if more than 50% of those come from <1% of pixels, then it is considered to be noise-dominated and hence unusable.
| Quadrant | # 1 sec bins | Bins with >0 counts | Bins with >2000 counts | High rate bins dominated by noise | Noise dominated (total time) | Noise dominated (detector-on time) | Marked lightcurve |
|---|---|---|---|---|---|---|---|
| A | 6797 | 5093 | 487 | 487 | 7.16% | 9.56% | 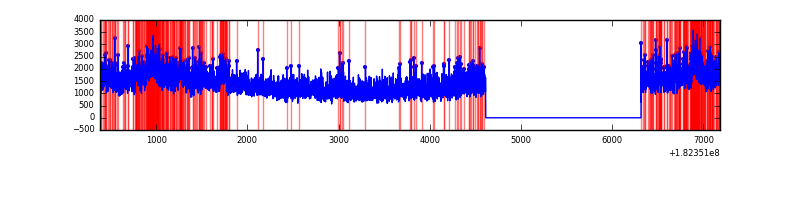 |
| B | 6797 | 5093 | 112 | 112 | 1.65% | 2.20% | 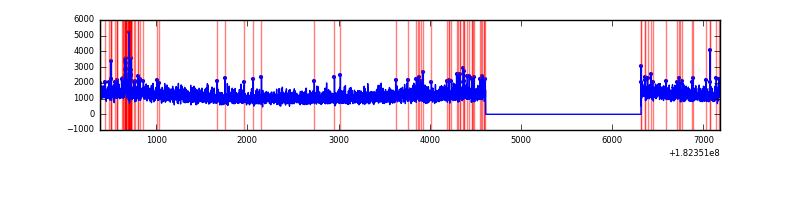 |
| C | 6796 | 5092 | 80 | 80 | 1.18% | 1.57% | 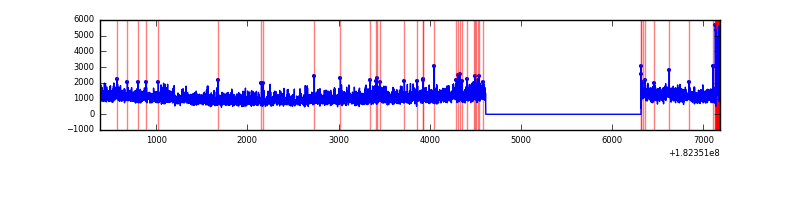 |
| D | 6797 | 5093 | 79 | 79 | 1.16% | 1.55% | 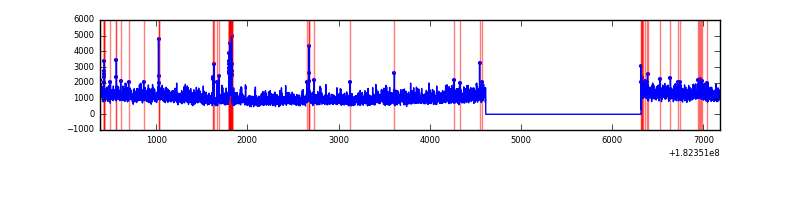 |
Top three noisy pixels from each quadrant. If the there are fewer than three noisy pixels in the level2.evt file, extra rows are filled as -1
| Pixel properties | Quadrant properties | ||||||
|---|---|---|---|---|---|---|---|
| Quadrant | DetID | PixID | Counts | Sigma | Mean | Median | Sigma |
| A | 15 | 127 | 1189717 | 3516.61 | 1541 | 1532 | 337.9 |
| A | 11 | 242 | 13179 | 34.47 | 1541 | 1532 | 337.9 |
| A | 0 | 253 | 11323 | 28.98 | 1541 | 1532 | 337.9 |
| B | 14 | 50 | 75859 | 206.63 | 1523 | 1536 | 359.7 |
| B | 5 | 46 | 71290 | 193.93 | 1523 | 1536 | 359.7 |
| B | 0 | 183 | 20822 | 53.62 | 1523 | 1536 | 359.7 |
| C | 0 | 186 | 140767 | 365.3 | 1357 | 1403 | 381.5 |
| C | 0 | 206 | 7917 | 17.07 | 1357 | 1403 | 381.5 |
| C | 1 | 192 | 7256 | 15.34 | 1357 | 1403 | 381.5 |
| D | 1 | 4 | 203581 | 484.34 | 1330 | 1379 | 417.5 |
| D | 2 | 33 | 72367 | 170.04 | 1330 | 1379 | 417.5 |
| D | 13 | 117 | 50333 | 117.26 | 1330 | 1379 | 417.5 |
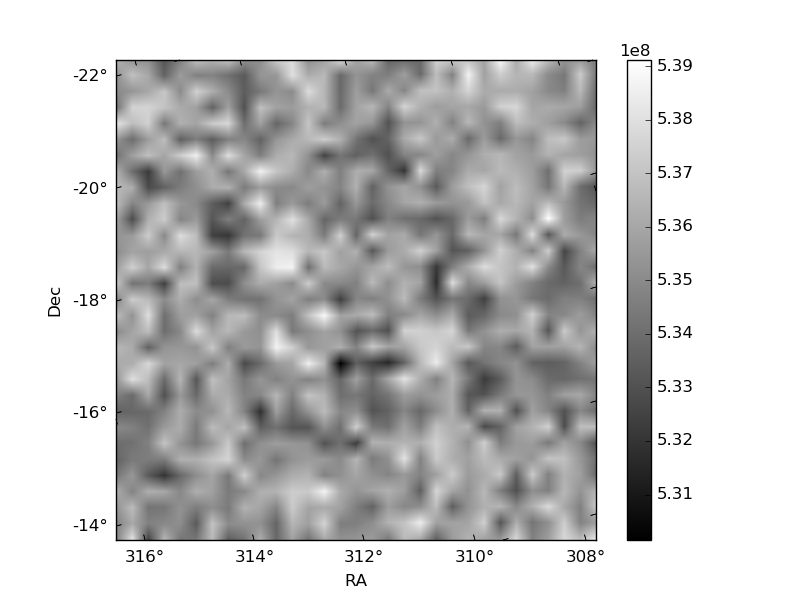
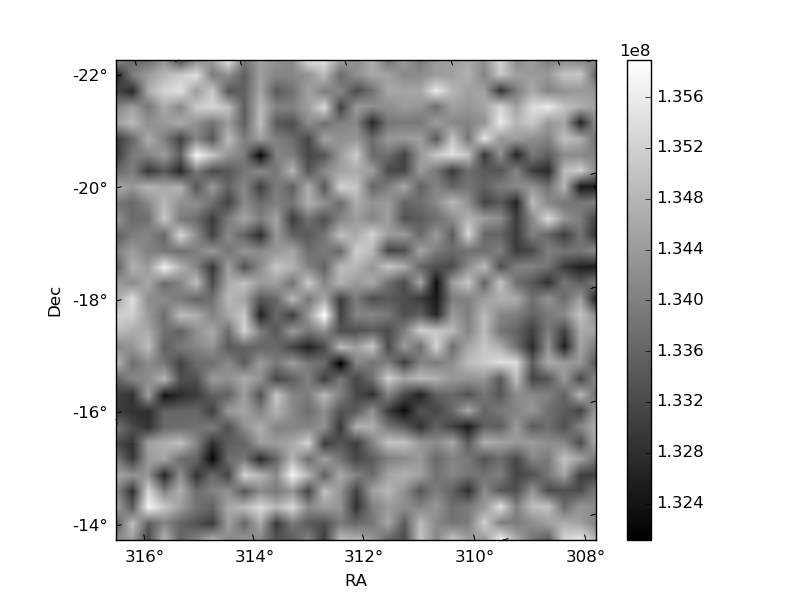
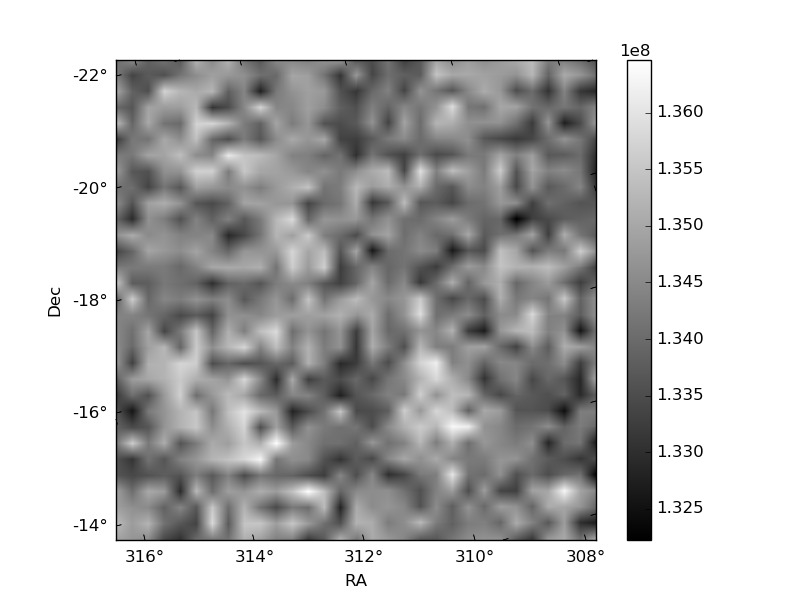
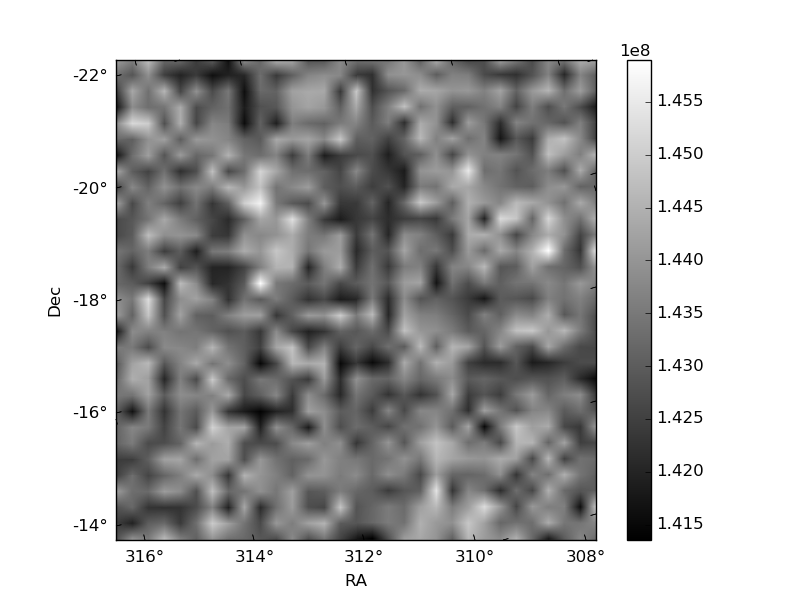
Histogram calculated using DETX and DETY for each event in the final _common_clean file
| Quadrant A | 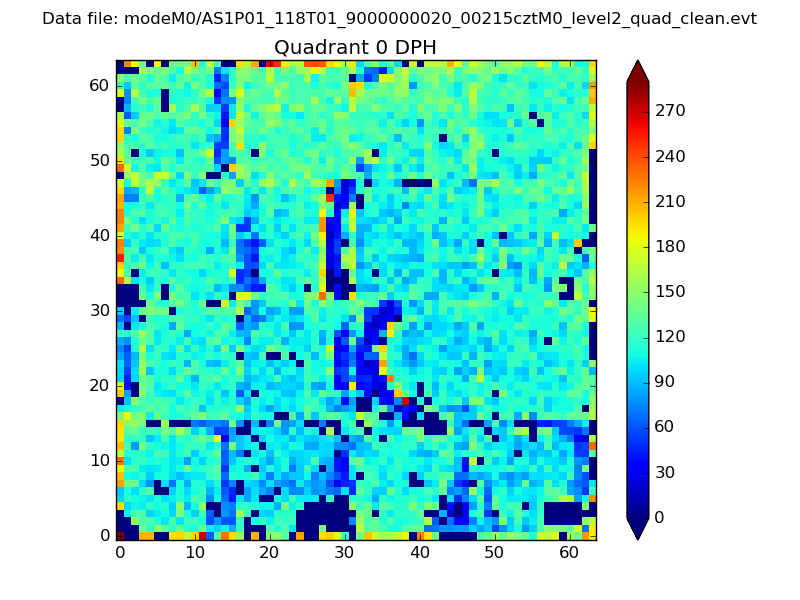 |
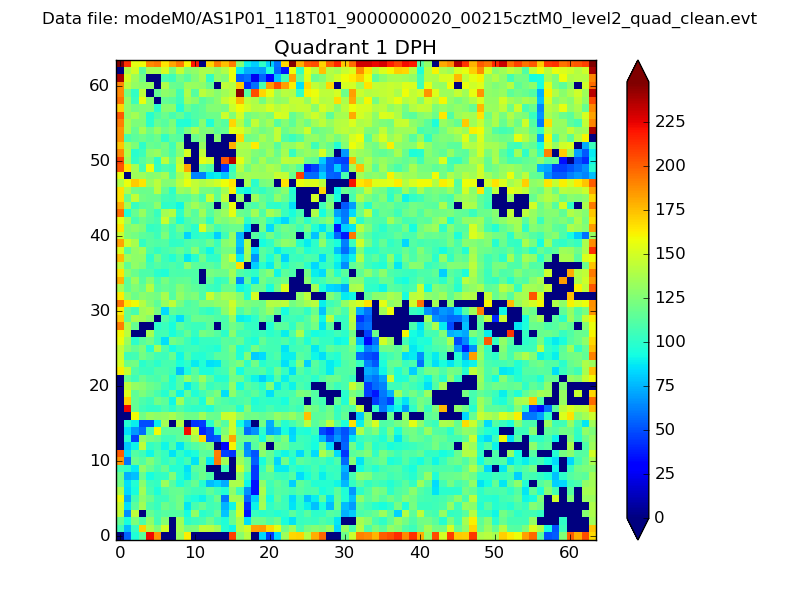 |
Quadrant B |
|---|---|---|---|
| Quadrant D | 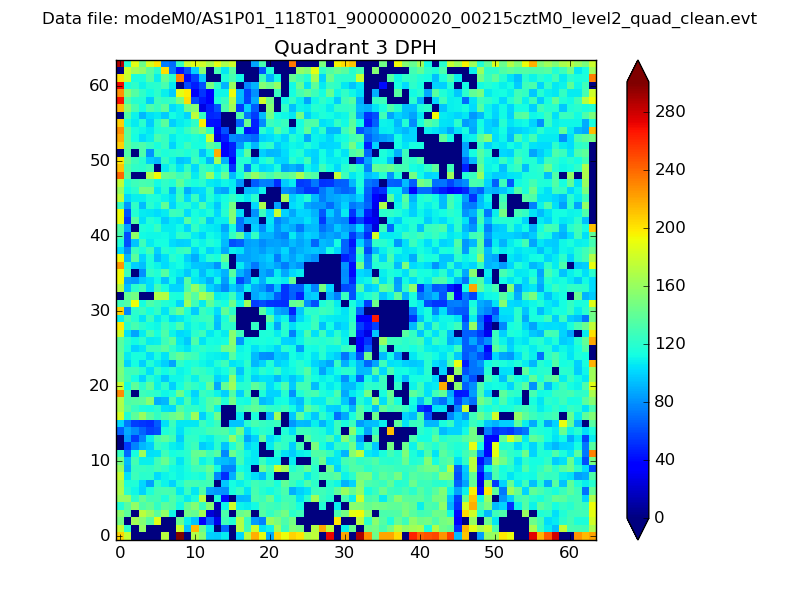 |
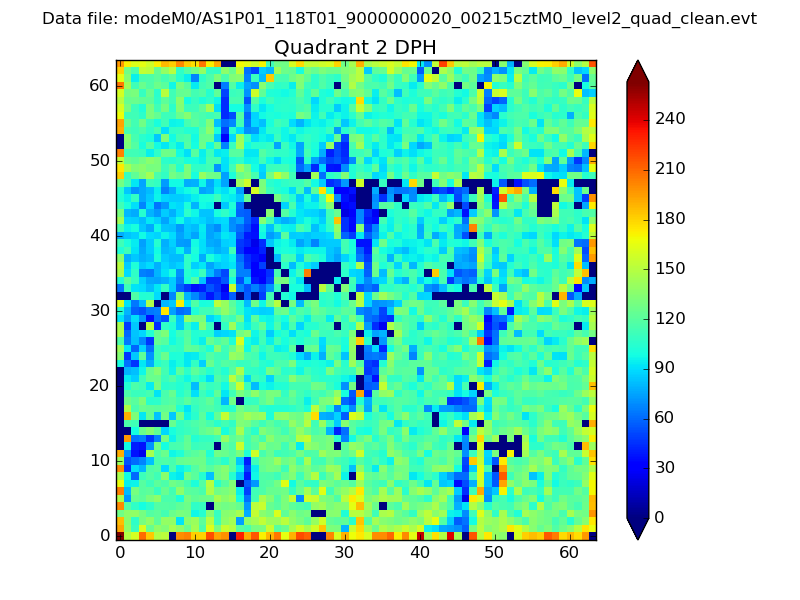 |
Quadrant C |
| Plot type | Count rate plots | Images |
|---|---|---|
| Comparison with Poisson distribution Blue bars denote a histogram of data divided into 1 sec bins. Red curve is a Poisson curve with rate = median count rate of data. |
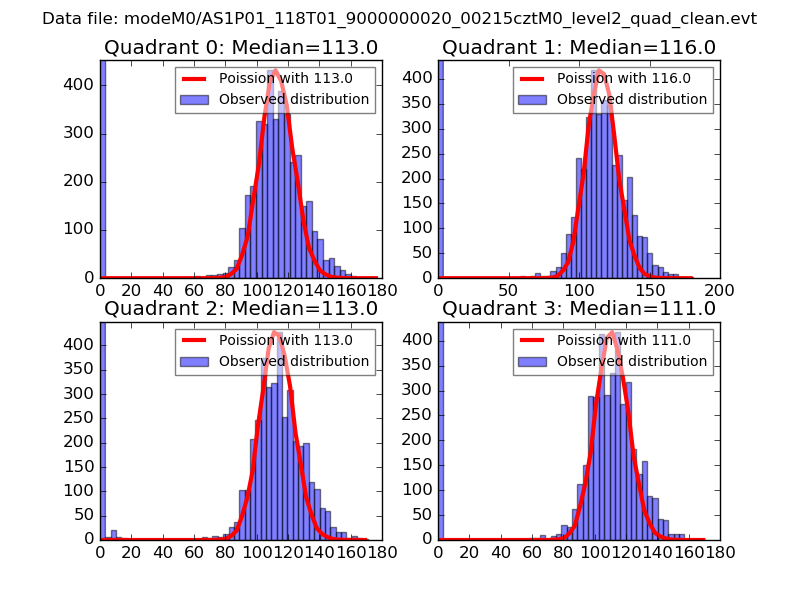 |
 |
| Quadrant-wise count rates Data is divided into 100 sec bins |
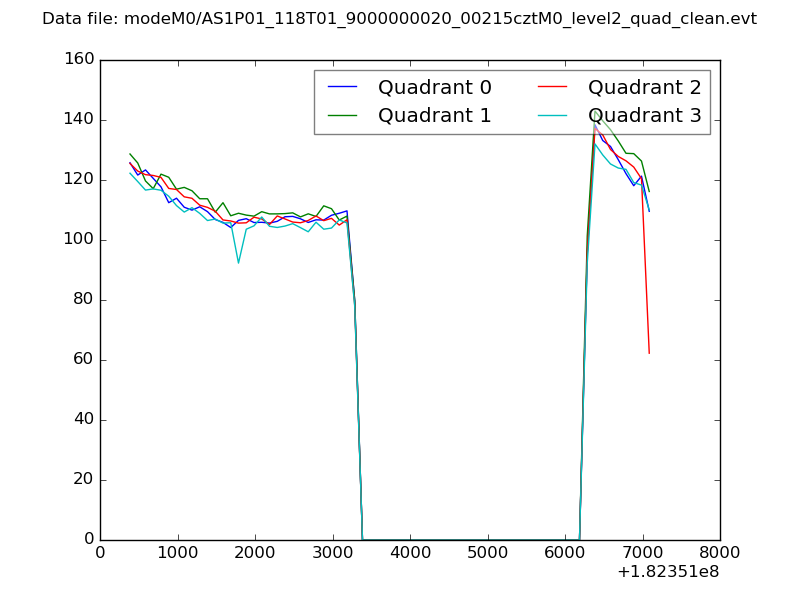 |
|
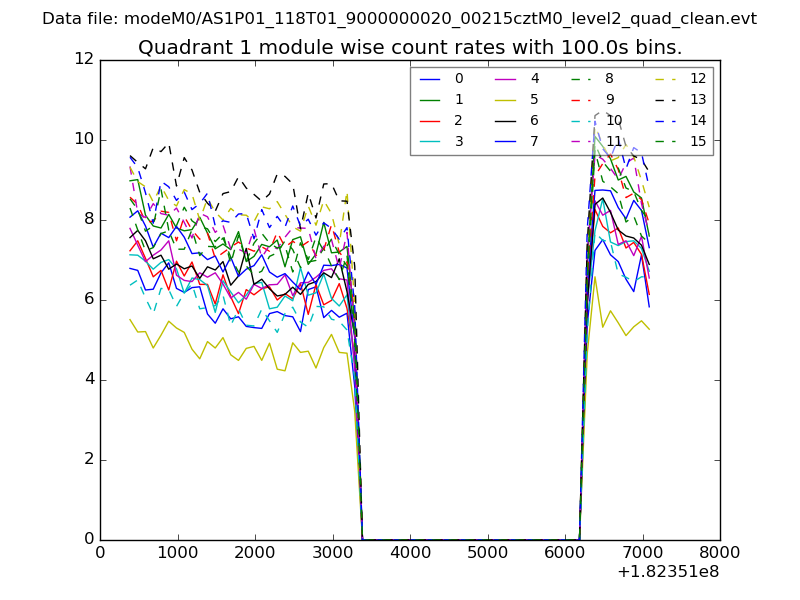
| Module-wise count rates for Quadrant A Data is divided into 100 sec bins |
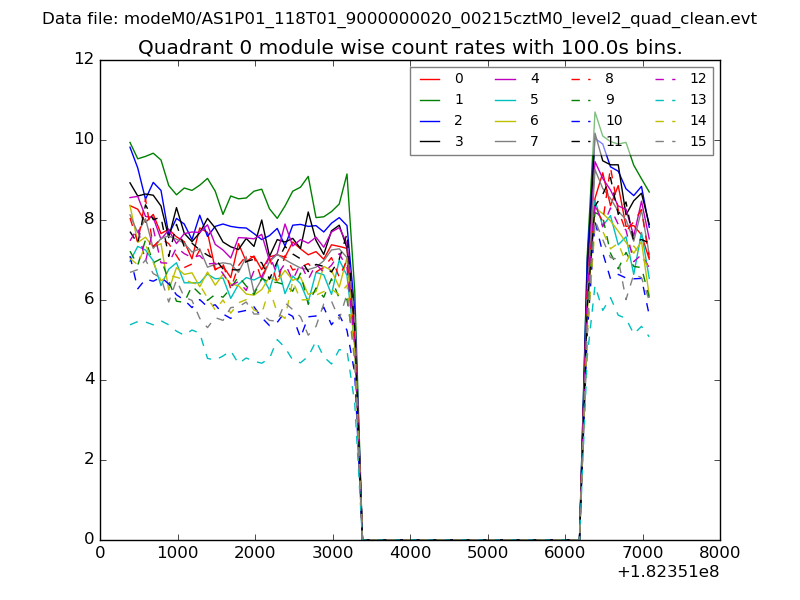 |
 |
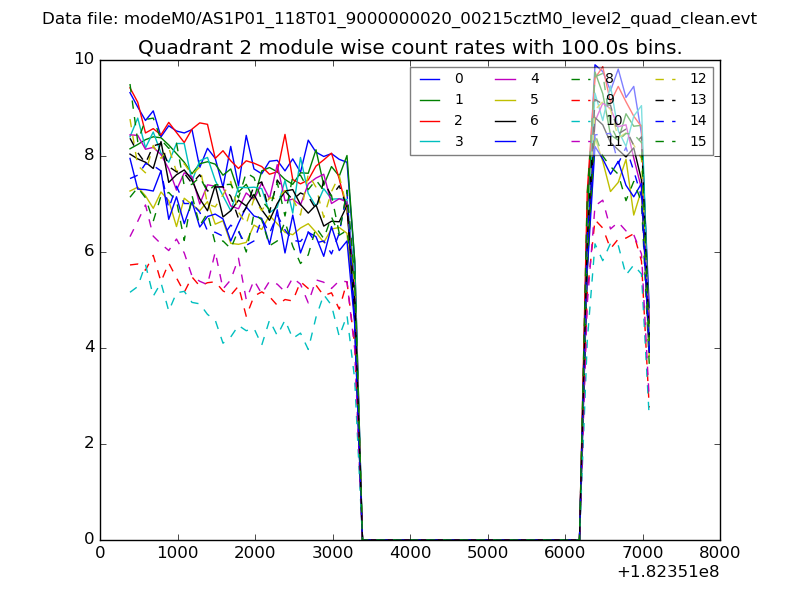
| Module-wise count rates for Quadrant B Data is divided into 100 sec bins |
 |
 |
| Module-wise count rates for Quadrant C Data is divided into 100 sec bins |
 |
 |
| Module-wise count rates for Quadrant D Data is divided into 100 sec bins |
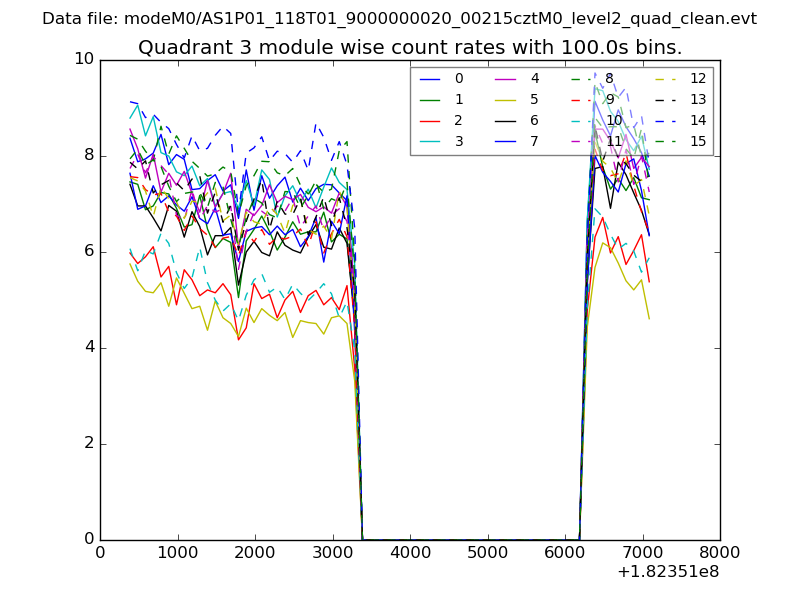 |
 |
| Parameter | Plot |
|---|---|
| CZT HV Monitor | 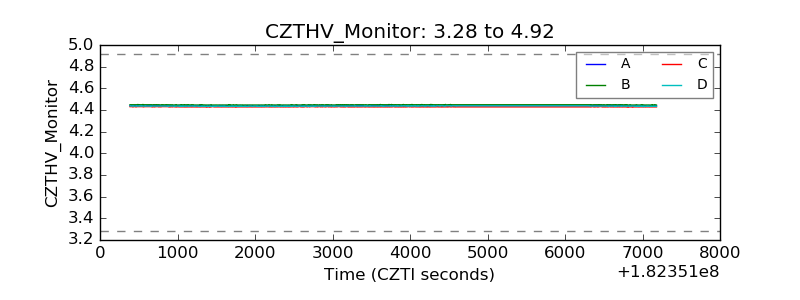 |
| D_VDD | 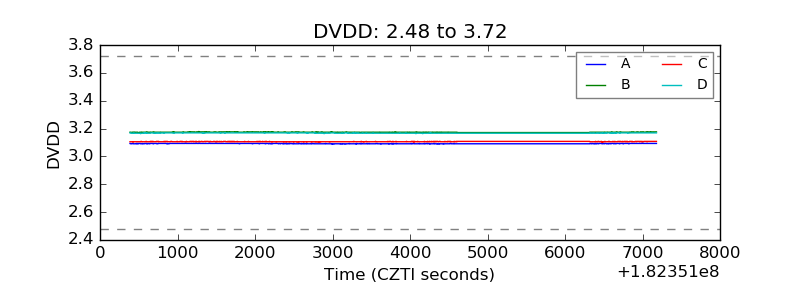 |
| Temperature 1 | 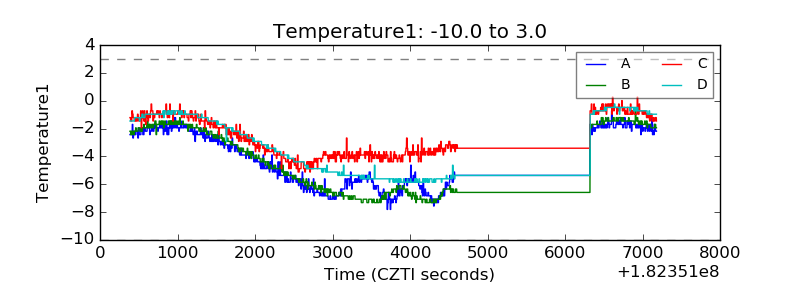 |
| Veto HV Monitor | 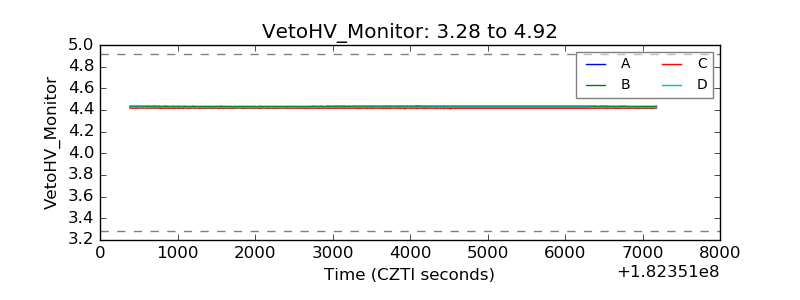 |
| Veto LLD | 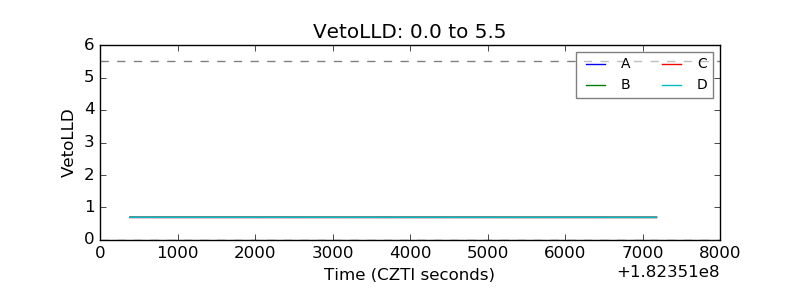 |
| Alpha Counter | 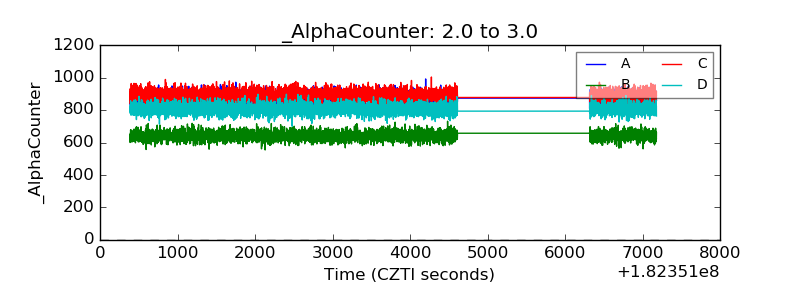 |
| _CPM_Rate | 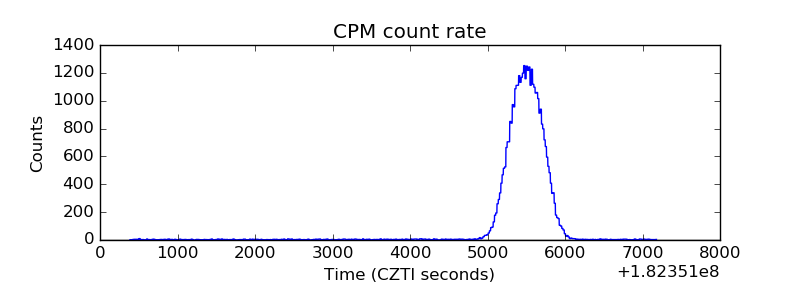 |
| CZT Counter |  |
| +2.5 Volts monitor | 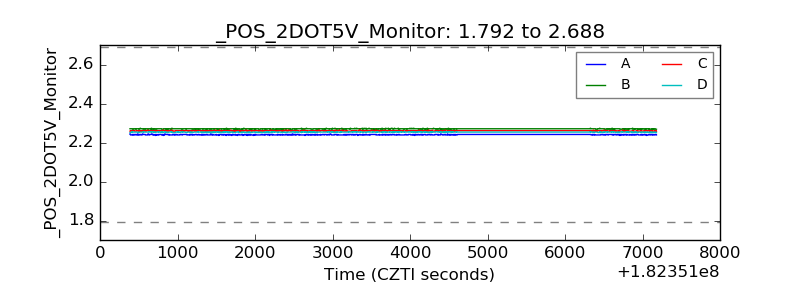 |
| +5 Volts monitor |  |
| _ROLL_ROT | 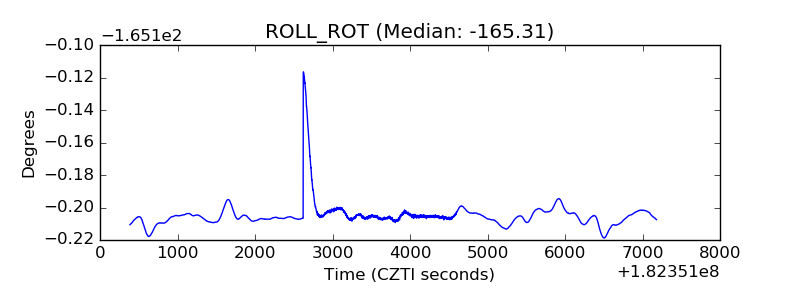 |
| _Roll_DEC | 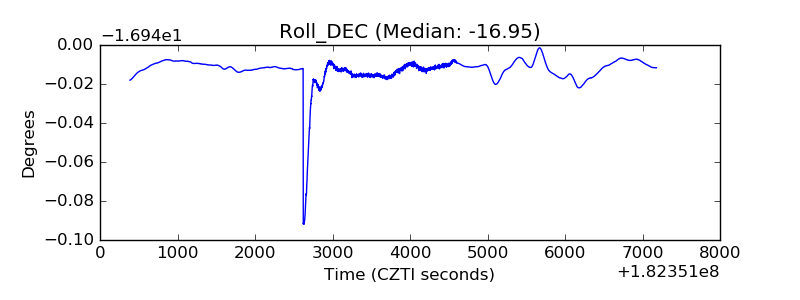 |
| _Roll_RA | 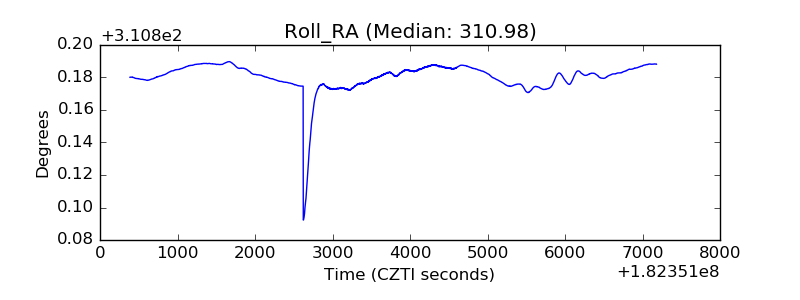 |
| Veto Counter | 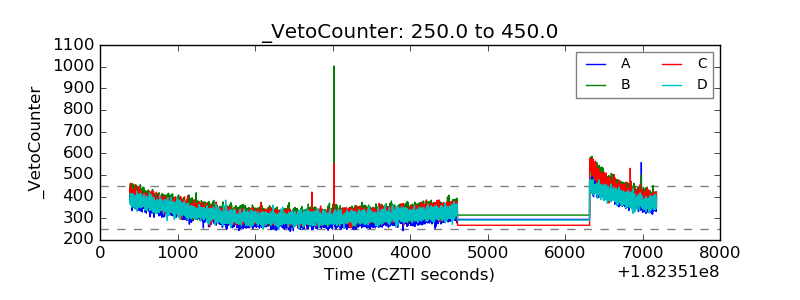 |