| Param | Original file | Final file |
|---|---|---|
| Filename | modeM0/AS1P01_118T02_9000000022_00216cztM0_level2.evt | modeM0/AS1P01_118T02_9000000022_00216cztM0_level2_quad_clean.evt |
| Size (bytes) | 650,266,560 | 50,086,080 |
| Size | 620.1 MB | 47.8 MB |
| Events in quadrant A | 5,516,006 | 309,896 |
| Events in quadrant B | 4,955,429 | 313,664 |
| Events in quadrant C | 4,449,824 | 304,219 |
| Events in quadrant D | 4,498,182 | 298,925 |
| Mode M0 | |||
|---|---|---|---|
| Quadrant | BADHDUFLAG | Total packets | Discarded packets |
| A | 0 | 19276 | 2 |
| B | 0 | 17663 | 1 |
| C | 0 | 16178 | 1 |
| D | 0 | 16312 | 1 |
| Mode SS | |||
|---|---|---|---|
| Quadrant | BADHDUFLAG | Total packets | Discarded packets |
| A | 0 | 84 | 0 |
| B | 0 | 84 | 0 |
| C | 0 | 84 | 0 |
| D | 0 | 84 | 0 |
| Mode M9 | |||
|---|---|---|---|
| Quadrant | BADHDUFLAG | Total packets | Discarded packets |
| A | 0 | 17 | 0 |
| B | 0 | 17 | 0 |
| C | 0 | 17 | 0 |
| D | 0 | 17 | 0 |
| Quadrant | Total seconds | Saturated seconds | Saturation percentage |
|---|---|---|---|
| A | 4109 | 40 | 0.973473% |
| B | 4109 | 1 | 0.024337% |
| C | 4109 | 3 | 0.073010% |
| D | 4109 | 9 | 0.219031% |
Noise dominated data is calculated using 1-second bins in cleaned event files. If a bin has >2000 counts, and if more than 50% of those come from <1% of pixels, then it is considered to be noise-dominated and hence unusable.
| Quadrant | # 1 sec bins | Bins with >0 counts | Bins with >2000 counts | High rate bins dominated by noise | Noise dominated (total time) | Noise dominated (detector-on time) | Marked lightcurve |
|---|---|---|---|---|---|---|---|
| A | 5814 | 4110 | 265 | 265 | 4.56% | 6.45% | 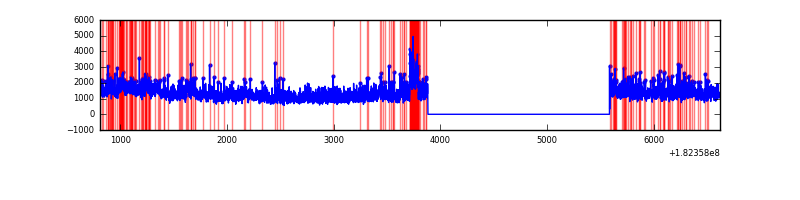 |
| B | 5814 | 4110 | 74 | 74 | 1.27% | 1.80% | 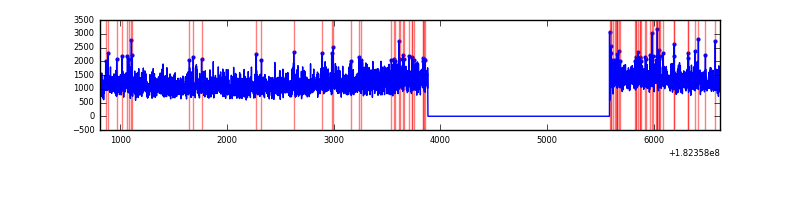 |
| C | 5814 | 4110 | 35 | 35 | 0.60% | 0.85% | 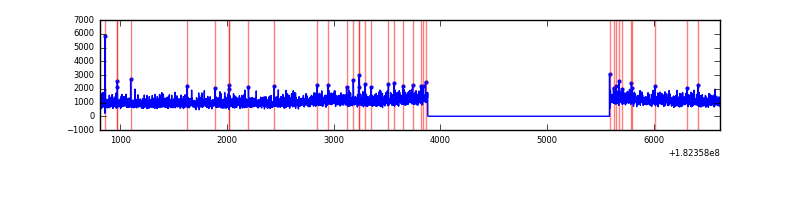 |
| D | 5814 | 4110 | 56 | 56 | 0.96% | 1.36% | 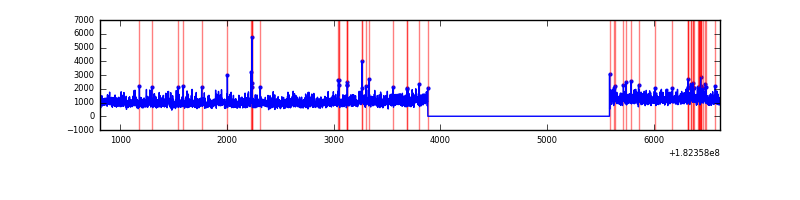 |
Top three noisy pixels from each quadrant. If the there are fewer than three noisy pixels in the level2.evt file, extra rows are filled as -1
| Pixel properties | Quadrant properties | ||||||
|---|---|---|---|---|---|---|---|
| Quadrant | DetID | PixID | Counts | Sigma | Mean | Median | Sigma |
| A | 15 | 127 | 633418 | 2366.11 | 1216 | 1207 | 267.2 |
| A | 0 | 6 | 121475 | 450.11 | 1216 | 1207 | 267.2 |
| A | 12 | 149 | 27131 | 97.02 | 1216 | 1207 | 267.2 |
| B | 5 | 46 | 219742 | 765.93 | 1222 | 1232 | 285.3 |
| B | 15 | 219 | 20495 | 67.52 | 1222 | 1232 | 285.3 |
| B | 0 | 190 | 19065 | 62.51 | 1222 | 1232 | 285.3 |
| C | 1 | 1 | 52395 | 164.55 | 1112 | 1152 | 311.4 |
| C | 9 | 241 | 11127 | 32.03 | 1112 | 1152 | 311.4 |
| C | 5 | 0 | 8442 | 23.41 | 1112 | 1152 | 311.4 |
| D | 1 | 4 | 210597 | 622.78 | 1075 | 1117 | 336.4 |
| D | 13 | 117 | 50706 | 147.43 | 1075 | 1117 | 336.4 |
| D | 7 | 53 | 37678 | 108.69 | 1075 | 1117 | 336.4 |
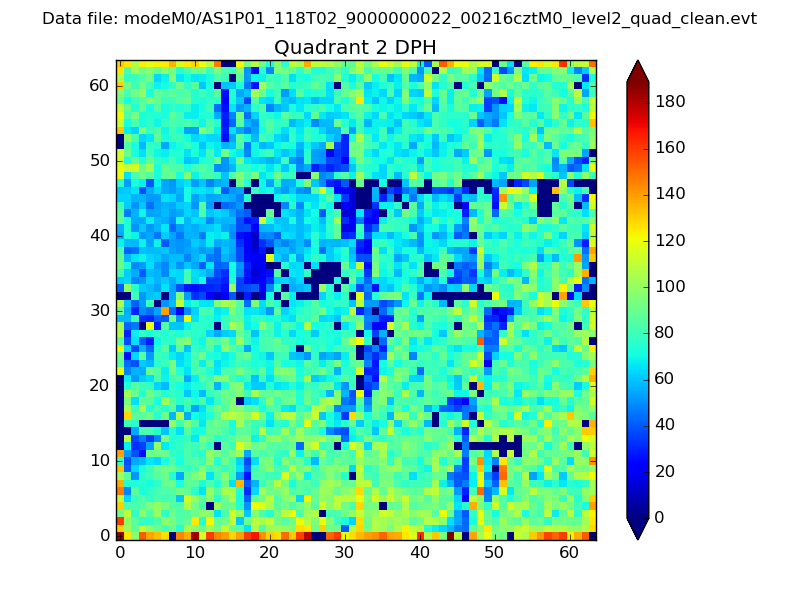
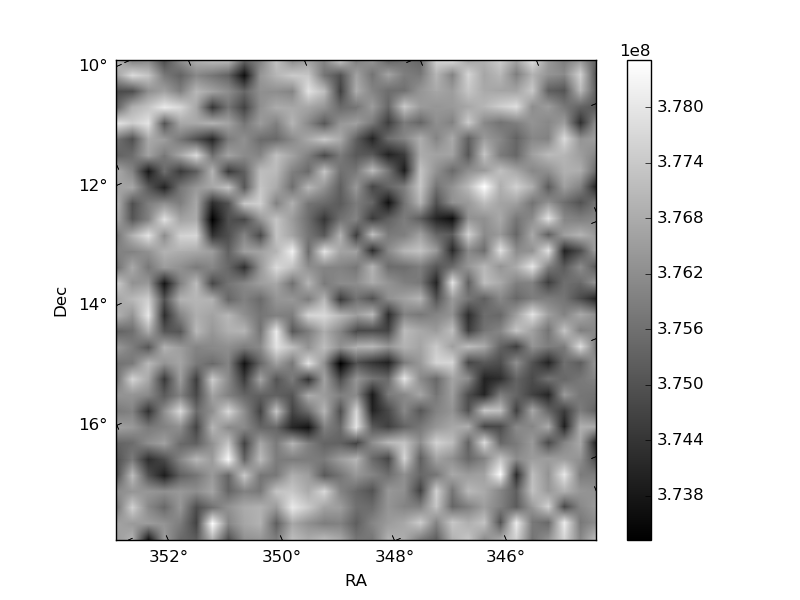
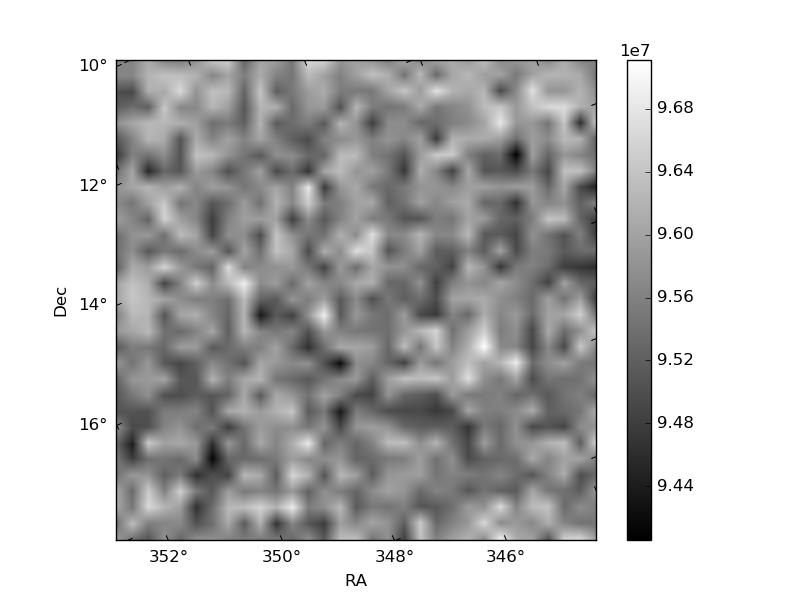
Histogram calculated using DETX and DETY for each event in the final _common_clean file
| Quadrant A | 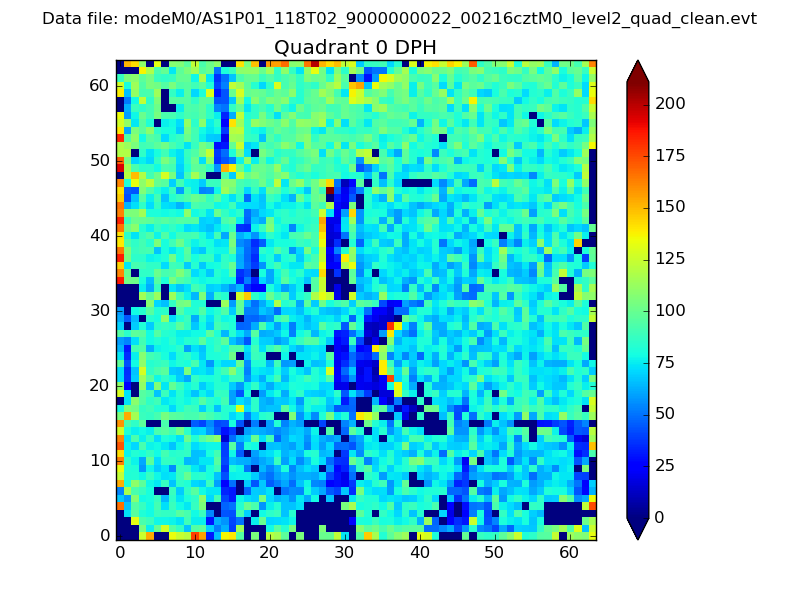 |
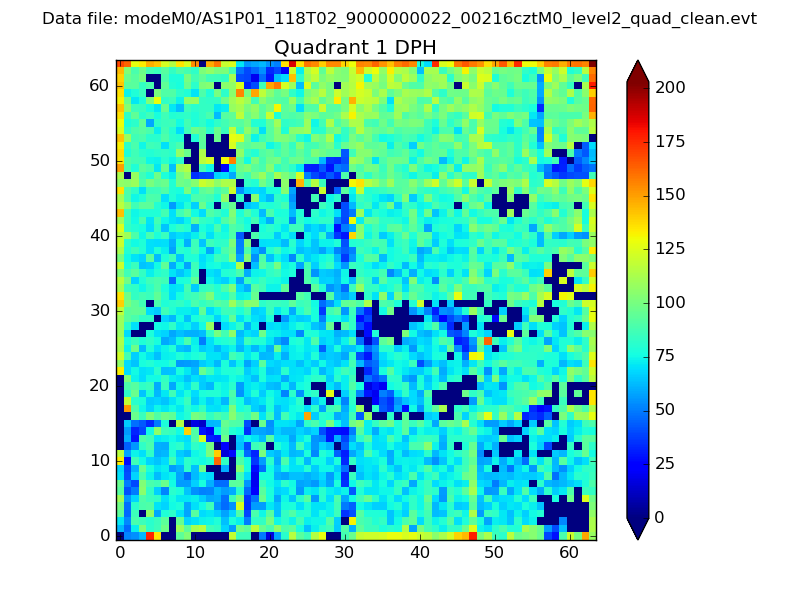 |
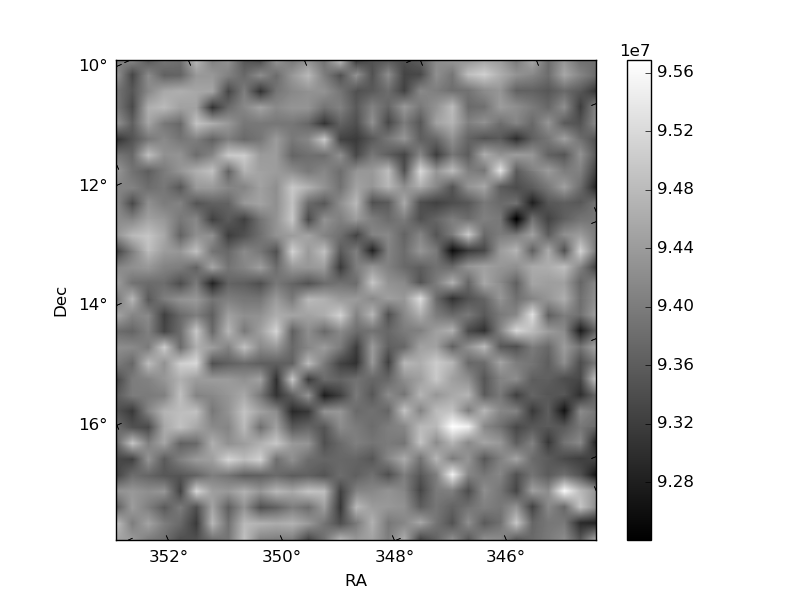
Quadrant B |
|---|---|---|---|
| Quadrant D | 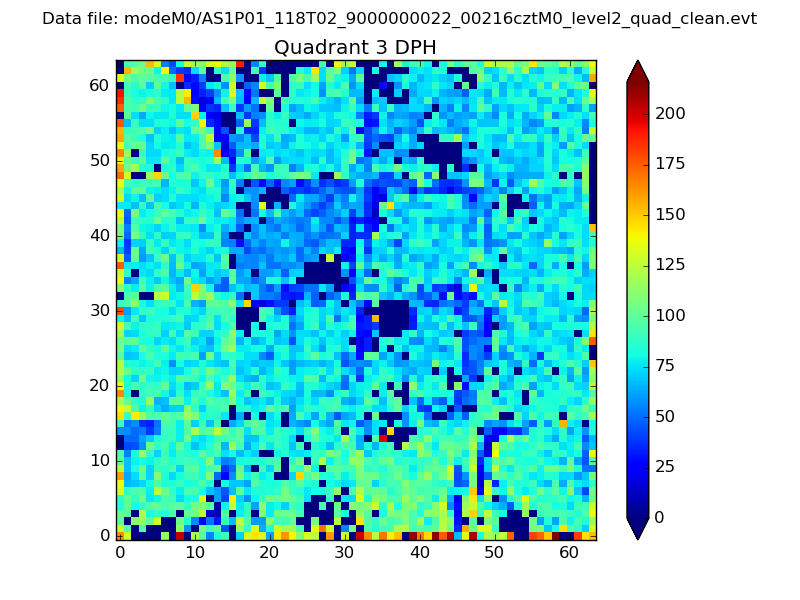 |
 |
Quadrant C |
| Plot type | Count rate plots | Images |
|---|---|---|
| Comparison with Poisson distribution Blue bars denote a histogram of data divided into 1 sec bins. Red curve is a Poisson curve with rate = median count rate of data. |
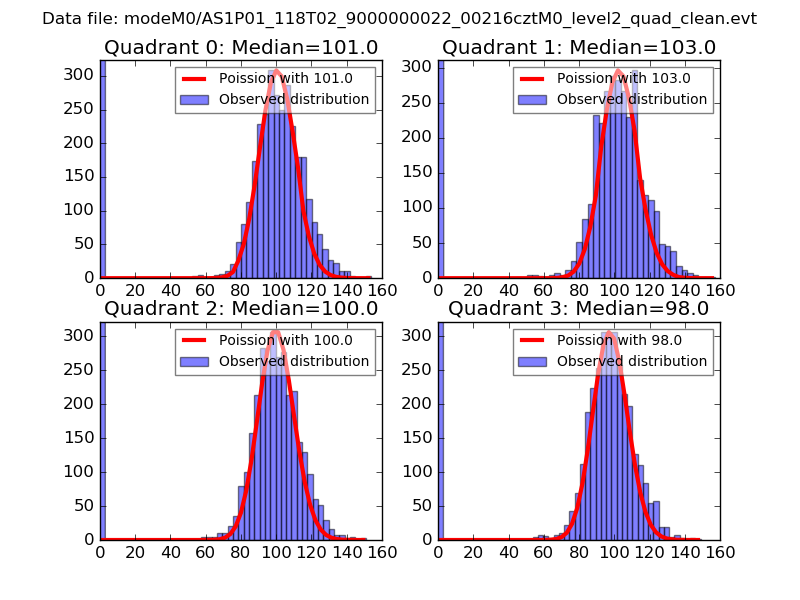 |
 |
| Quadrant-wise count rates Data is divided into 100 sec bins |
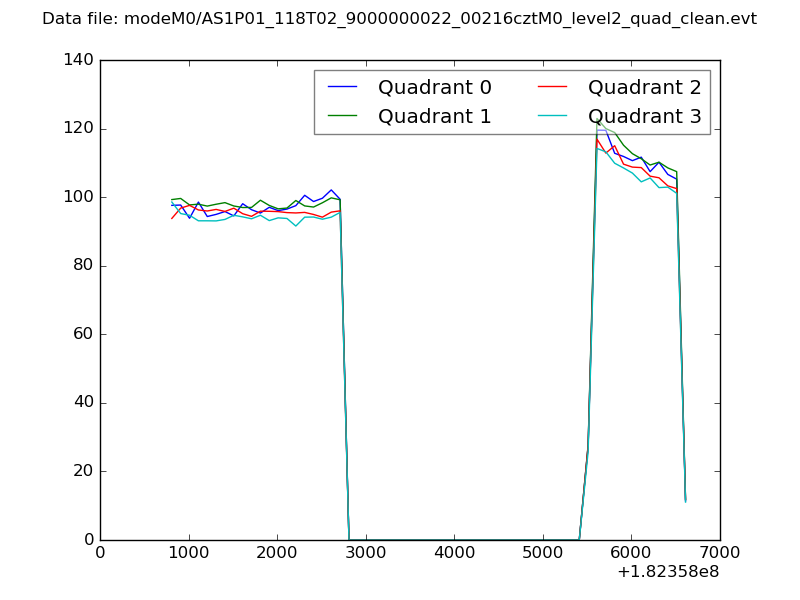 |
|
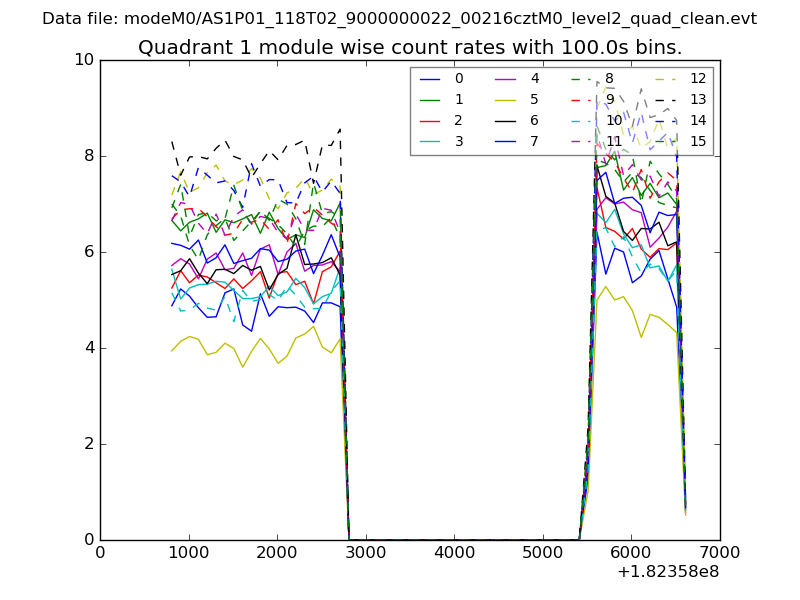
| Module-wise count rates for Quadrant A Data is divided into 100 sec bins |
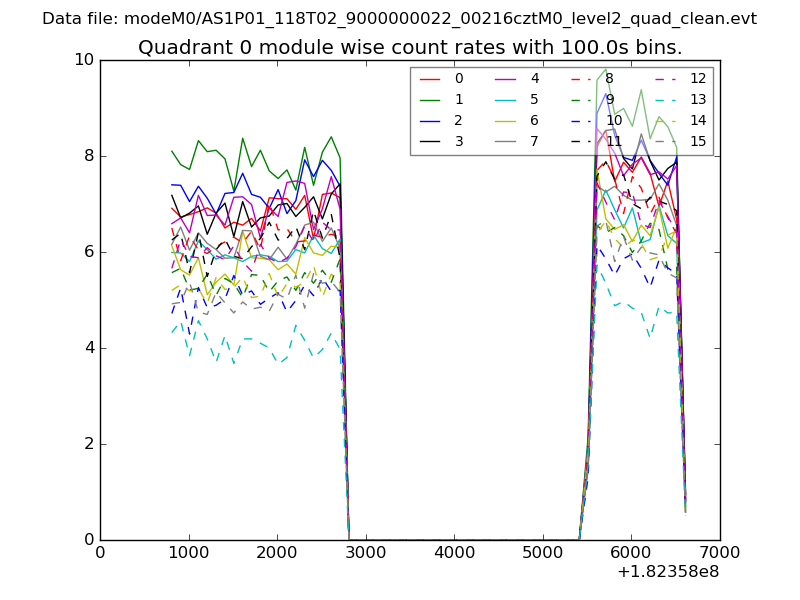 |
 |
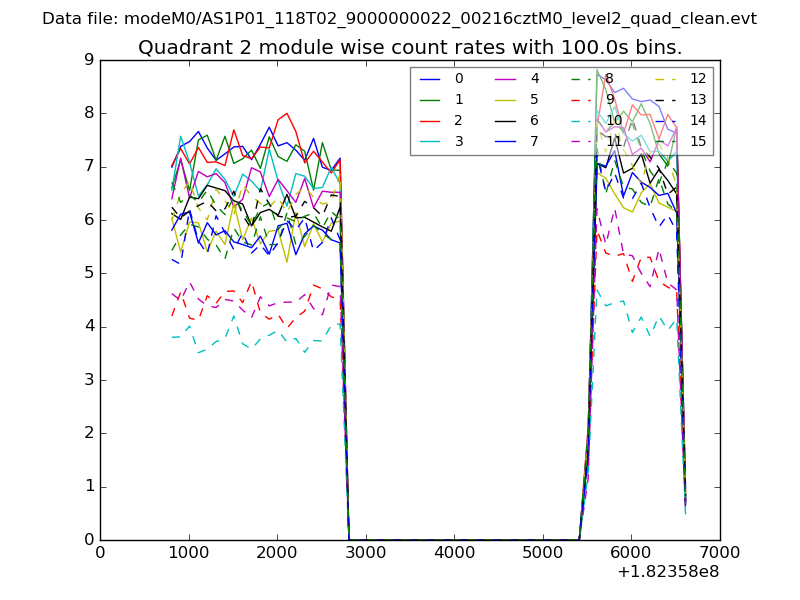
| Module-wise count rates for Quadrant B Data is divided into 100 sec bins |
 |
 |
| Module-wise count rates for Quadrant C Data is divided into 100 sec bins |
 |
 |
| Module-wise count rates for Quadrant D Data is divided into 100 sec bins |
 |
 |
| Parameter | Plot |
|---|---|
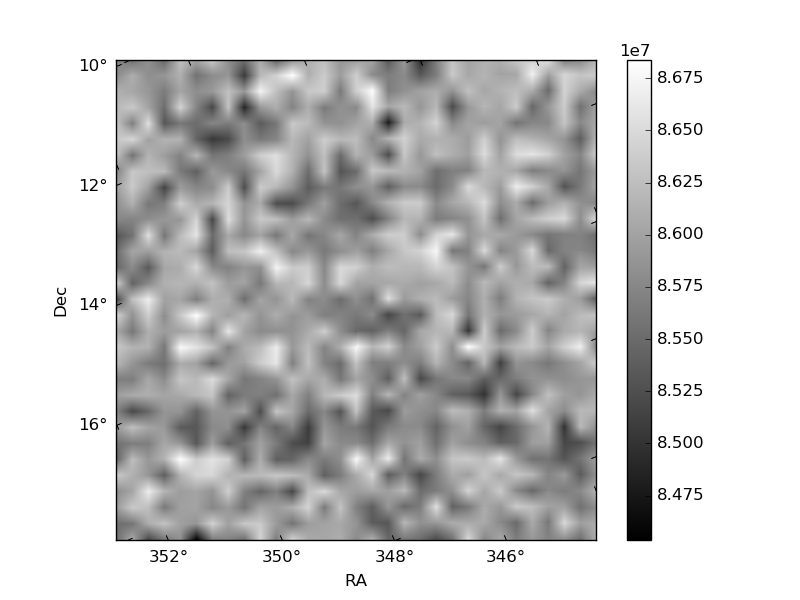
| CZT HV Monitor |  |
| D_VDD | 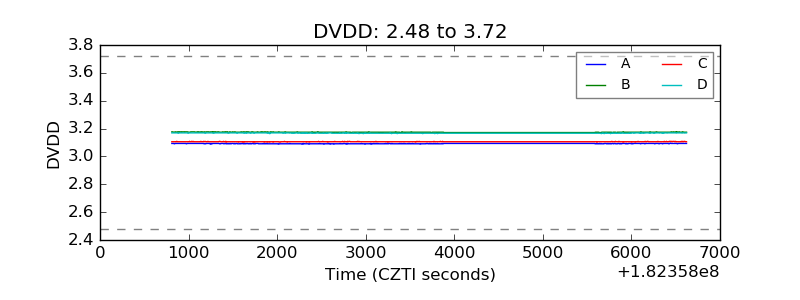 |
| Temperature 1 | 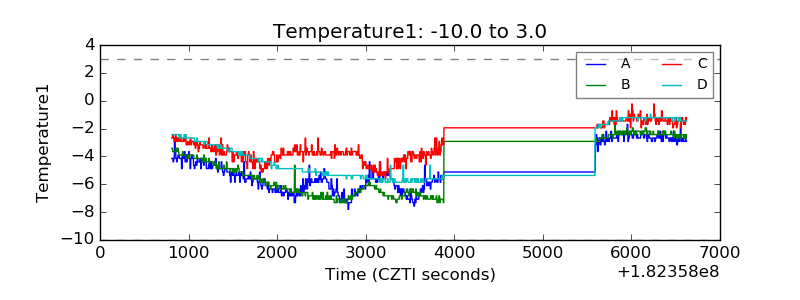 |
| Veto HV Monitor | 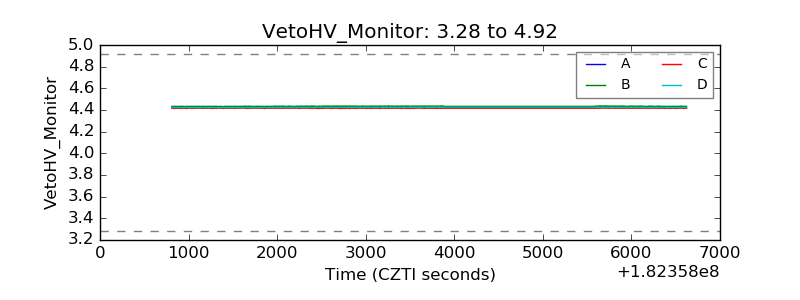 |
| Veto LLD | 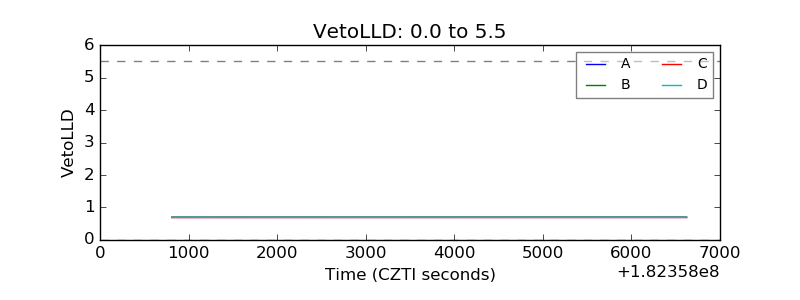 |
| Alpha Counter | 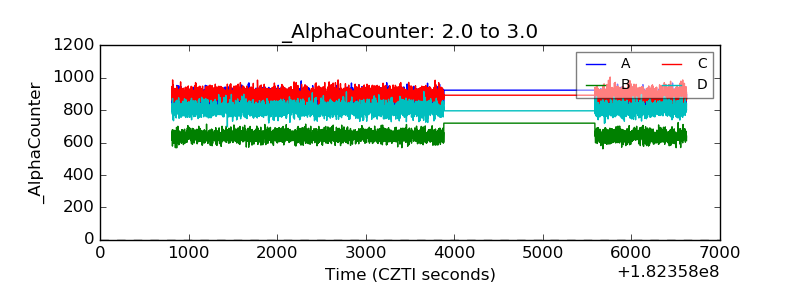 |
| _CPM_Rate | 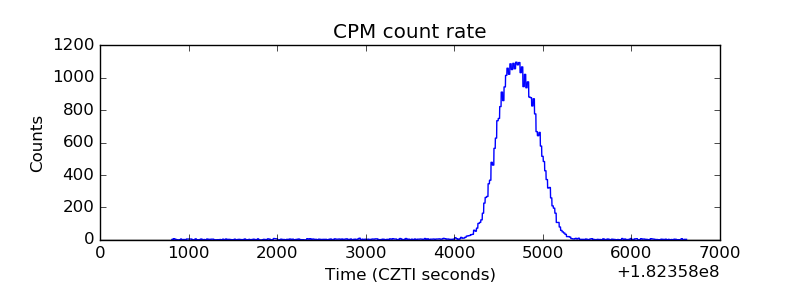 |
| CZT Counter | 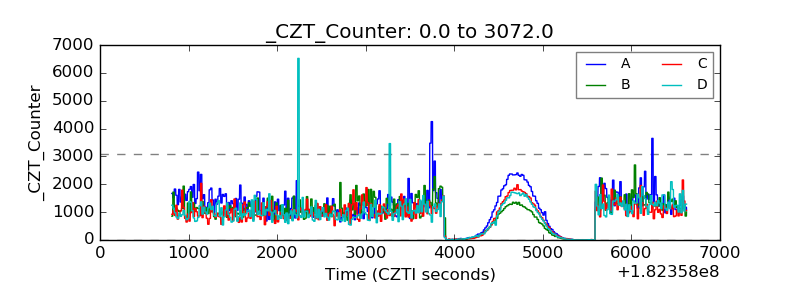 |
| +2.5 Volts monitor |  |
| +5 Volts monitor |  |
| _ROLL_ROT | 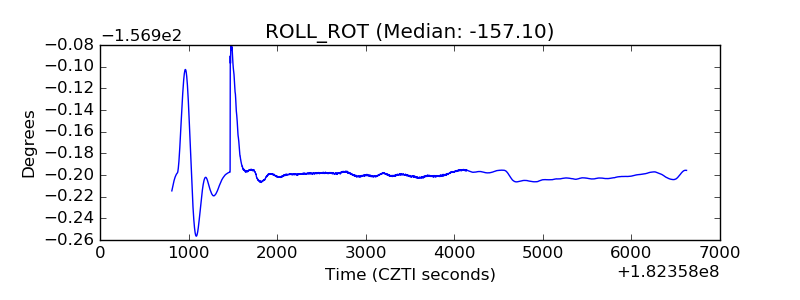 |
| _Roll_DEC | 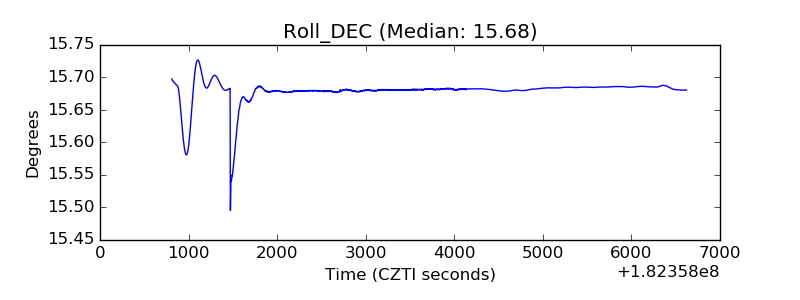 |
| _Roll_RA | 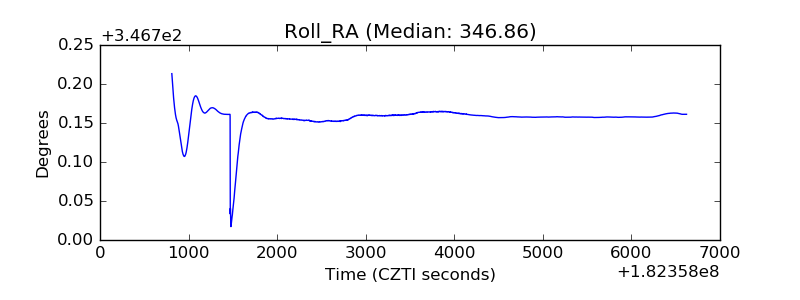 |
| Veto Counter | 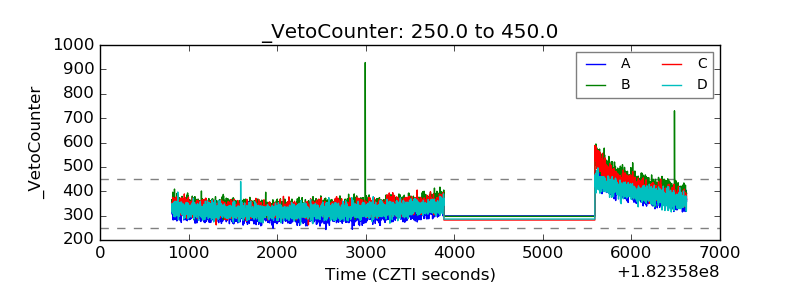 |