| Param | Original file | Final file |
|---|---|---|
| Filename | modeM0/AS1P01_118T02_9000000022_00217cztM0_level2.evt | modeM0/AS1P01_118T02_9000000022_00217cztM0_level2_quad_clean.evt |
| Size (bytes) | 722,401,920 | 54,437,760 |
| Size | 688.9 MB | 51.9 MB |
| Events in quadrant A | 5,736,390 | 332,750 |
| Events in quadrant B | 5,707,181 | 335,581 |
| Events in quadrant C | 5,061,383 | 325,822 |
| Events in quadrant D | 5,056,722 | 320,766 |
| Mode M0 | |||
|---|---|---|---|
| Quadrant | BADHDUFLAG | Total packets | Discarded packets |
| A | 0 | 21385 | 966 |
| B | 0 | 21147 | 815 |
| C | 0 | 19145 | 680 |
| D | 0 | 19217 | 770 |
| Mode SS | |||
|---|---|---|---|
| Quadrant | BADHDUFLAG | Total packets | Discarded packets |
| A | 0 | 98 | 4 |
| B | 0 | 96 | 2 |
| C | 0 | 99 | 5 |
| D | 0 | 98 | 6 |
| Mode M9 | |||
|---|---|---|---|
| Quadrant | BADHDUFLAG | Total packets | Discarded packets |
| A | 0 | 20 | 2 |
| B | 0 | 19 | 1 |
| C | 0 | 18 | 0 |
| D | 0 | 18 | 0 |
| Quadrant | Total seconds | Saturated seconds | Saturation percentage |
|---|---|---|---|
| A | 4754 | 17 | 0.357594% |
| B | 4751 | 1 | 0.021048% |
| C | 4758 | 2 | 0.042034% |
| D | 4760 | 5 | 0.105042% |
Noise dominated data is calculated using 1-second bins in cleaned event files. If a bin has >2000 counts, and if more than 50% of those come from <1% of pixels, then it is considered to be noise-dominated and hence unusable.
| Quadrant | # 1 sec bins | Bins with >0 counts | Bins with >2000 counts | High rate bins dominated by noise | Noise dominated (total time) | Noise dominated (detector-on time) | Marked lightcurve |
|---|---|---|---|---|---|---|---|
| A | 7377 | 4765 | 181 | 181 | 2.45% | 3.80% | 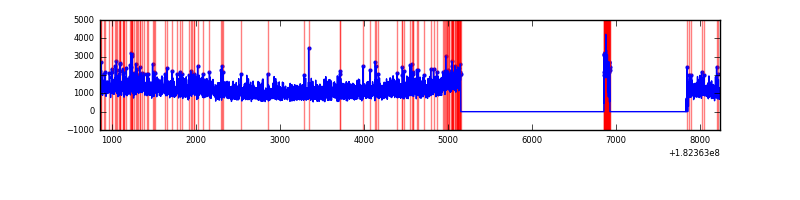 |
| B | 7377 | 4759 | 99 | 99 | 1.34% | 2.08% | 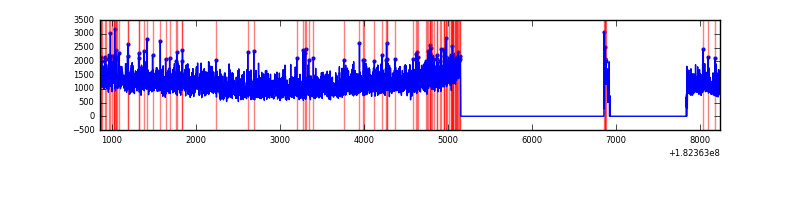 |
| C | 7377 | 4766 | 41 | 41 | 0.56% | 0.86% | 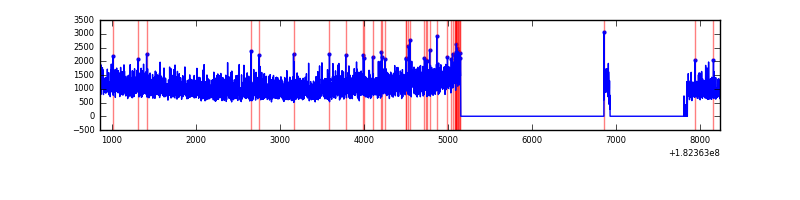 |
| D | 7376 | 4771 | 45 | 45 | 0.61% | 0.94% | 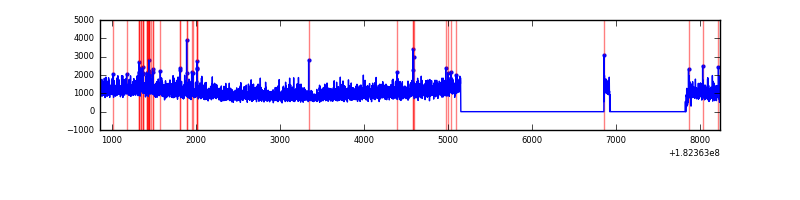 |
Top three noisy pixels from each quadrant. If the there are fewer than three noisy pixels in the level2.evt file, extra rows are filled as -1
| Pixel properties | Quadrant properties | ||||||
|---|---|---|---|---|---|---|---|
| Quadrant | DetID | PixID | Counts | Sigma | Mean | Median | Sigma |
| A | 15 | 127 | 117558 | 379.7 | 1407 | 1398 | 305.9 |
| A | 15 | 79 | 74342 | 238.44 | 1407 | 1398 | 305.9 |
| A | 0 | 253 | 23836 | 73.34 | 1407 | 1398 | 305.9 |
| B | 5 | 46 | 238925 | 719.1 | 1413 | 1424 | 330.3 |
| B | 0 | 190 | 17715 | 49.33 | 1413 | 1424 | 330.3 |
| B | 2 | 253 | 16027 | 44.21 | 1413 | 1424 | 330.3 |
| C | 1 | 1 | 15629 | 40.28 | 1280 | 1331 | 355.0 |
| C | 1 | 192 | 15179 | 39.01 | 1280 | 1331 | 355.0 |
| C | 9 | 241 | 8147 | 19.2 | 1280 | 1331 | 355.0 |
| D | 1 | 4 | 170396 | 441.54 | 1239 | 1290 | 383.0 |
| D | 13 | 207 | 31174 | 78.03 | 1239 | 1290 | 383.0 |
| D | 7 | 50 | 27685 | 68.92 | 1239 | 1290 | 383.0 |
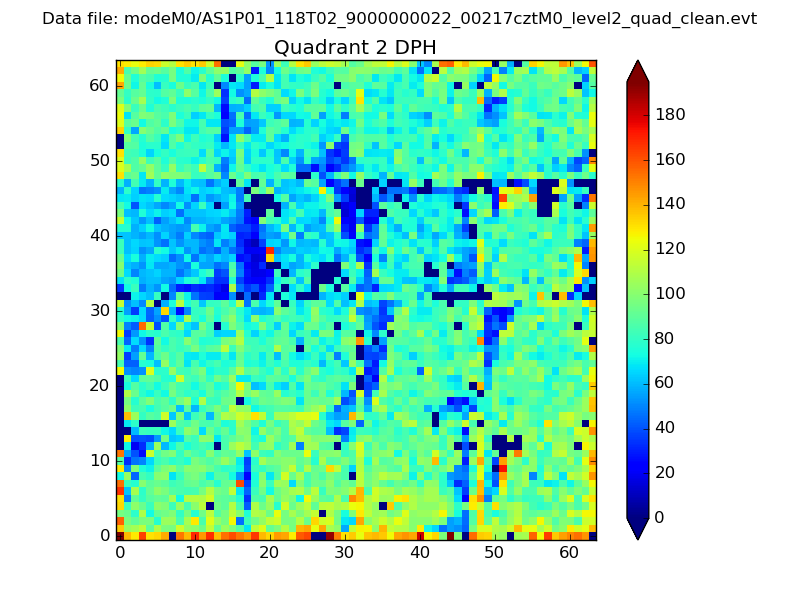
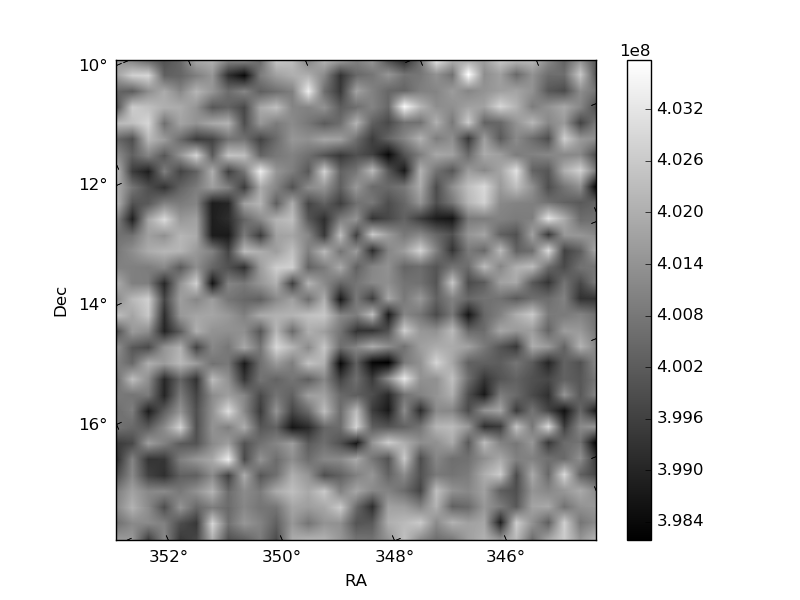
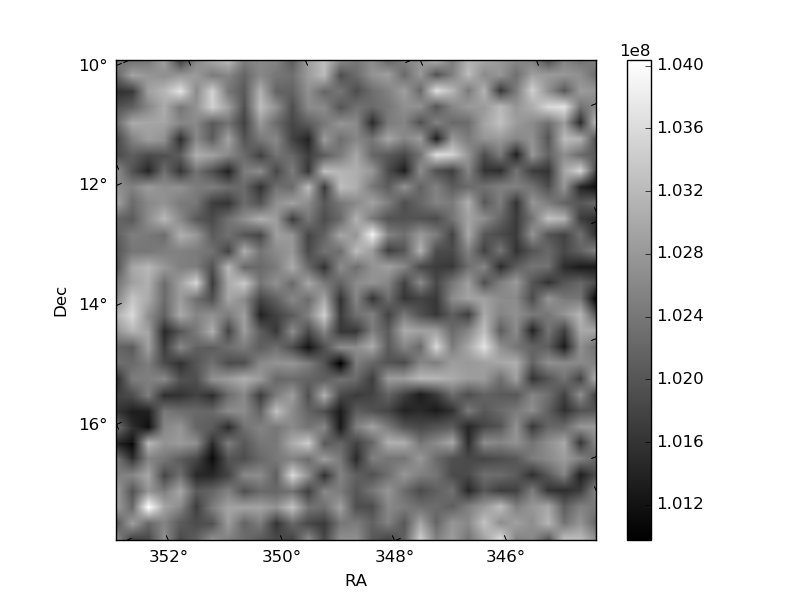
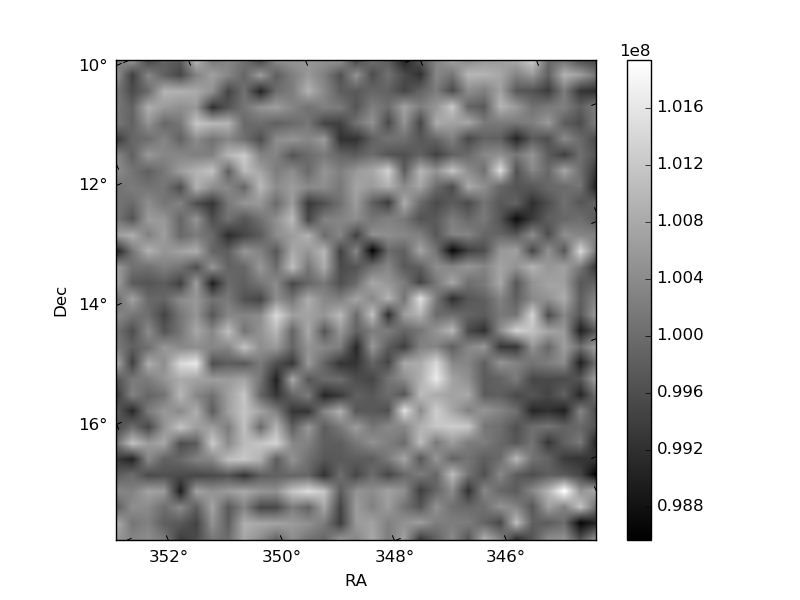
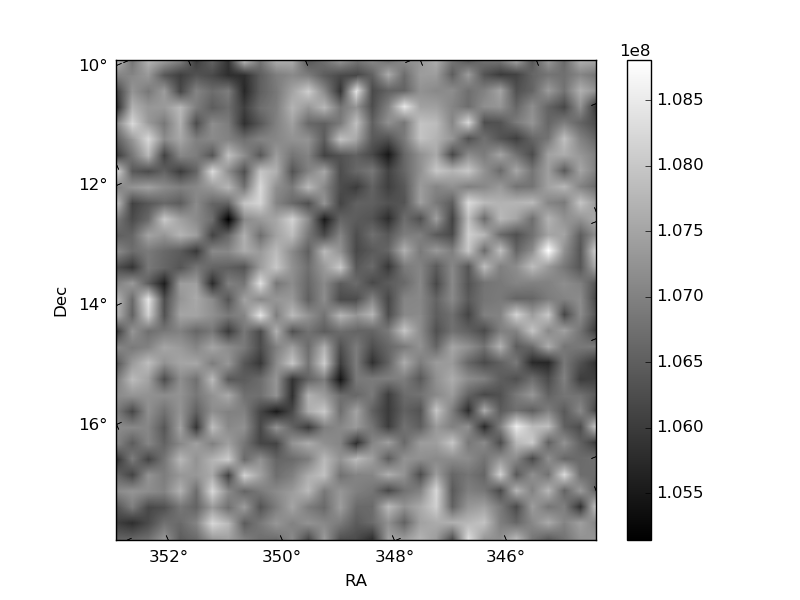
Histogram calculated using DETX and DETY for each event in the final _common_clean file
| Quadrant A | 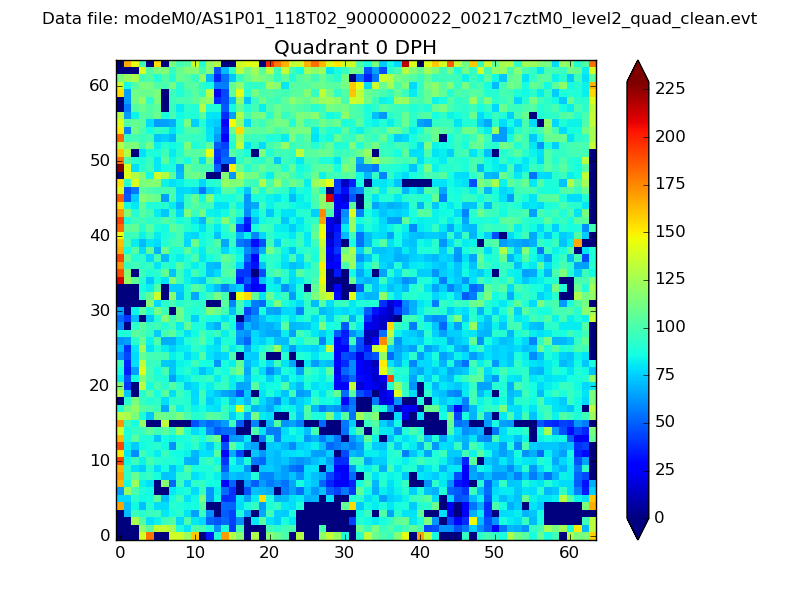 |
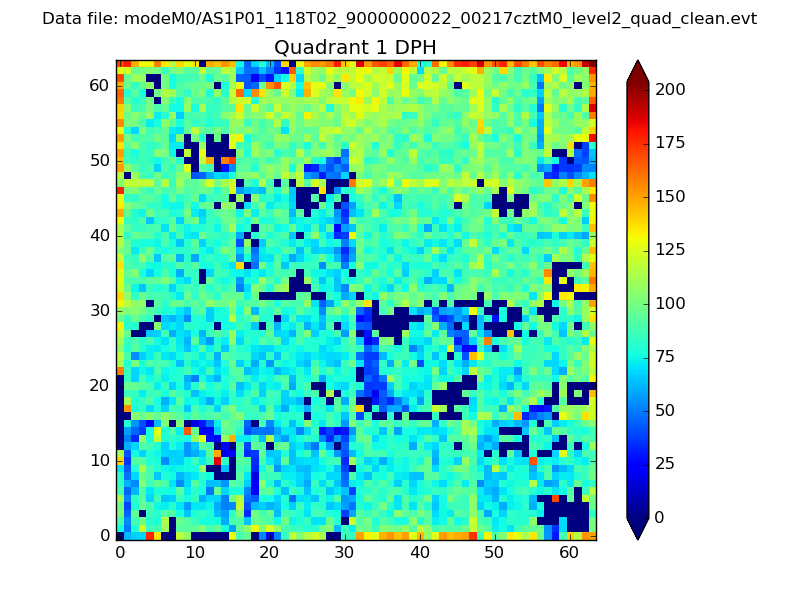 |
Quadrant B |
|---|---|---|---|
| Quadrant D | 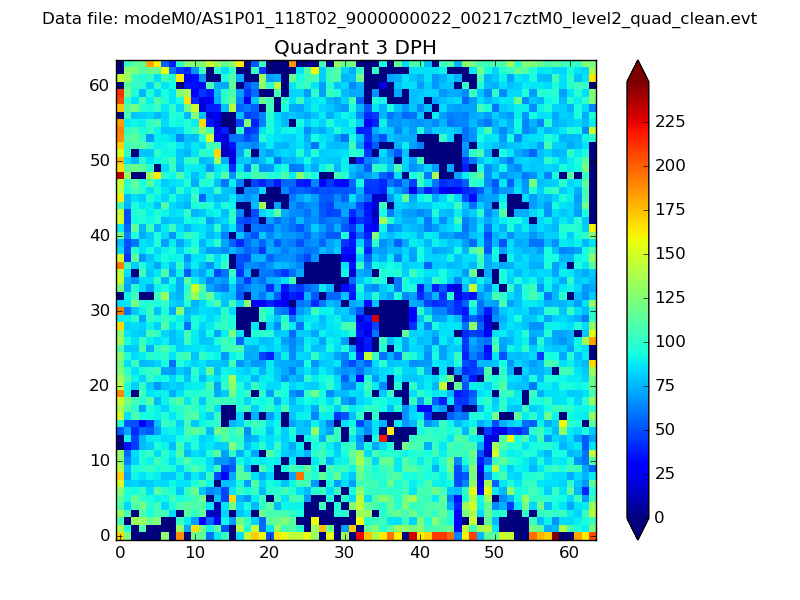 |
 |
Quadrant C |
| Plot type | Count rate plots | Images |
|---|---|---|
| Comparison with Poisson distribution Blue bars denote a histogram of data divided into 1 sec bins. Red curve is a Poisson curve with rate = median count rate of data. |
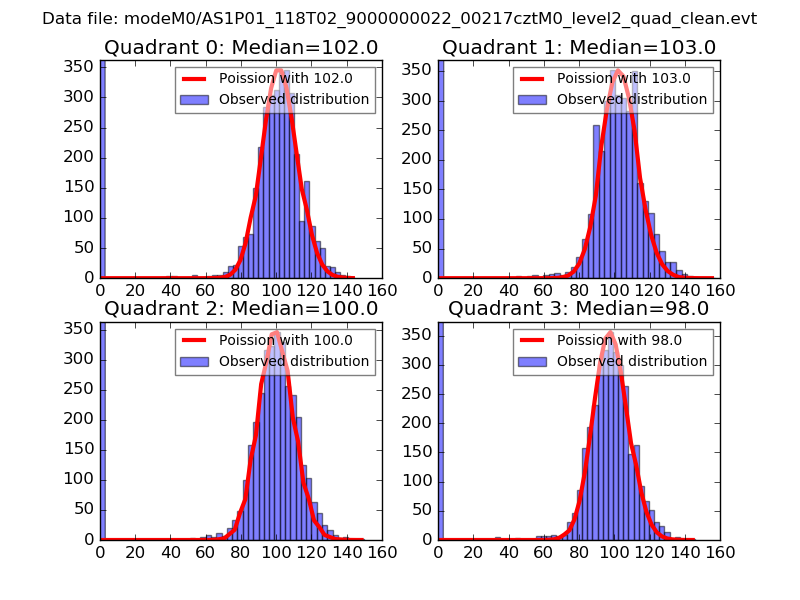 |
 |
| Quadrant-wise count rates Data is divided into 100 sec bins |
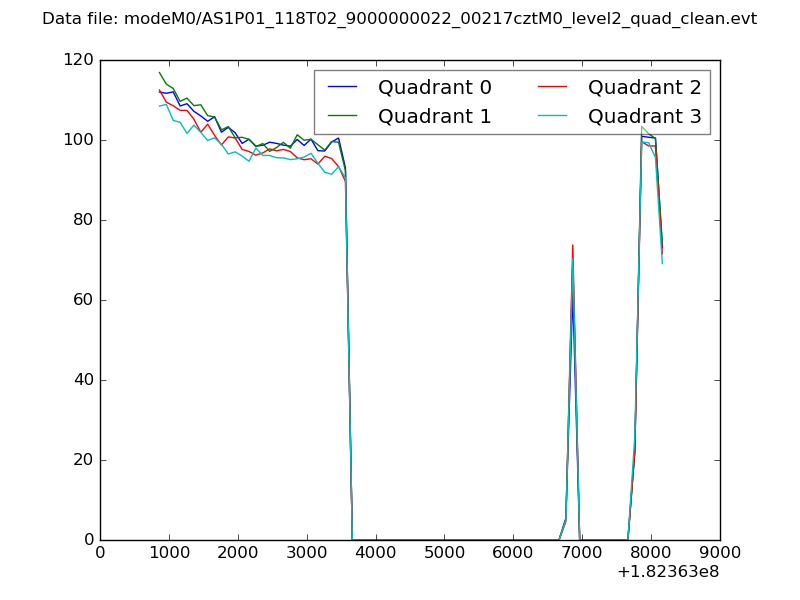 |
|
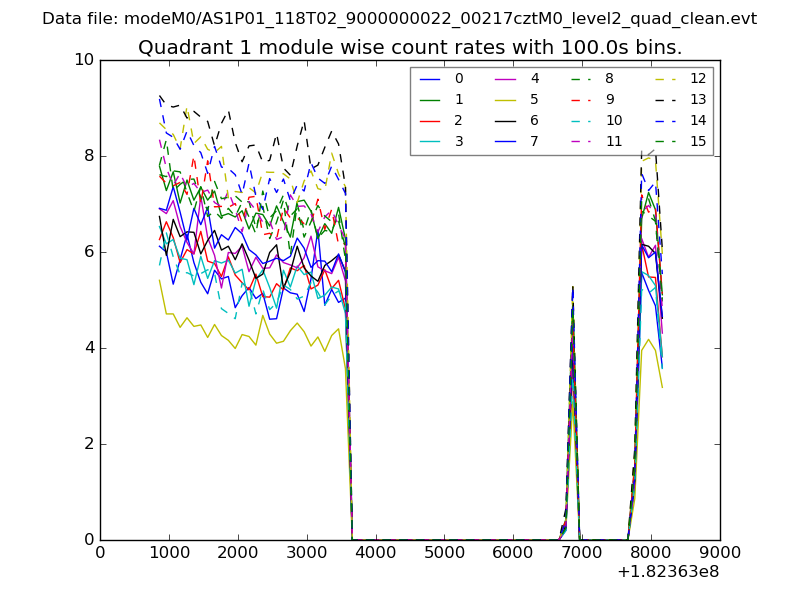
| Module-wise count rates for Quadrant A Data is divided into 100 sec bins |
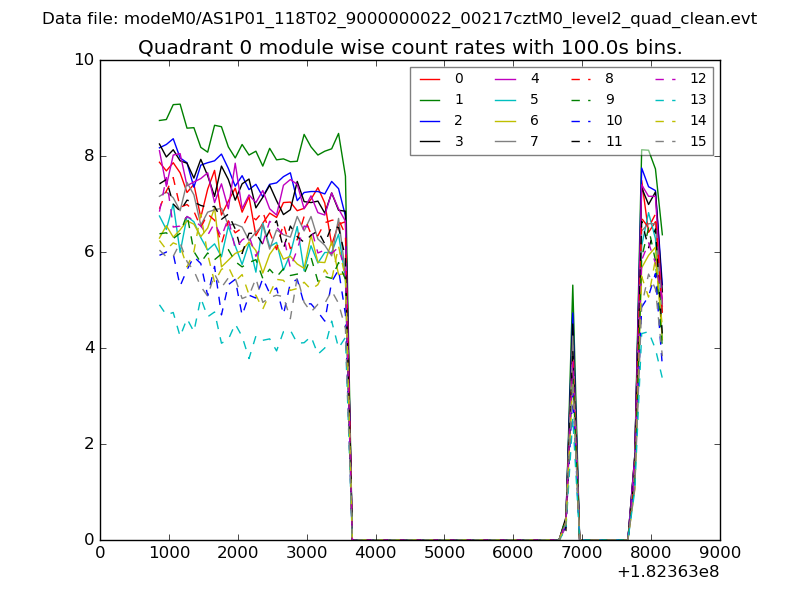 |
 |
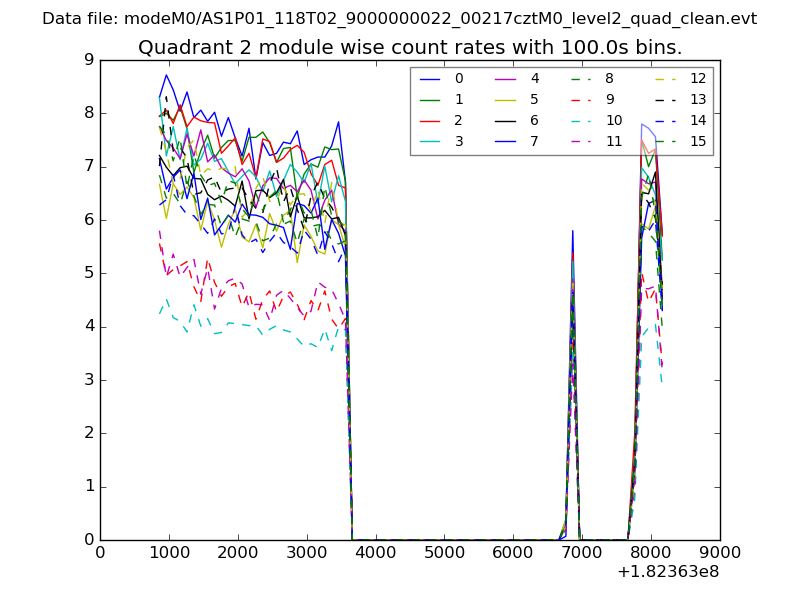
| Module-wise count rates for Quadrant B Data is divided into 100 sec bins |
 |
 |
| Module-wise count rates for Quadrant C Data is divided into 100 sec bins |
 |
 |
| Module-wise count rates for Quadrant D Data is divided into 100 sec bins |
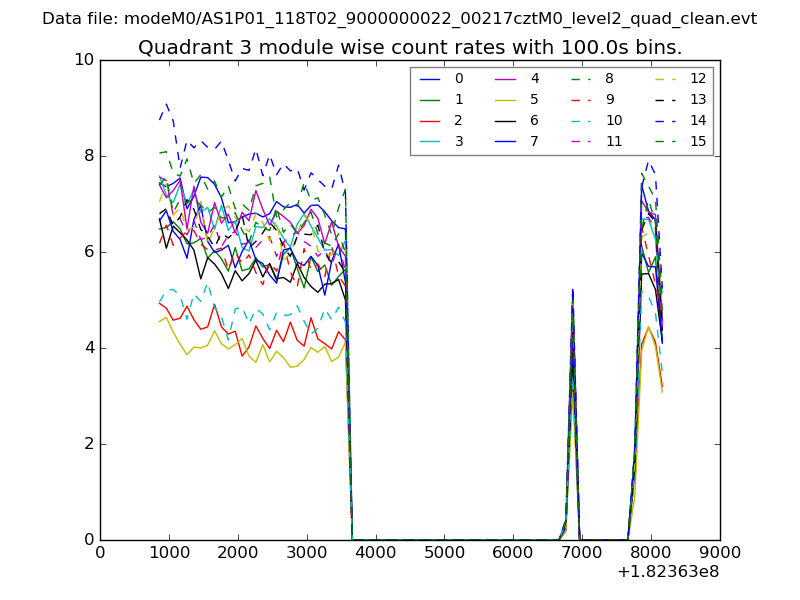 |
 |
| Parameter | Plot |
|---|---|
| CZT HV Monitor | 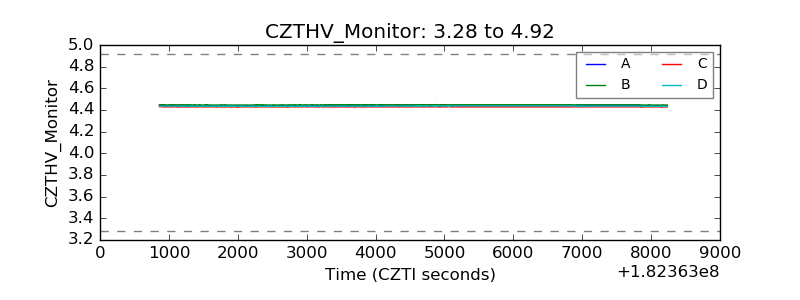 |
| D_VDD | 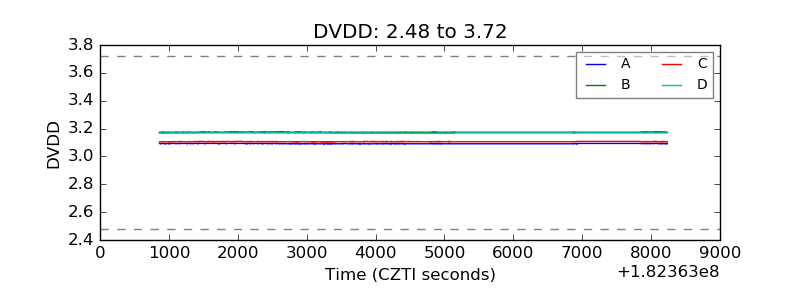 |
| Temperature 1 | 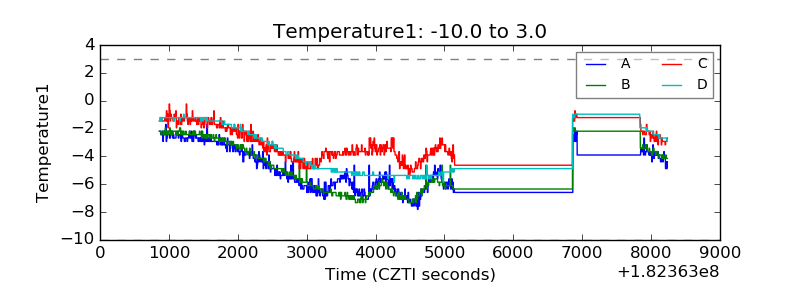 |
| Veto HV Monitor | 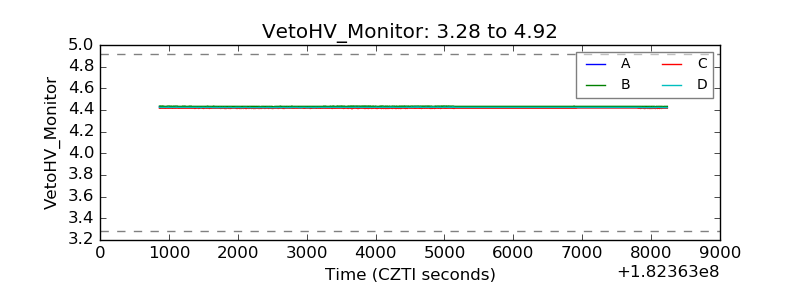 |
| Veto LLD | 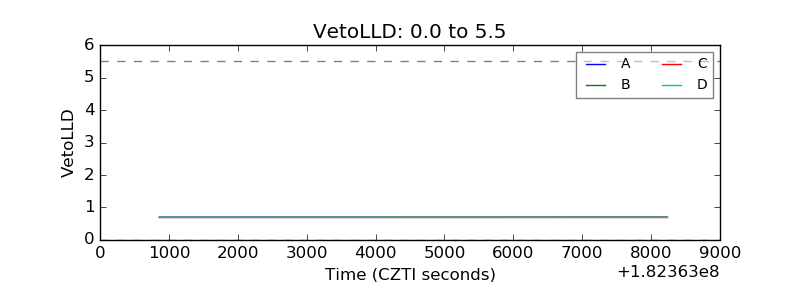 |
| Alpha Counter | 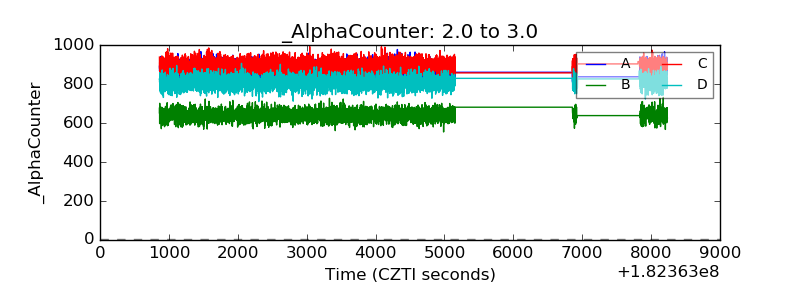 |
| _CPM_Rate | 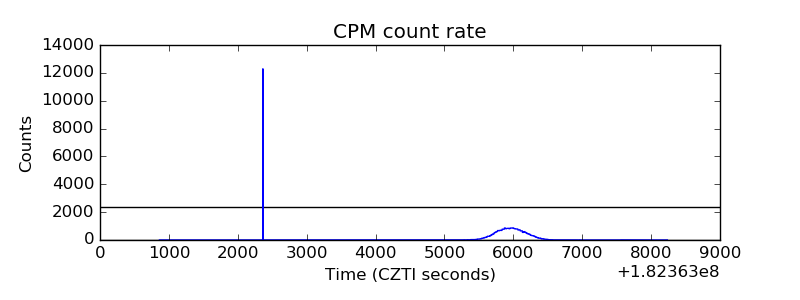 |
| CZT Counter | 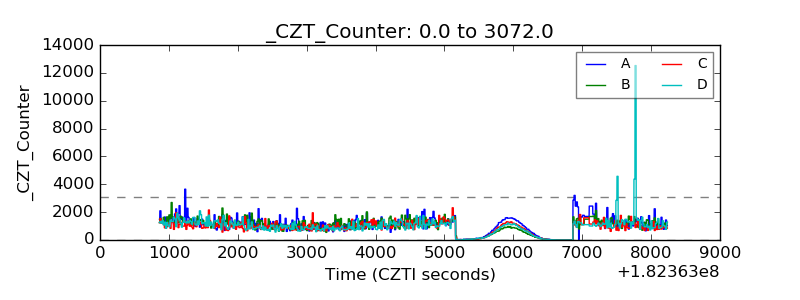 |
| +2.5 Volts monitor |  |
| +5 Volts monitor | 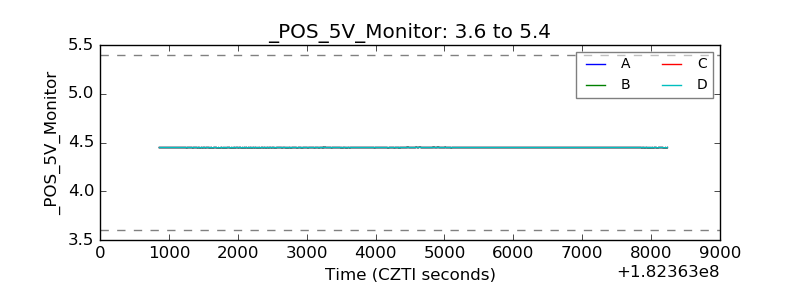 |
| _ROLL_ROT | 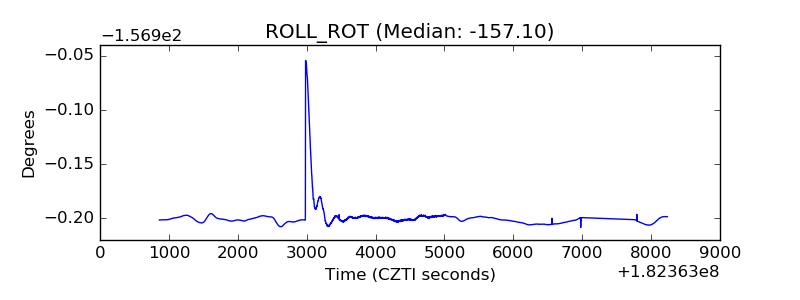 |
| _Roll_DEC | 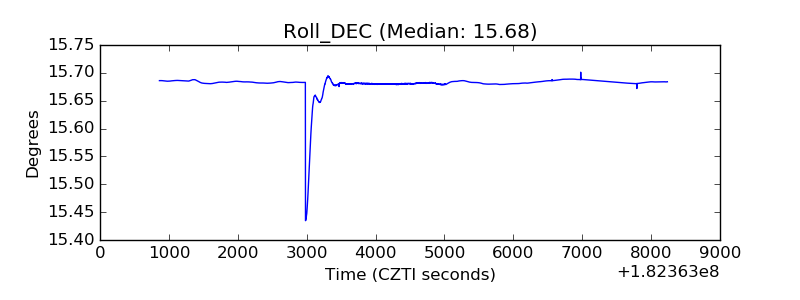 |
| _Roll_RA | 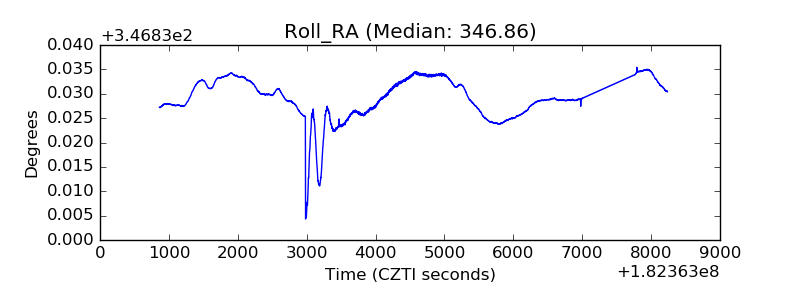 |
| Veto Counter | 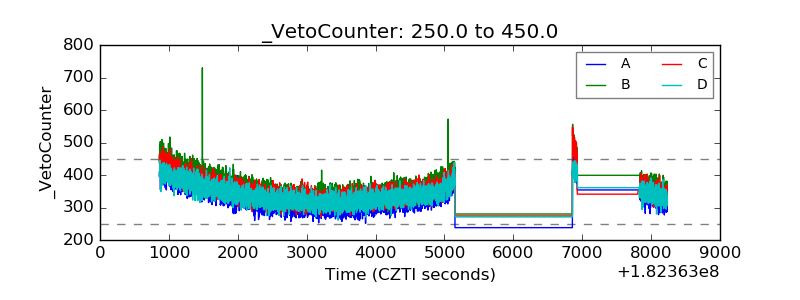 |