| Param | Original file | Final file |
|---|---|---|
| Filename | modeM0/AS1P01_118T02_9000000022_00218cztM0_level2.evt | modeM0/AS1P01_118T02_9000000022_00218cztM0_level2_quad_clean.evt |
| Size (bytes) | 851,250,240 | 60,419,520 |
| Size | 811.8 MB | 57.6 MB |
| Events in quadrant A | 6,534,522 | 365,811 |
| Events in quadrant B | 6,686,536 | 366,885 |
| Events in quadrant C | 5,941,836 | 357,399 |
| Events in quadrant D | 6,245,519 | 348,383 |
| Mode M0 | |||
|---|---|---|---|
| Quadrant | BADHDUFLAG | Total packets | Discarded packets |
| A | 0 | 23369 | 2 |
| B | 0 | 23803 | 1 |
| C | 0 | 21670 | 1 |
| D | 0 | 22537 | 1 |
| Mode SS | |||
|---|---|---|---|
| Quadrant | BADHDUFLAG | Total packets | Discarded packets |
| A | 0 | 114 | 0 |
| B | 0 | 114 | 0 |
| C | 0 | 114 | 0 |
| D | 0 | 114 | 0 |
| Mode M9 | |||
|---|---|---|---|
| Quadrant | BADHDUFLAG | Total packets | Discarded packets |
| A | 0 | 17 | 0 |
| B | 0 | 17 | 0 |
| C | 0 | 17 | 0 |
| D | 0 | 17 | 0 |
| Quadrant | Total seconds | Saturated seconds | Saturation percentage |
|---|---|---|---|
| A | 5585 | 4 | 0.071620% |
| B | 5585 | 4 | 0.071620% |
| C | 5585 | 1 | 0.017905% |
| D | 5585 | 42 | 0.752014% |
Noise dominated data is calculated using 1-second bins in cleaned event files. If a bin has >2000 counts, and if more than 50% of those come from <1% of pixels, then it is considered to be noise-dominated and hence unusable.
| Quadrant | # 1 sec bins | Bins with >0 counts | Bins with >2000 counts | High rate bins dominated by noise | Noise dominated (total time) | Noise dominated (detector-on time) | Marked lightcurve |
|---|---|---|---|---|---|---|---|
| A | 7291 | 5586 | 151 | 151 | 2.07% | 2.70% | 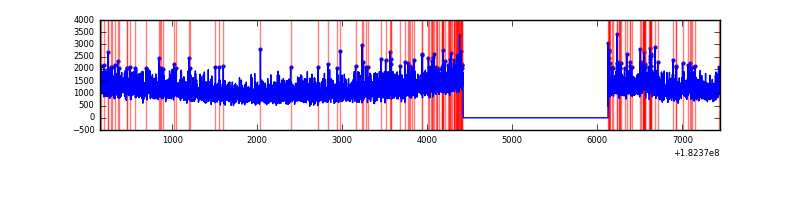 |
| B | 7291 | 5586 | 105 | 105 | 1.44% | 1.88% | 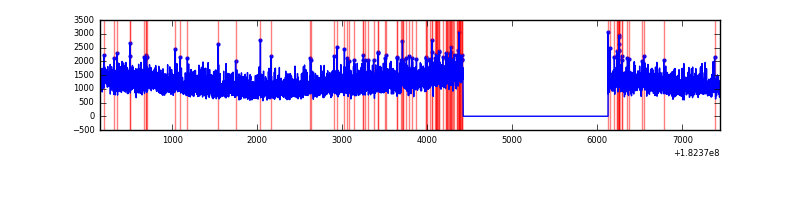 |
| C | 7291 | 5586 | 53 | 53 | 0.73% | 0.95% | 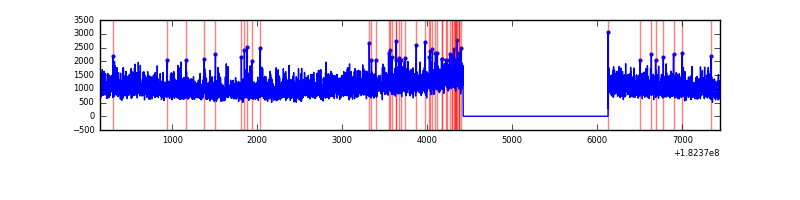 |
| D | 7291 | 5586 | 139 | 139 | 1.91% | 2.49% | 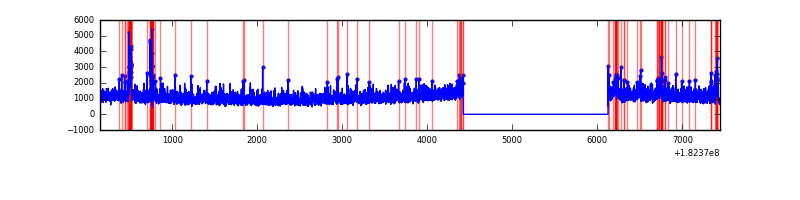 |
Top three noisy pixels from each quadrant. If the there are fewer than three noisy pixels in the level2.evt file, extra rows are filled as -1
| Pixel properties | Quadrant properties | ||||||
|---|---|---|---|---|---|---|---|
| Quadrant | DetID | PixID | Counts | Sigma | Mean | Median | Sigma |
| A | 12 | 149 | 48952 | 131.25 | 1645 | 1631 | 360.6 |
| A | 0 | 253 | 45761 | 122.4 | 1645 | 1631 | 360.6 |
| A | 5 | 244 | 44795 | 119.72 | 1645 | 1631 | 360.6 |
| B | 5 | 46 | 333410 | 871.91 | 1646 | 1658 | 380.5 |
| B | 15 | 219 | 33720 | 84.27 | 1646 | 1658 | 380.5 |
| B | 2 | 253 | 22910 | 55.85 | 1646 | 1658 | 380.5 |
| C | 1 | 1 | 11307 | 23.29 | 1504 | 1562 | 418.4 |
| C | 9 | 63 | 10804 | 22.09 | 1504 | 1562 | 418.4 |
| C | 1 | 192 | 10261 | 20.79 | 1504 | 1562 | 418.4 |
| D | 1 | 4 | 368063 | 809.29 | 1456 | 1517 | 452.9 |
| D | 2 | 85 | 156772 | 342.79 | 1456 | 1517 | 452.9 |
| D | 13 | 117 | 37813 | 80.14 | 1456 | 1517 | 452.9 |
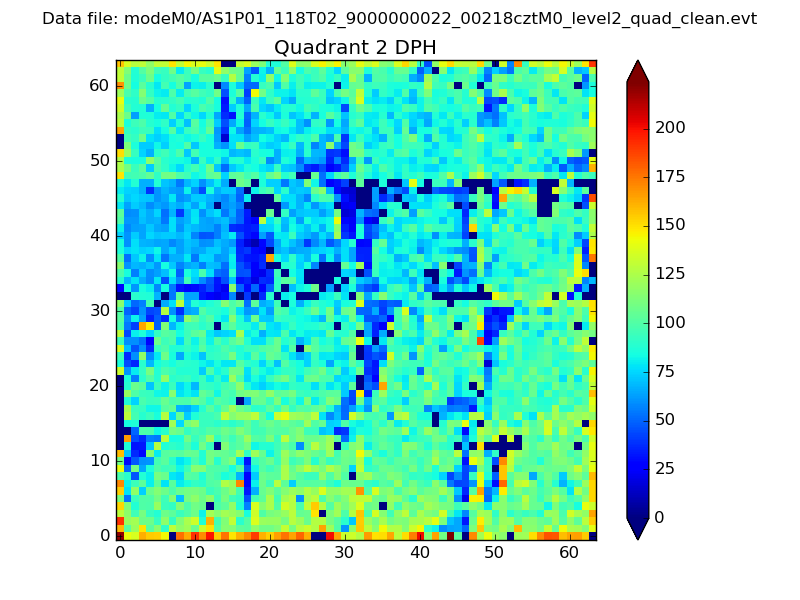
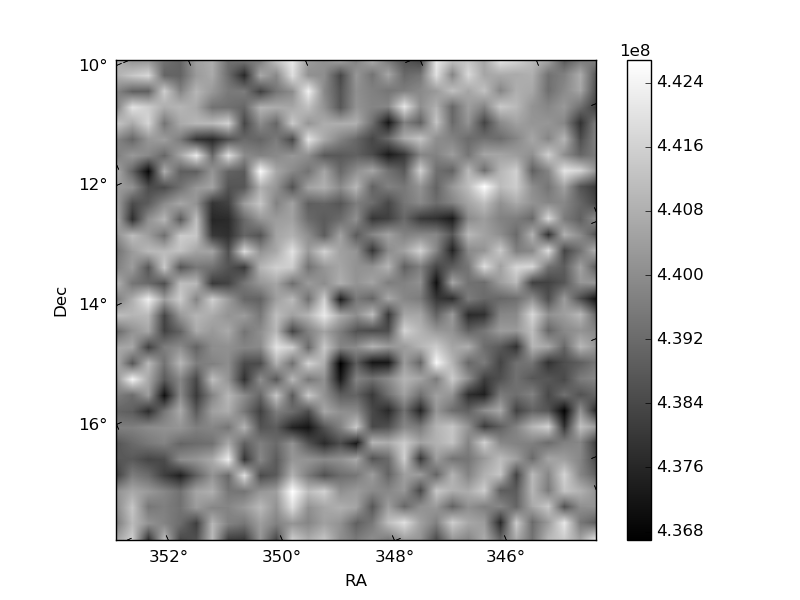
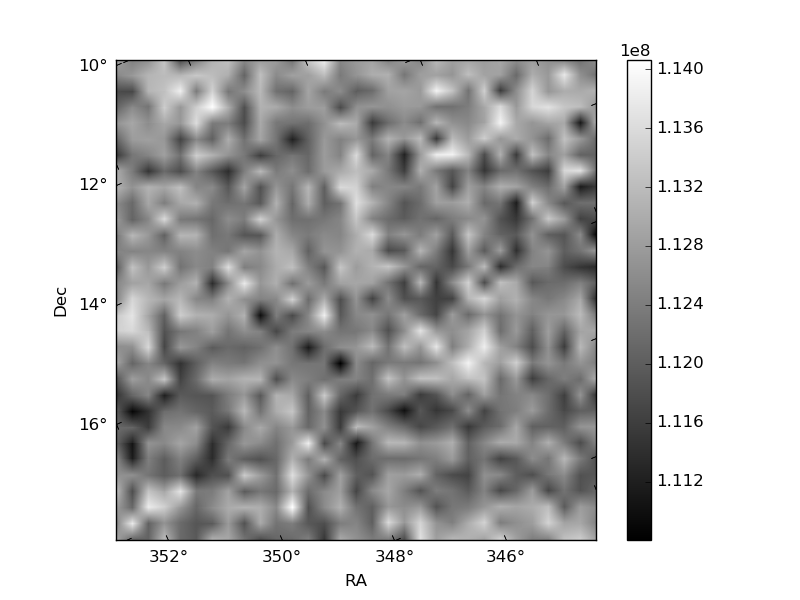
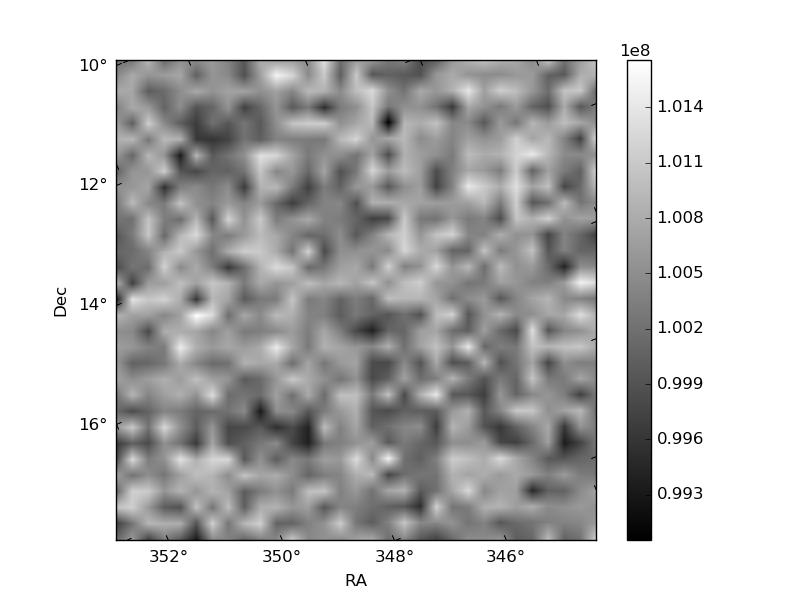
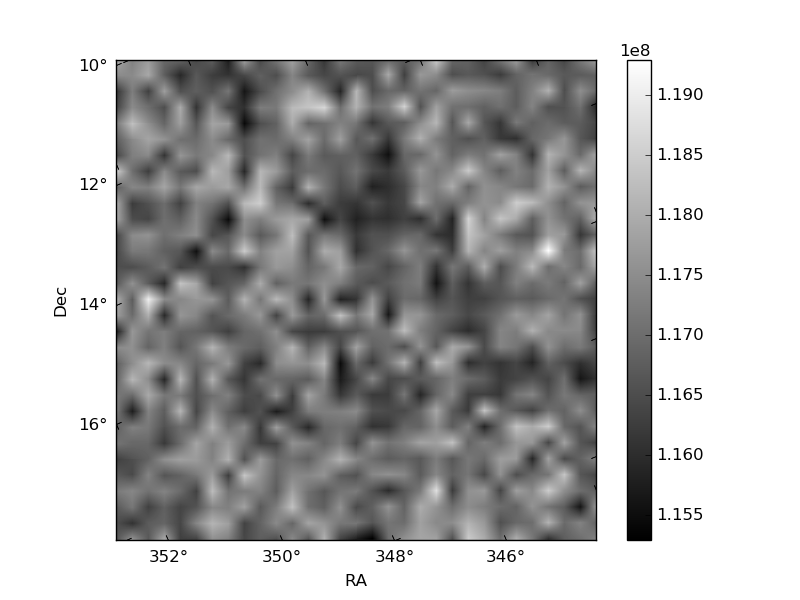
Histogram calculated using DETX and DETY for each event in the final _common_clean file
| Quadrant A | 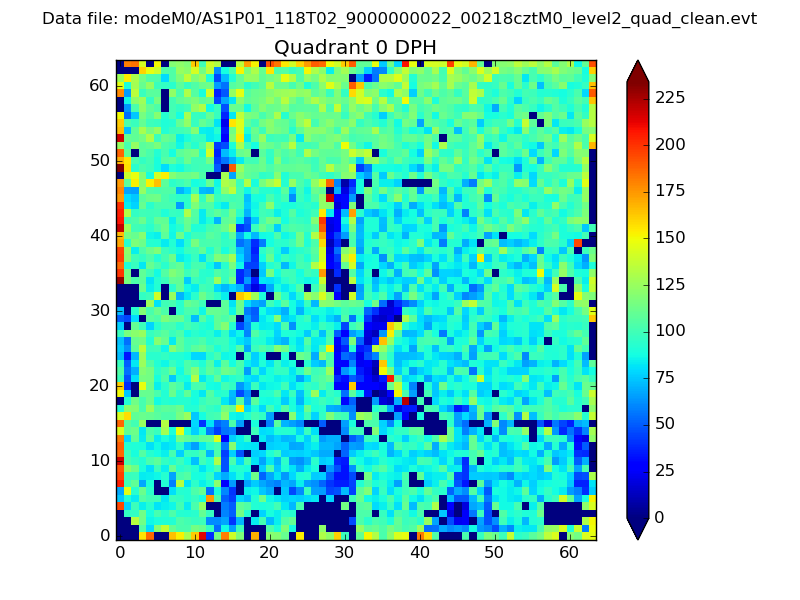 |
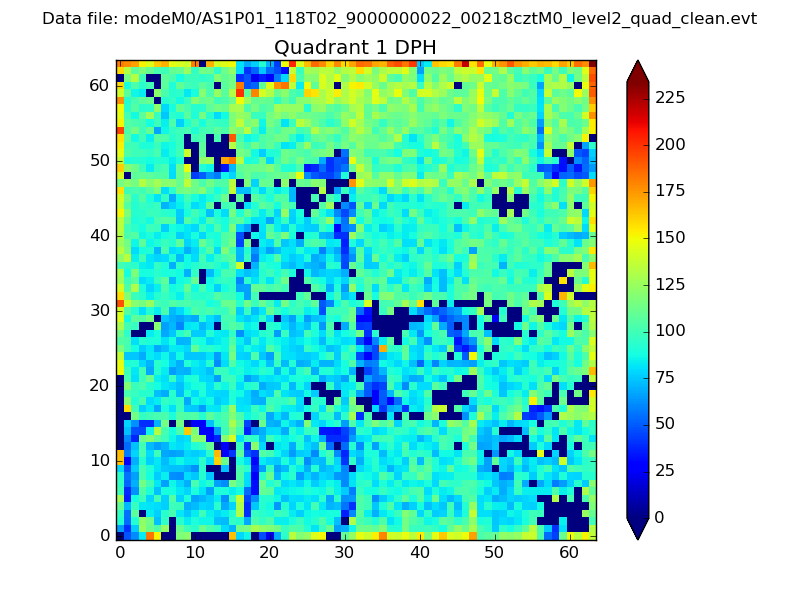 |
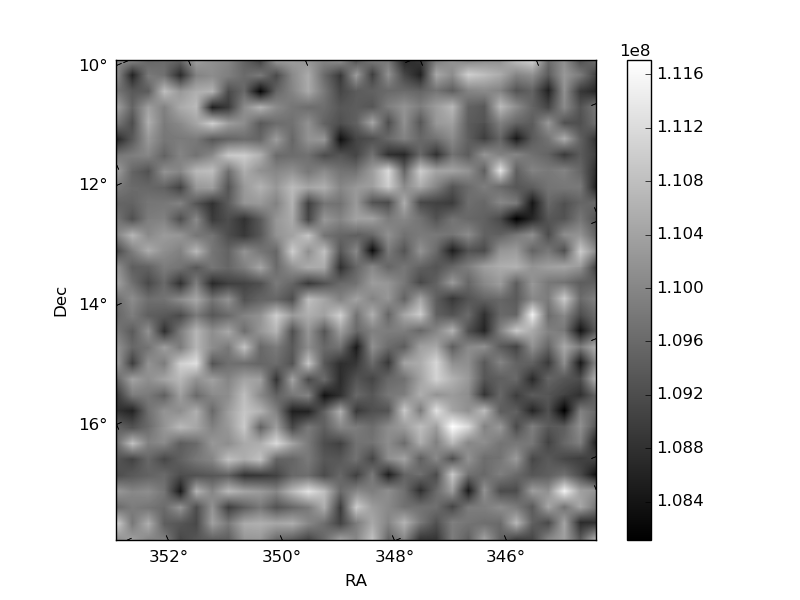
Quadrant B |
|---|---|---|---|
| Quadrant D | 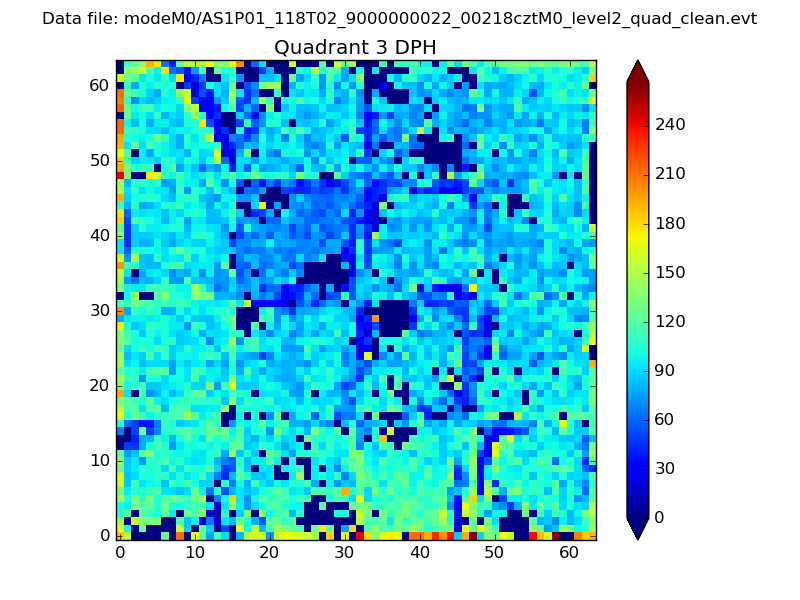 |
 |
Quadrant C |
| Plot type | Count rate plots | Images |
|---|---|---|
| Comparison with Poisson distribution Blue bars denote a histogram of data divided into 1 sec bins. Red curve is a Poisson curve with rate = median count rate of data. |
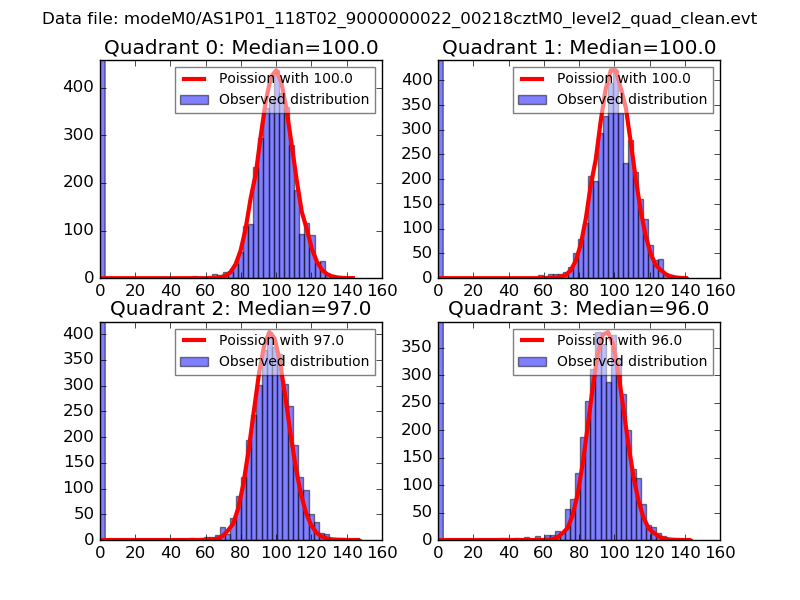 |
 |
| Quadrant-wise count rates Data is divided into 100 sec bins |
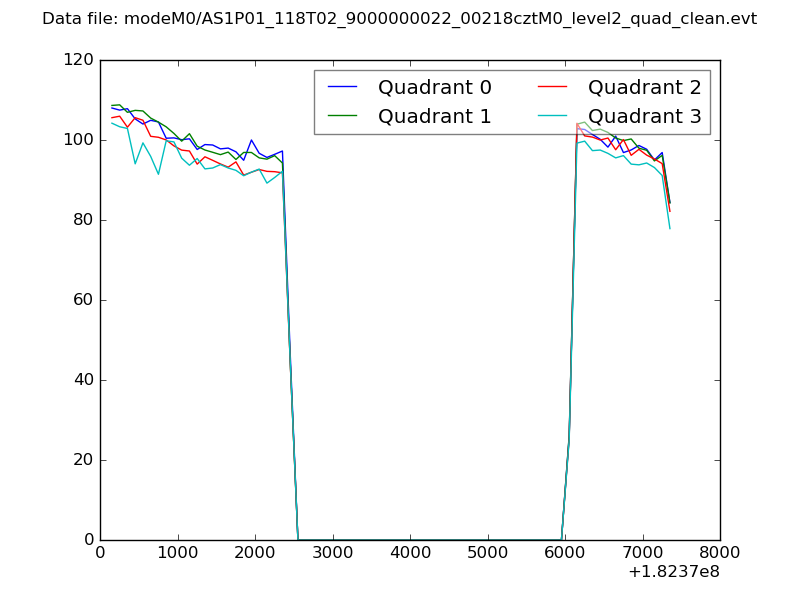 |
|
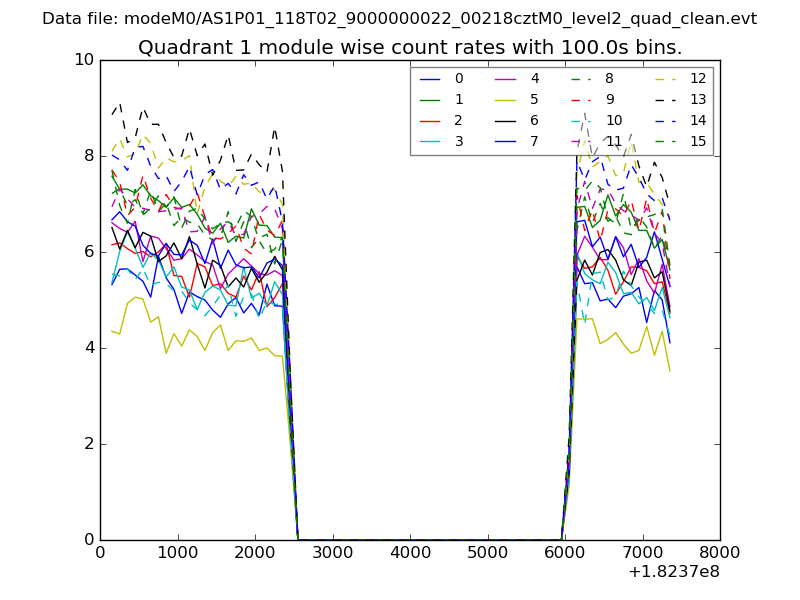
| Module-wise count rates for Quadrant A Data is divided into 100 sec bins |
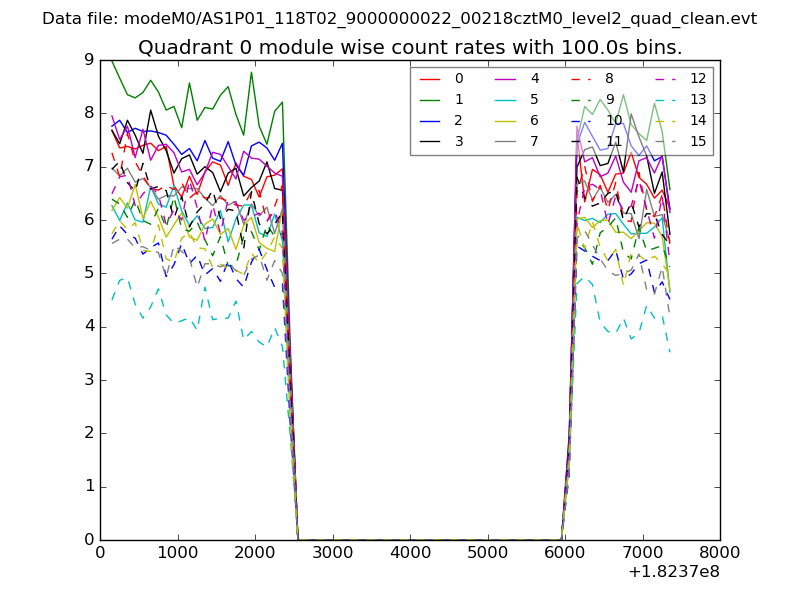 |
 |
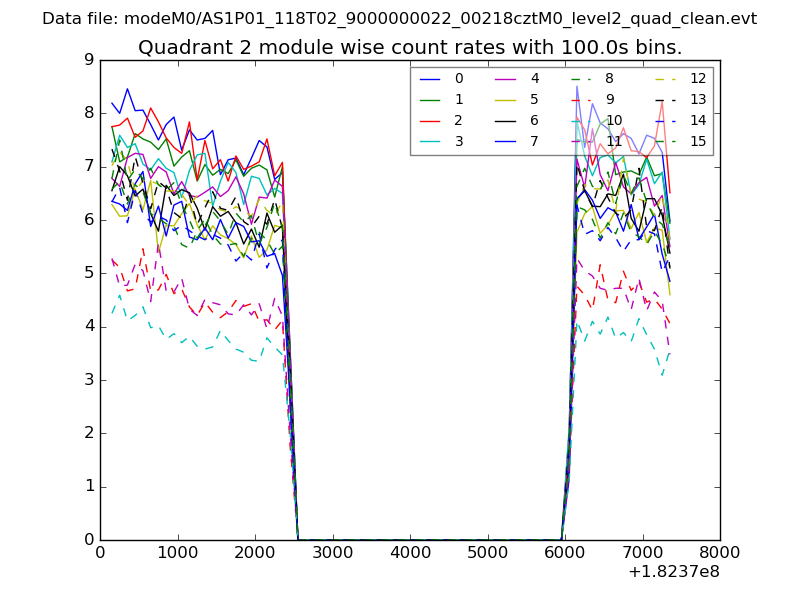
| Module-wise count rates for Quadrant B Data is divided into 100 sec bins |
 |
 |
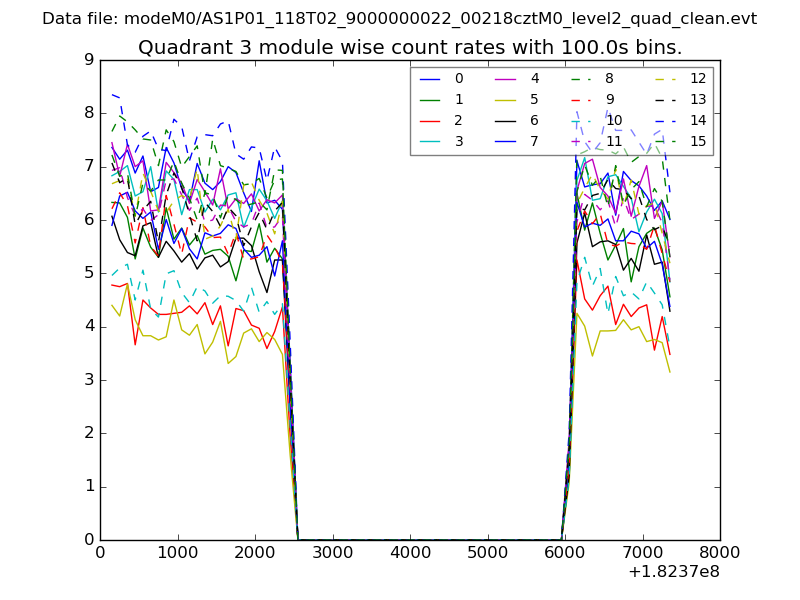
| Module-wise count rates for Quadrant C Data is divided into 100 sec bins |
 |
 |
| Module-wise count rates for Quadrant D Data is divided into 100 sec bins |
 |
 |
| Parameter | Plot |
|---|---|
| CZT HV Monitor | 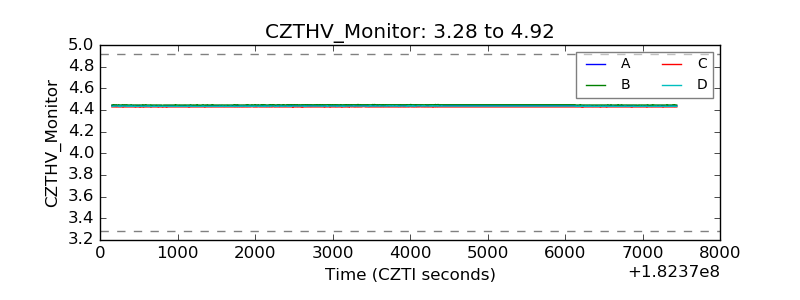 |
| D_VDD | 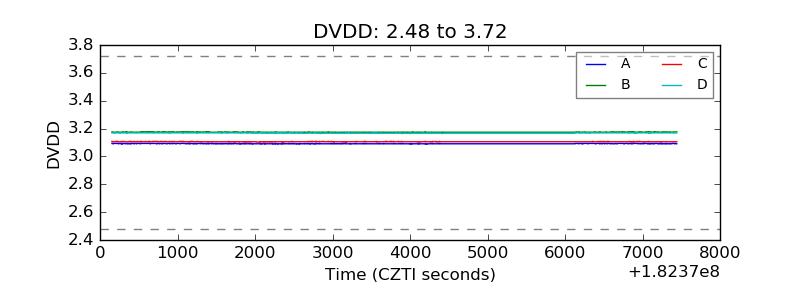 |
| Temperature 1 | 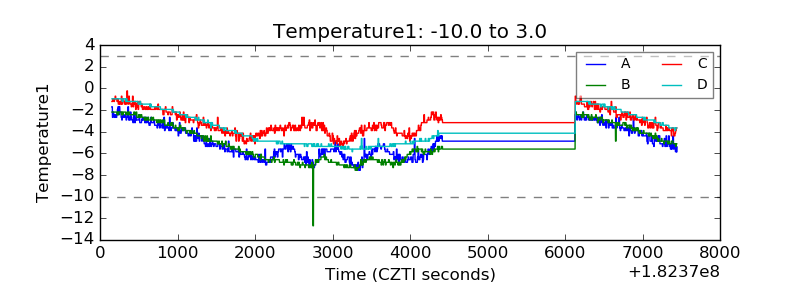 |
| Veto HV Monitor | 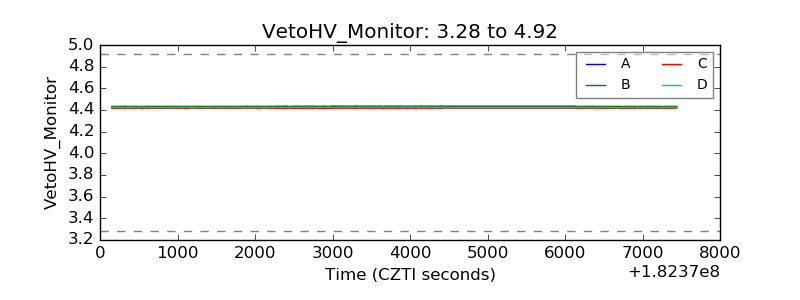 |
| Veto LLD | 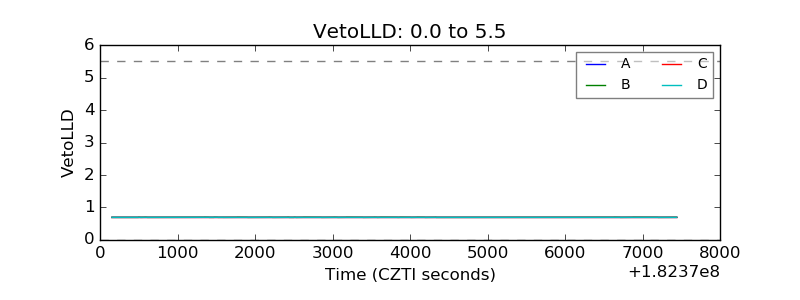 |
| Alpha Counter | 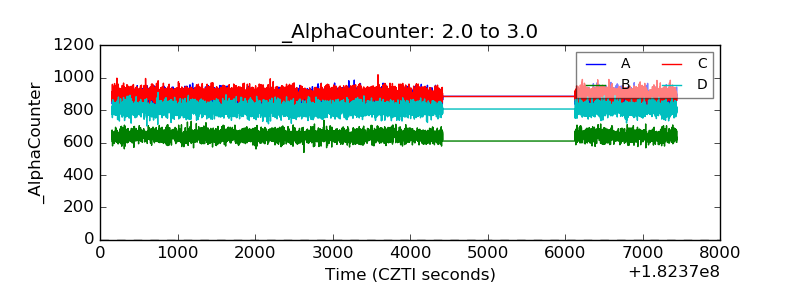 |
| _CPM_Rate | 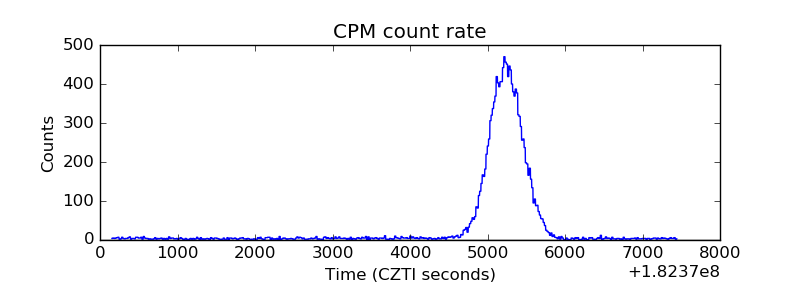 |
| CZT Counter | 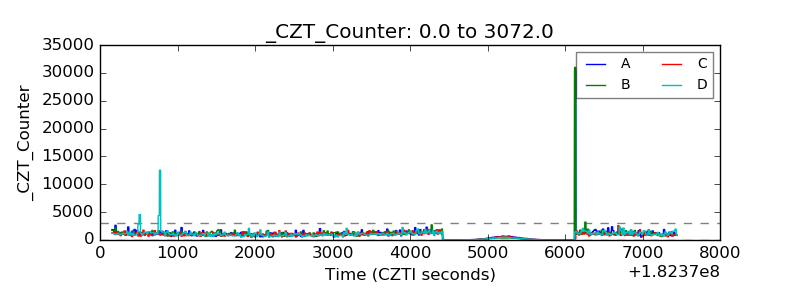 |
| +2.5 Volts monitor |  |
| +5 Volts monitor |  |
| _ROLL_ROT | 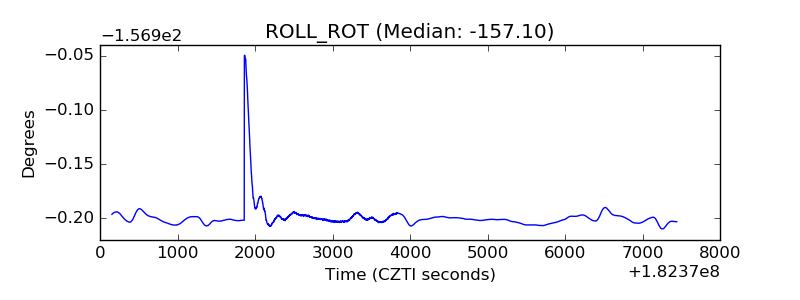 |
| _Roll_DEC | 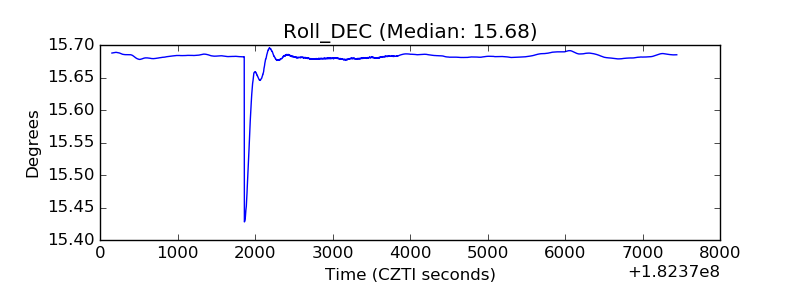 |
| _Roll_RA | 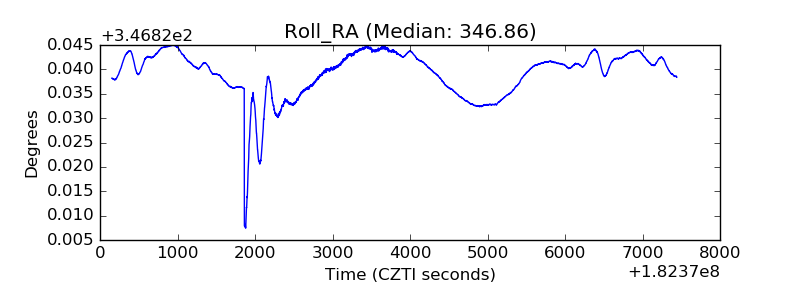 |
| Veto Counter | 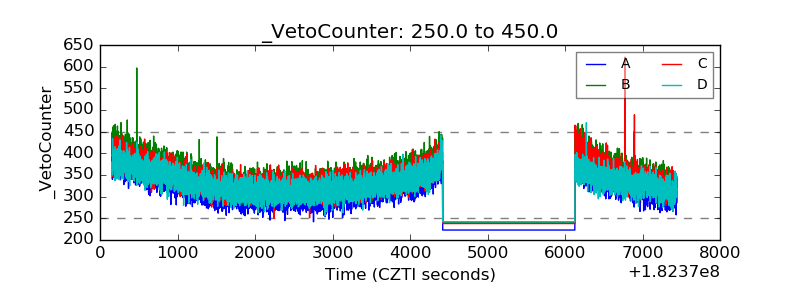 |