| Param | Original file | Final file |
|---|---|---|
| Filename | modeM0/AS1P01_118T02_9000000022_00220cztM0_level2.evt | modeM0/AS1P01_118T02_9000000022_00220cztM0_level2_quad_clean.evt |
| Size (bytes) | 835,755,840 | 50,149,440 |
| Size | 797.0 MB | 47.8 MB |
| Events in quadrant A | 6,451,918 | 288,410 |
| Events in quadrant B | 6,150,024 | 290,464 |
| Events in quadrant C | 5,755,059 | 286,346 |
| Events in quadrant D | 6,596,977 | 277,119 |
| Mode M0 | |||
|---|---|---|---|
| Quadrant | BADHDUFLAG | Total packets | Discarded packets |
| A | 0 | 22948 | 2 |
| B | 0 | 22081 | 1 |
| C | 0 | 20895 | 1 |
| D | 0 | 23394 | 1 |
| Mode SS | |||
|---|---|---|---|
| Quadrant | BADHDUFLAG | Total packets | Discarded packets |
| A | 0 | 110 | 0 |
| B | 0 | 110 | 0 |
| C | 0 | 110 | 0 |
| D | 0 | 110 | 0 |
| Mode M9 | |||
|---|---|---|---|
| Quadrant | BADHDUFLAG | Total packets | Discarded packets |
| A | 0 | 17 | 0 |
| B | 0 | 17 | 0 |
| C | 0 | 17 | 0 |
| D | 0 | 17 | 0 |
| Quadrant | Total seconds | Saturated seconds | Saturation percentage |
|---|---|---|---|
| A | 5362 | 2 | 0.037300% |
| B | 5362 | 2 | 0.037300% |
| C | 5362 | 3 | 0.055949% |
| D | 5362 | 41 | 0.764640% |
Noise dominated data is calculated using 1-second bins in cleaned event files. If a bin has >2000 counts, and if more than 50% of those come from <1% of pixels, then it is considered to be noise-dominated and hence unusable.
| Quadrant | # 1 sec bins | Bins with >0 counts | Bins with >2000 counts | High rate bins dominated by noise | Noise dominated (total time) | Noise dominated (detector-on time) | Marked lightcurve |
|---|---|---|---|---|---|---|---|
| A | 7067 | 5363 | 140 | 140 | 1.98% | 2.61% |  |
| B | 7067 | 5363 | 57 | 57 | 0.81% | 1.06% | 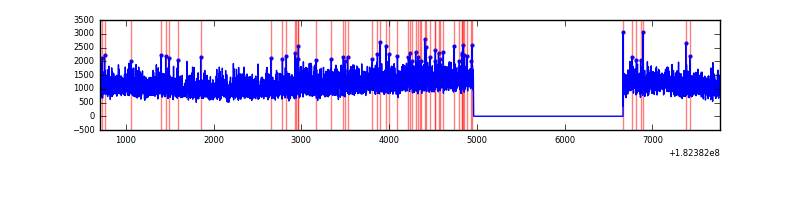 |
| C | 7067 | 5363 | 40 | 40 | 0.57% | 0.75% | 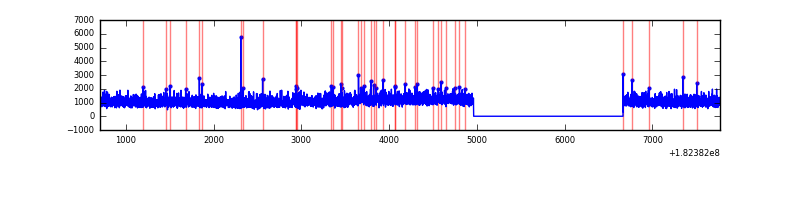 |
| D | 7067 | 5363 | 260 | 260 | 3.68% | 4.85% | 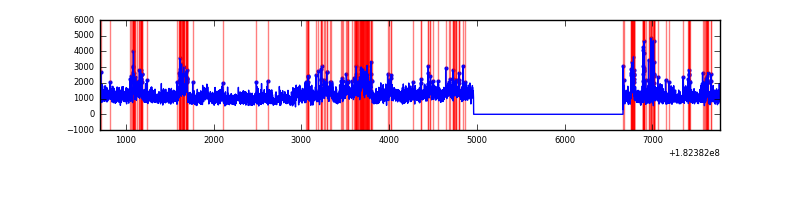 |
Top three noisy pixels from each quadrant. If the there are fewer than three noisy pixels in the level2.evt file, extra rows are filled as -1
| Pixel properties | Quadrant properties | ||||||
|---|---|---|---|---|---|---|---|
| Quadrant | DetID | PixID | Counts | Sigma | Mean | Median | Sigma |
| A | 5 | 244 | 400448 | 1173.61 | 1547 | 1534 | 339.9 |
| A | 0 | 253 | 21848 | 59.76 | 1547 | 1534 | 339.9 |
| A | 0 | 96 | 19327 | 52.35 | 1547 | 1534 | 339.9 |
| B | 5 | 46 | 139432 | 373.41 | 1570 | 1575 | 369.2 |
| B | 12 | 52 | 7115 | 15.01 | 1570 | 1575 | 369.2 |
| B | 5 | 2 | 7100 | 14.97 | 1570 | 1575 | 369.2 |
| C | 9 | 241 | 35521 | 83.61 | 1447 | 1500 | 406.9 |
| C | 0 | 1 | 14445 | 31.81 | 1447 | 1500 | 406.9 |
| C | 2 | 192 | 9207 | 18.94 | 1447 | 1500 | 406.9 |
| D | 1 | 4 | 1116538 | 2576.73 | 1375 | 1427 | 432.8 |
| D | 9 | 7 | 84347 | 191.61 | 1375 | 1427 | 432.8 |
| D | 2 | 63 | 37978 | 84.46 | 1375 | 1427 | 432.8 |
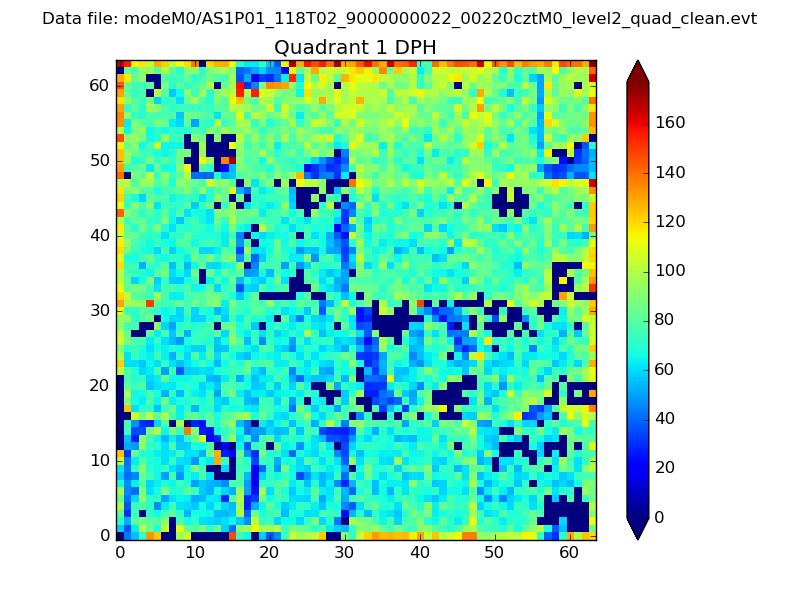
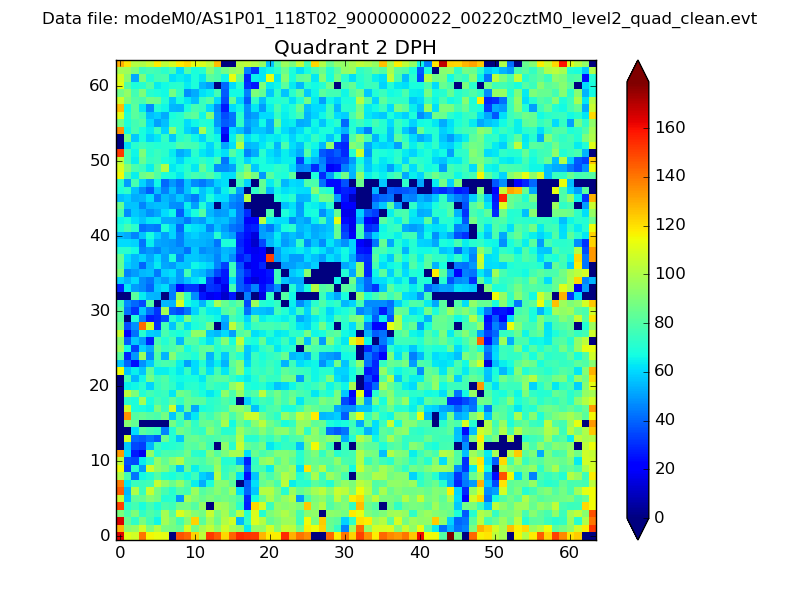
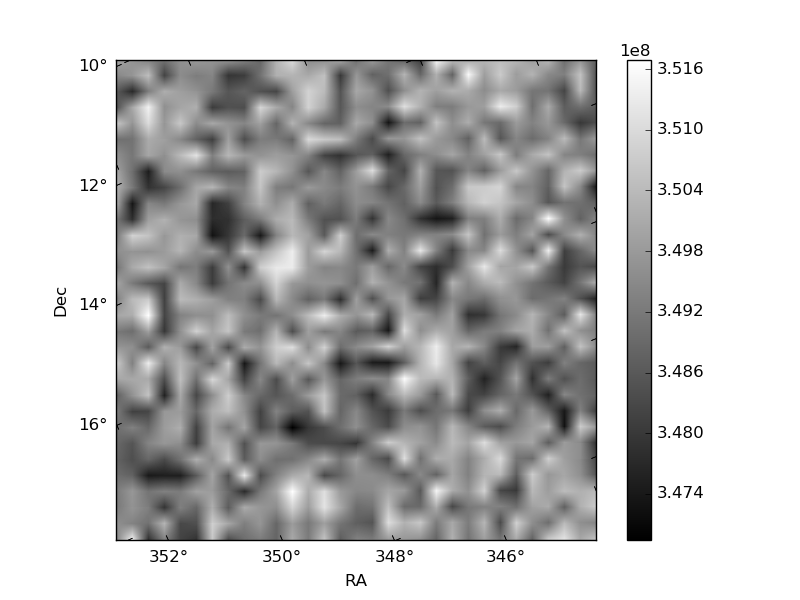
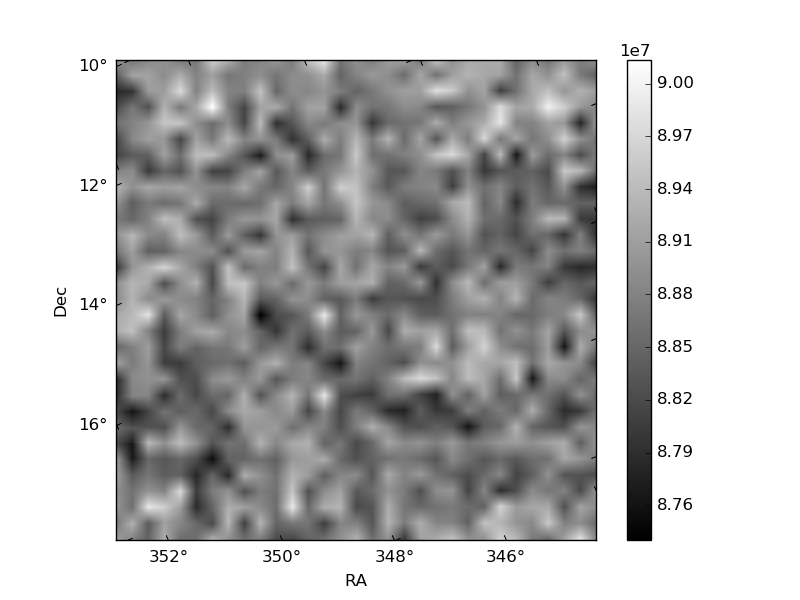
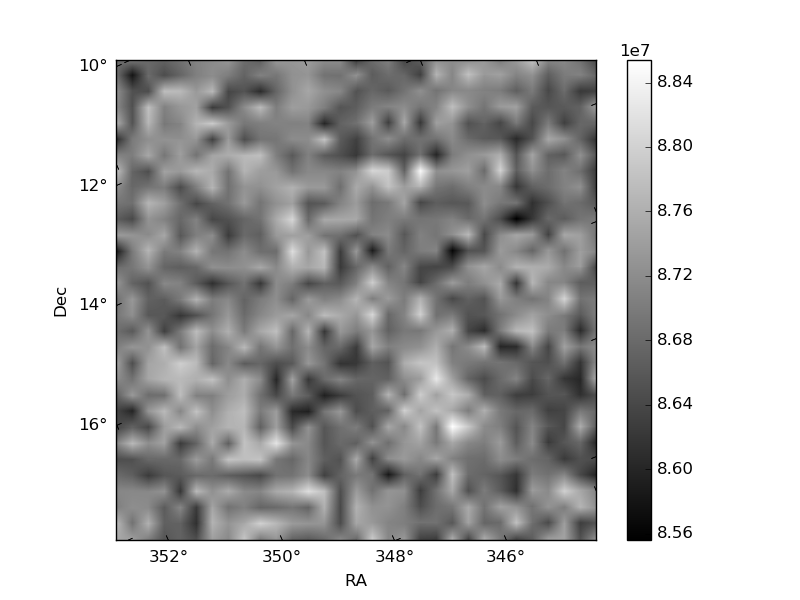
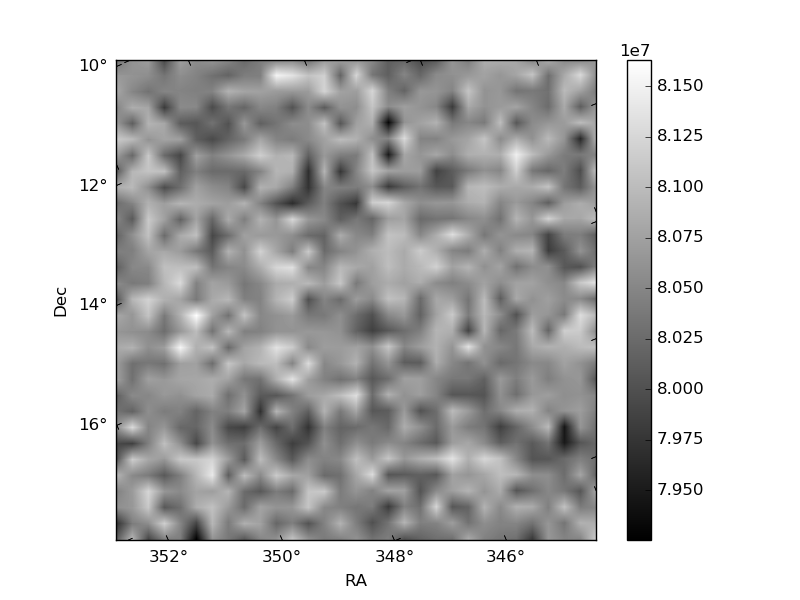
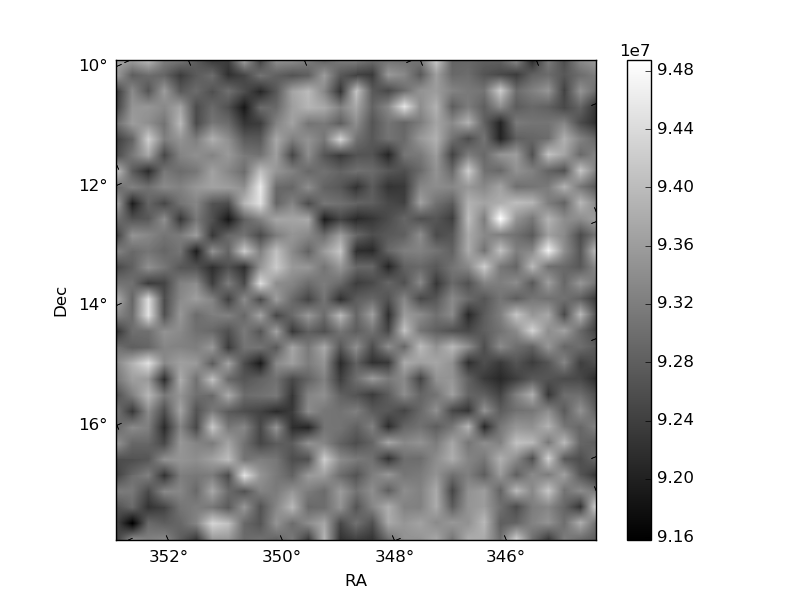
Histogram calculated using DETX and DETY for each event in the final _common_clean file
| Quadrant A | 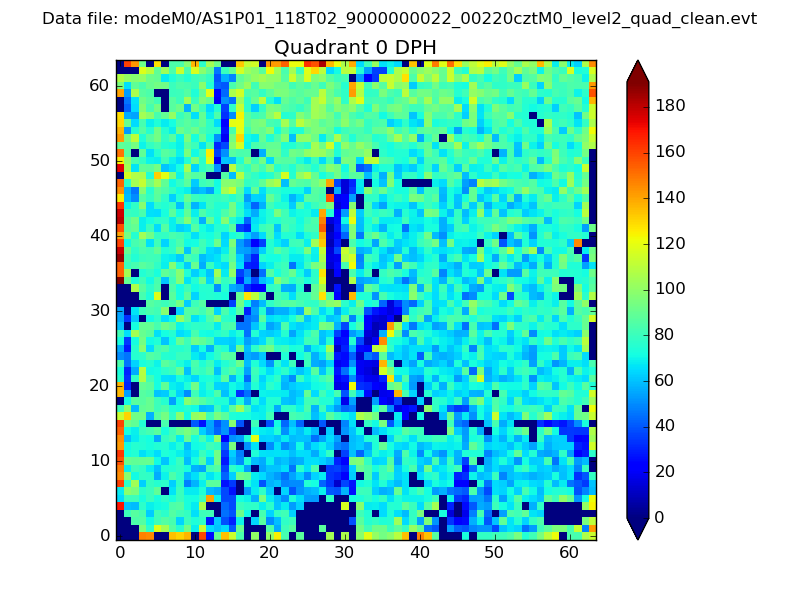 |
 |
Quadrant B |
|---|---|---|---|
| Quadrant D | 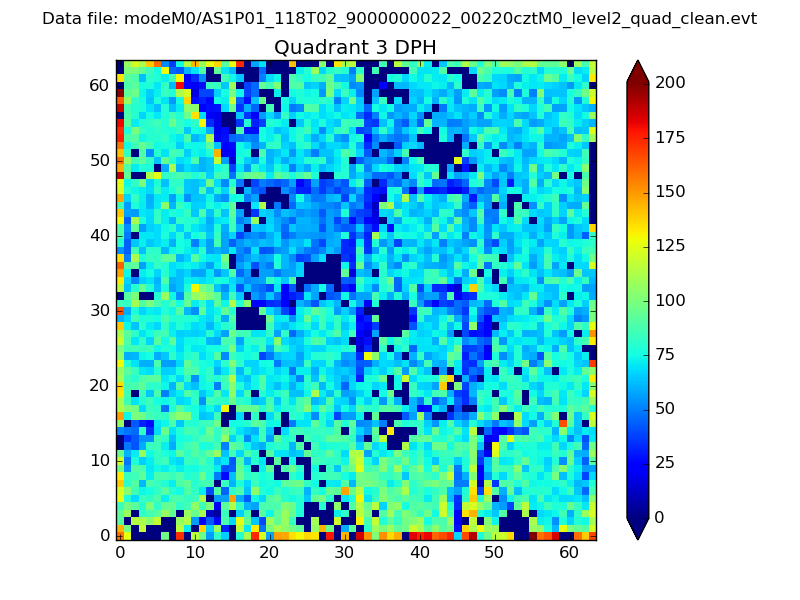 |
 |
Quadrant C |
| Plot type | Count rate plots | Images |
|---|---|---|
| Comparison with Poisson distribution Blue bars denote a histogram of data divided into 1 sec bins. Red curve is a Poisson curve with rate = median count rate of data. |
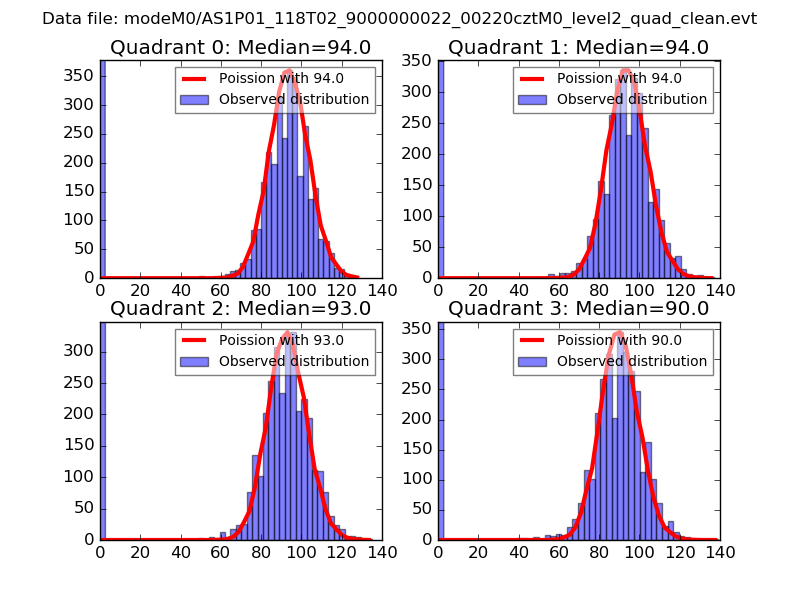 |
 |
| Quadrant-wise count rates Data is divided into 100 sec bins |
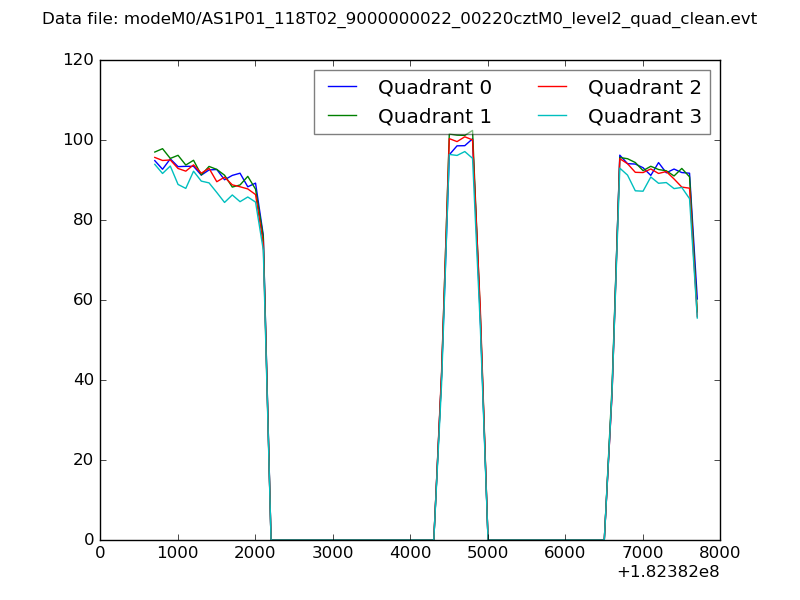 |
|
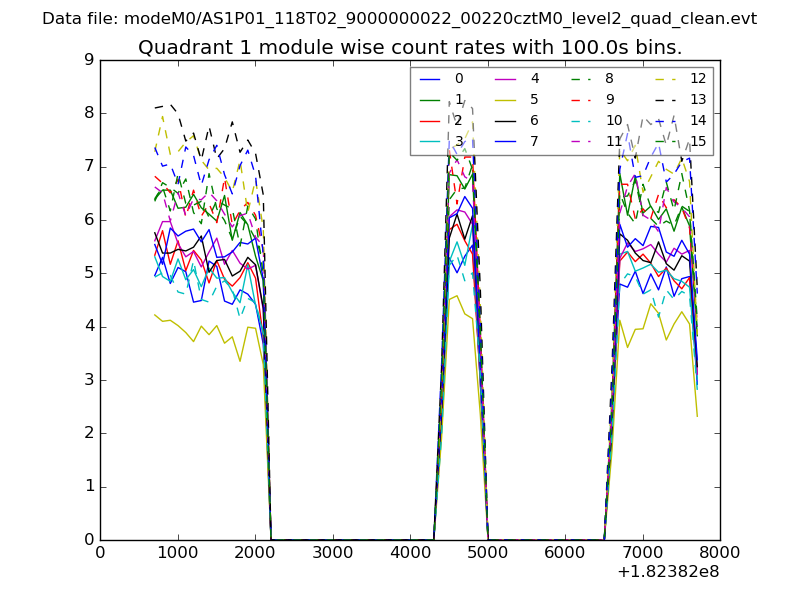
| Module-wise count rates for Quadrant A Data is divided into 100 sec bins |
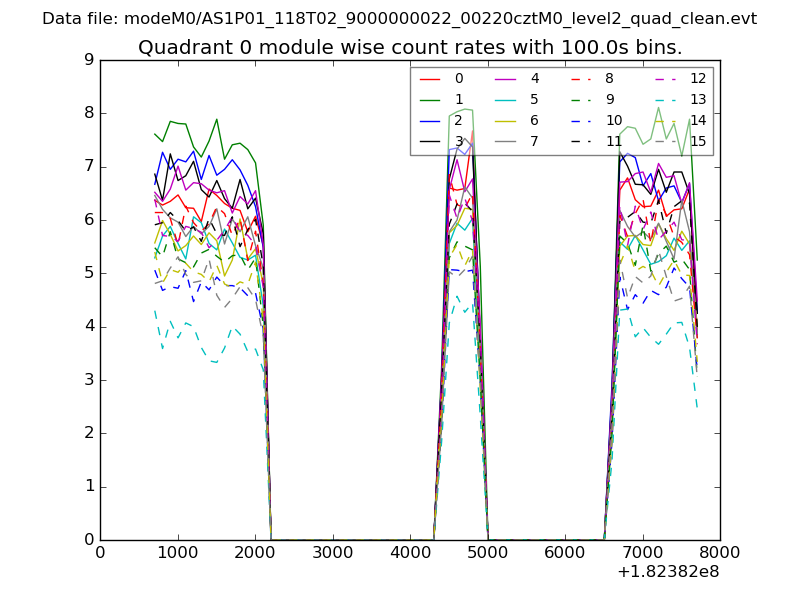 |
 |
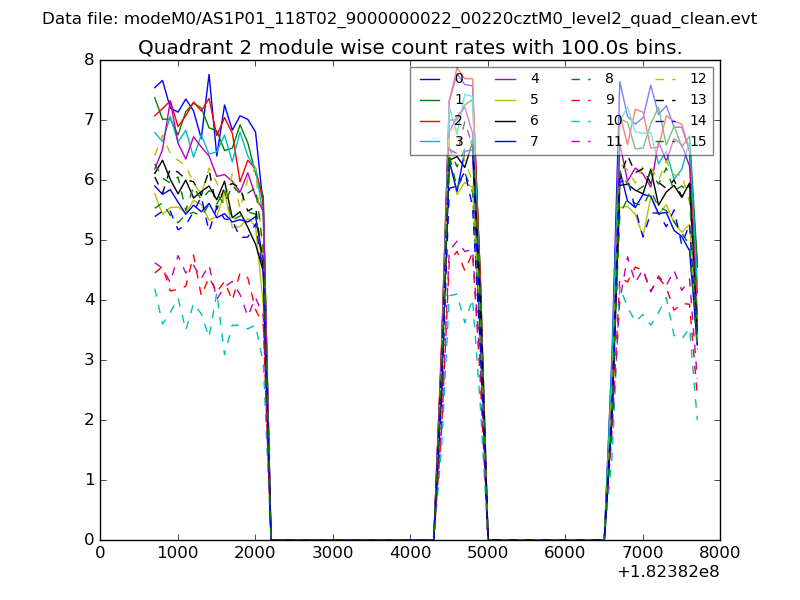
| Module-wise count rates for Quadrant B Data is divided into 100 sec bins |
 |
 |
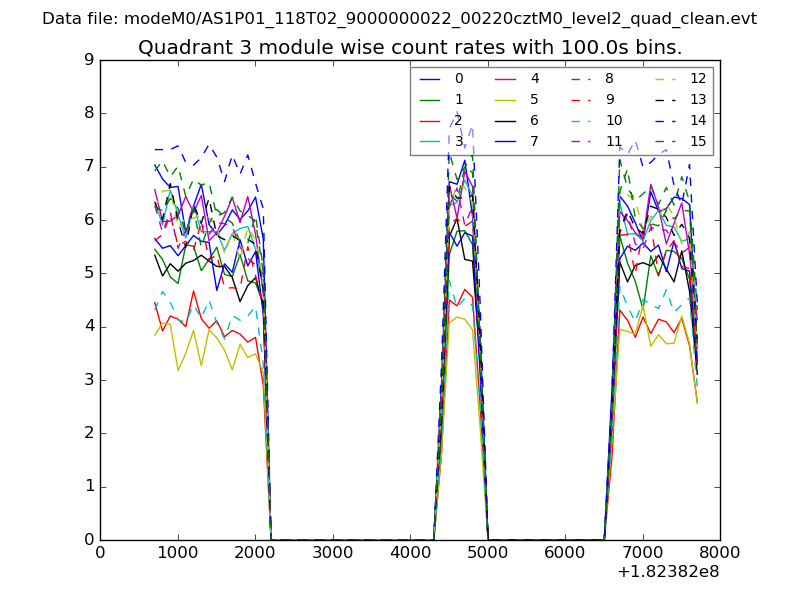
| Module-wise count rates for Quadrant C Data is divided into 100 sec bins |
 |
 |
| Module-wise count rates for Quadrant D Data is divided into 100 sec bins |
 |
 |
| Parameter | Plot |
|---|---|
| CZT HV Monitor | 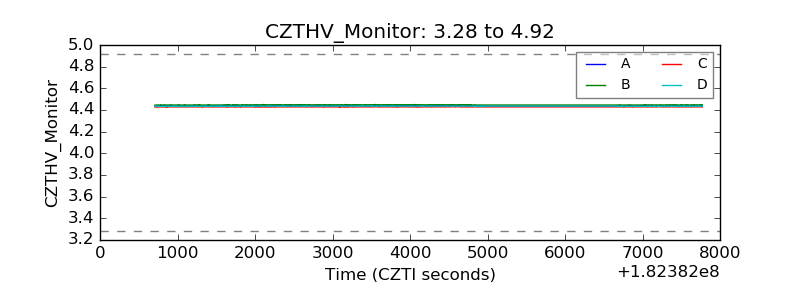 |
| D_VDD | 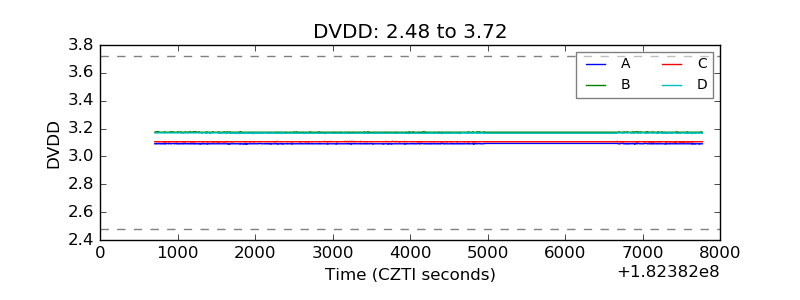 |
| Temperature 1 | 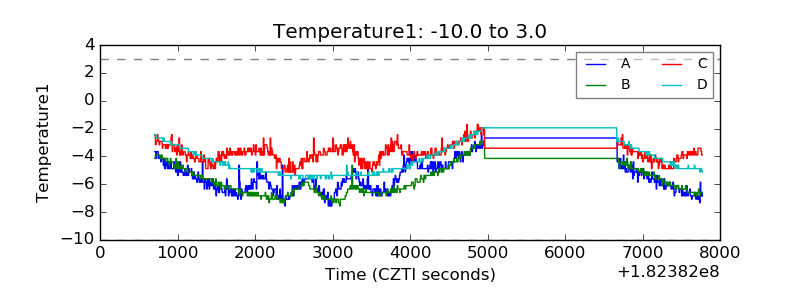 |
| Veto HV Monitor | 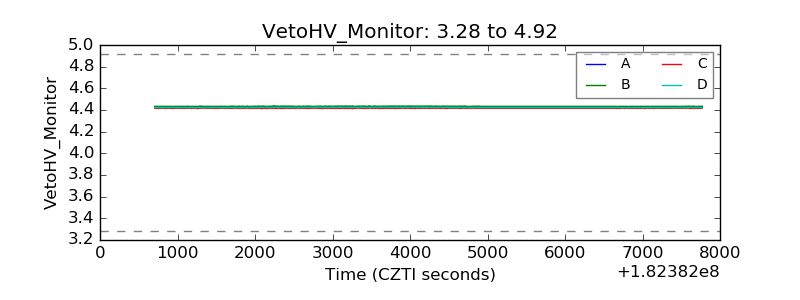 |
| Veto LLD | 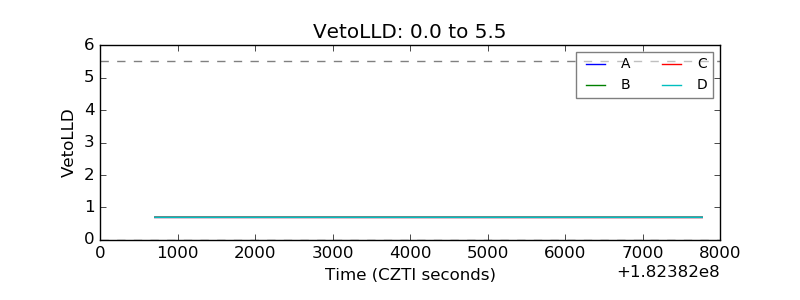 |
| Alpha Counter | 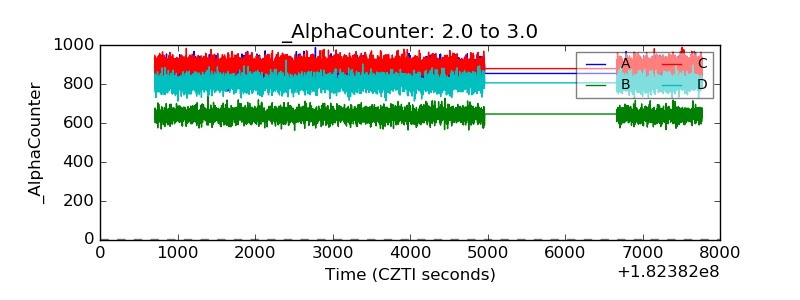 |
| _CPM_Rate | 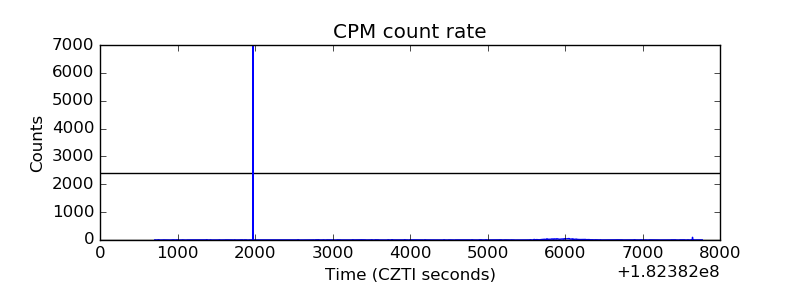 |
| CZT Counter | 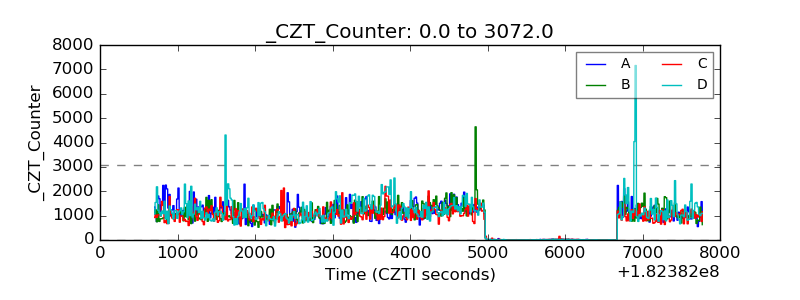 |
| +2.5 Volts monitor |  |
| +5 Volts monitor | 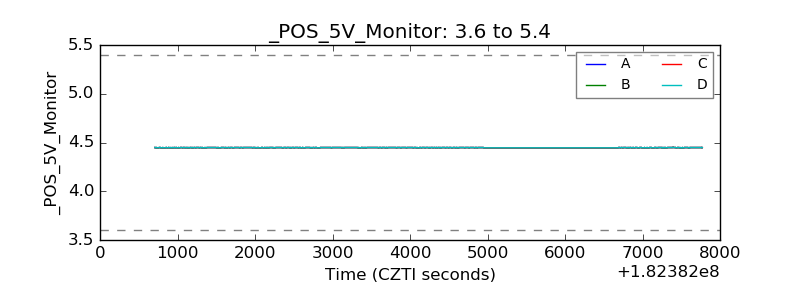 |
| _ROLL_ROT | 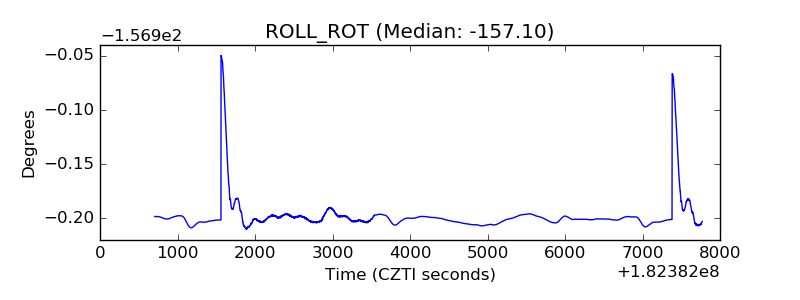 |
| _Roll_DEC | 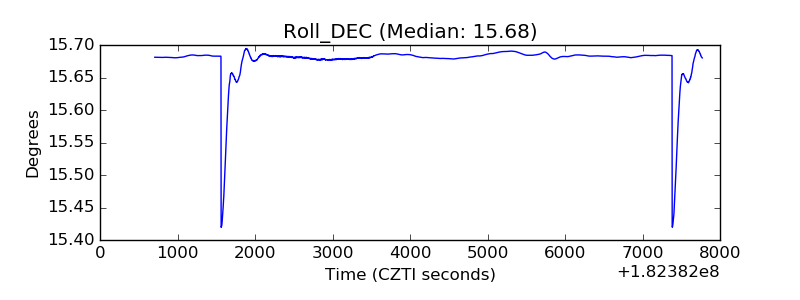 |
| _Roll_RA | 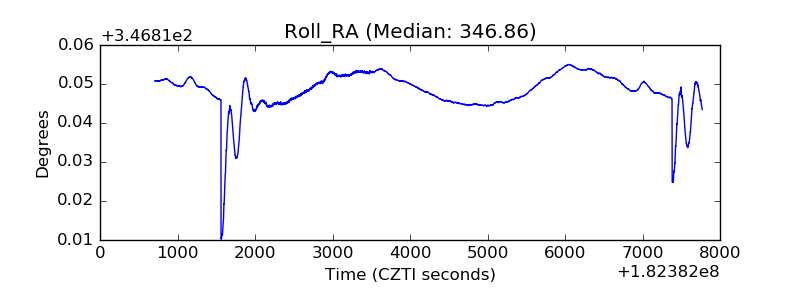 |
| Veto Counter | 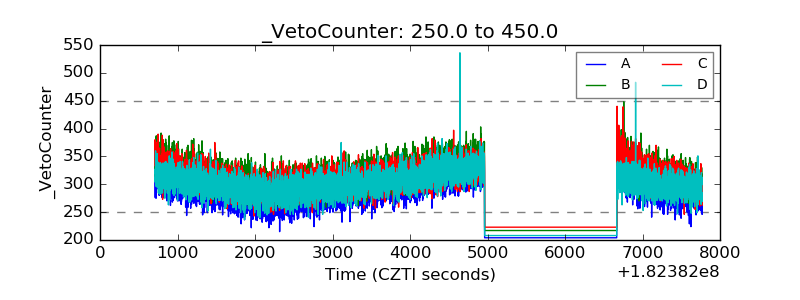 |