| Param | Original file | Final file |
|---|---|---|
| Filename | modeM0/AS1P01_123T01_9000000024_00225cztM0_level2.evt | modeM0/AS1P01_123T01_9000000024_00225cztM0_level2_quad_clean.evt |
| Size (bytes) | 876,988,800 | 74,640,960 |
| Size | 836.4 MB | 71.2 MB |
| Events in quadrant A | 6,538,568 | 477,741 |
| Events in quadrant B | 6,595,614 | 480,412 |
| Events in quadrant C | 5,790,721 | 482,436 |
| Events in quadrant D | 7,288,167 | 453,673 |
| Mode SS | |||
|---|---|---|---|
| Quadrant | BADHDUFLAG | Total packets | Discarded packets |
| A | 0 | 106 | 0 |
| B | 0 | 106 | 0 |
| C | 0 | 106 | 0 |
| D | 0 | 106 | 0 |
| Mode M9 | |||
|---|---|---|---|
| Quadrant | BADHDUFLAG | Total packets | Discarded packets |
| A | 0 | 17 | 0 |
| B | 0 | 17 | 0 |
| C | 0 | 17 | 0 |
| D | 0 | 17 | 0 |
| Mode M0 | |||
|---|---|---|---|
| Quadrant | BADHDUFLAG | Total packets | Discarded packets |
| A | 0 | 23107 | 2 |
| B | 0 | 23329 | 1 |
| C | 0 | 20927 | 1 |
| D | 0 | 25426 | 1 |
| Quadrant | Total seconds | Saturated seconds | Saturation percentage |
|---|---|---|---|
| A | 5225 | 5 | 0.095694% |
| B | 5225 | 25 | 0.478469% |
| C | 5225 | 2 | 0.038278% |
| D | 5225 | 253 | 4.842105% |
Noise dominated data is calculated using 1-second bins in cleaned event files. If a bin has >2000 counts, and if more than 50% of those come from <1% of pixels, then it is considered to be noise-dominated and hence unusable.
| Quadrant | # 1 sec bins | Bins with >0 counts | Bins with >2000 counts | High rate bins dominated by noise | Noise dominated (total time) | Noise dominated (detector-on time) | Marked lightcurve |
|---|---|---|---|---|---|---|---|
| A | 6929 | 5226 | 168 | 168 | 2.42% | 3.21% | 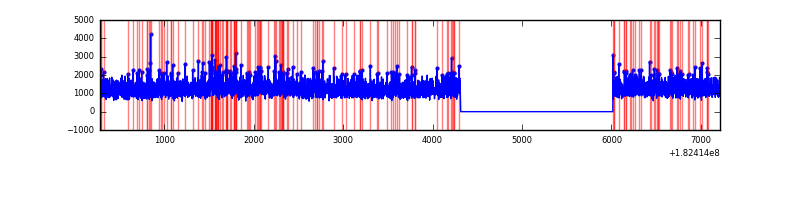 |
| B | 6929 | 5226 | 213 | 213 | 3.07% | 4.08% | 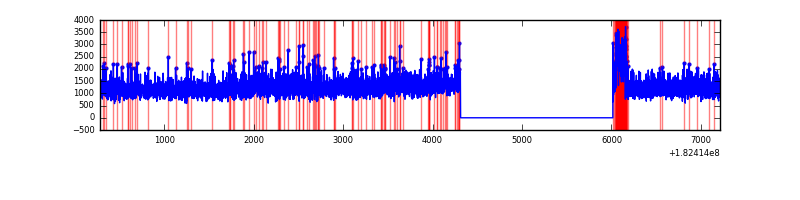 |
| C | 6929 | 5226 | 57 | 57 | 0.82% | 1.09% | 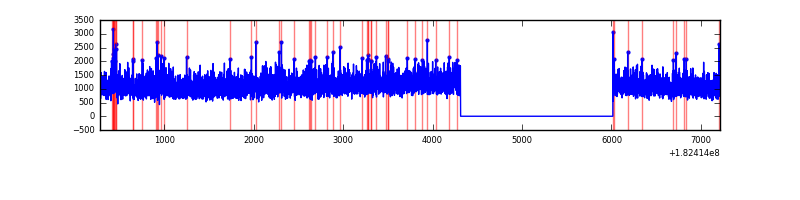 |
| D | 6929 | 5226 | 706 | 706 | 10.19% | 13.51% | 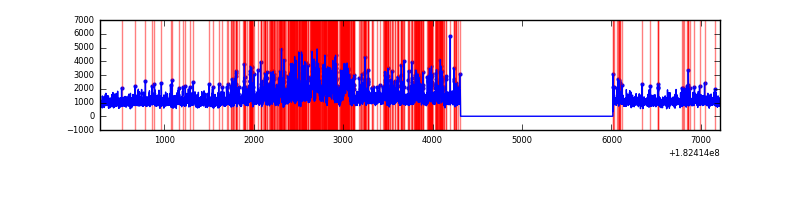 |
Top three noisy pixels from each quadrant. If the there are fewer than three noisy pixels in the level2.evt file, extra rows are filled as -1
| Pixel properties | Quadrant properties | ||||||
|---|---|---|---|---|---|---|---|
| Quadrant | DetID | PixID | Counts | Sigma | Mean | Median | Sigma |
| A | 5 | 244 | 170115 | 463.66 | 1633 | 1612 | 363.4 |
| A | 0 | 253 | 16780 | 41.74 | 1633 | 1612 | 363.4 |
| A | 0 | 6 | 16024 | 39.66 | 1633 | 1612 | 363.4 |
| B | 5 | 46 | 162129 | 422.51 | 1595 | 1607 | 379.9 |
| B | 8 | 6 | 155615 | 405.37 | 1595 | 1607 | 379.9 |
| B | 7 | 220 | 133715 | 347.72 | 1595 | 1607 | 379.9 |
| C | 1 | 1 | 72720 | 173.8 | 1453 | 1505 | 409.7 |
| C | 0 | 186 | 5308 | 9.28 | 1453 | 1505 | 409.7 |
| C | 5 | 234 | 4916 | 8.32 | 1453 | 1505 | 409.7 |
| D | 1 | 4 | 1790085 | 4045.11 | 1402 | 1452 | 442.2 |
| D | 2 | 85 | 60393 | 133.3 | 1402 | 1452 | 442.2 |
| D | 10 | 98 | 17487 | 36.26 | 1402 | 1452 | 442.2 |
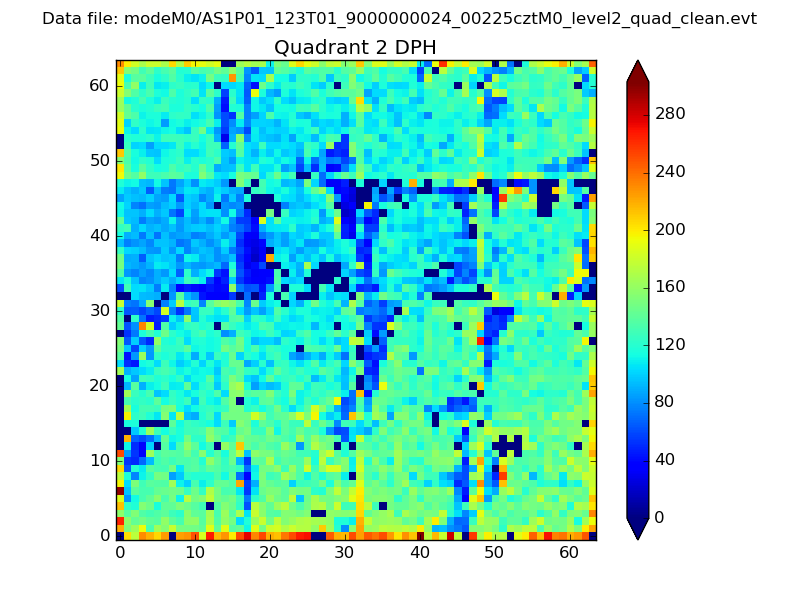
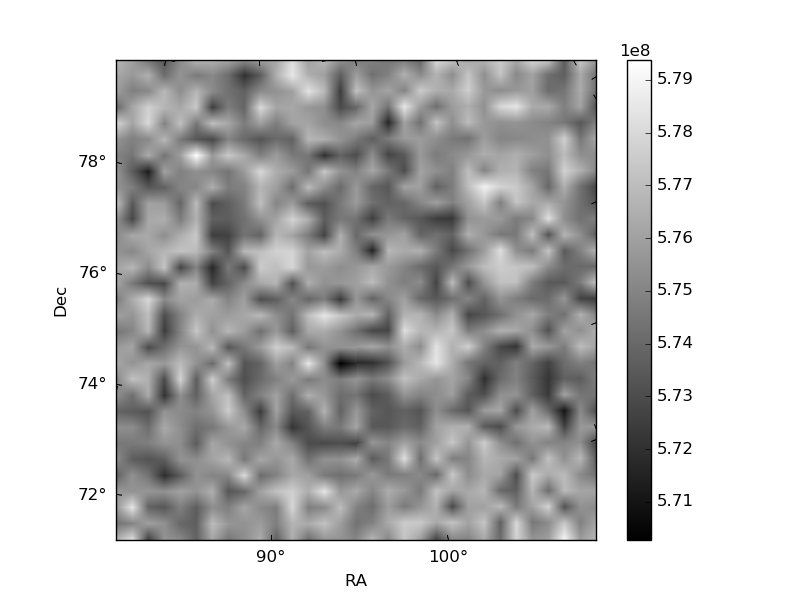
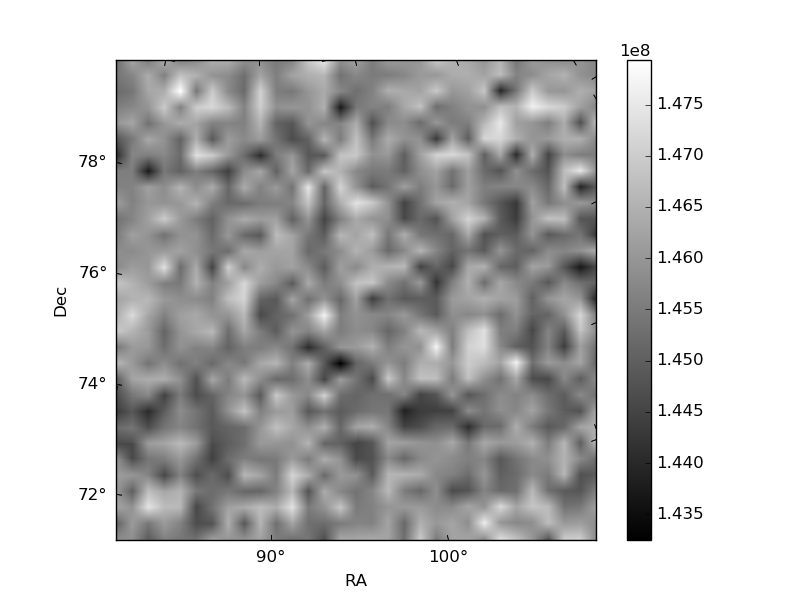
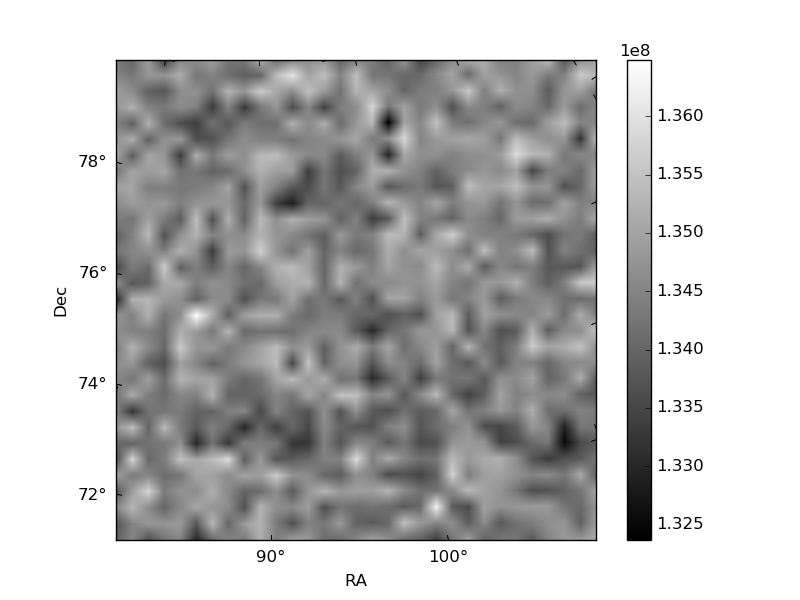
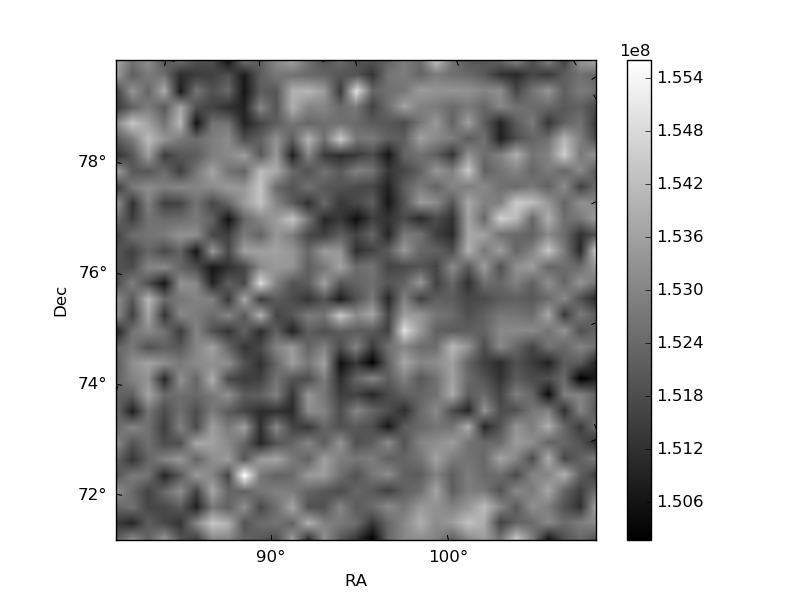
Histogram calculated using DETX and DETY for each event in the final _common_clean file
| Quadrant A | 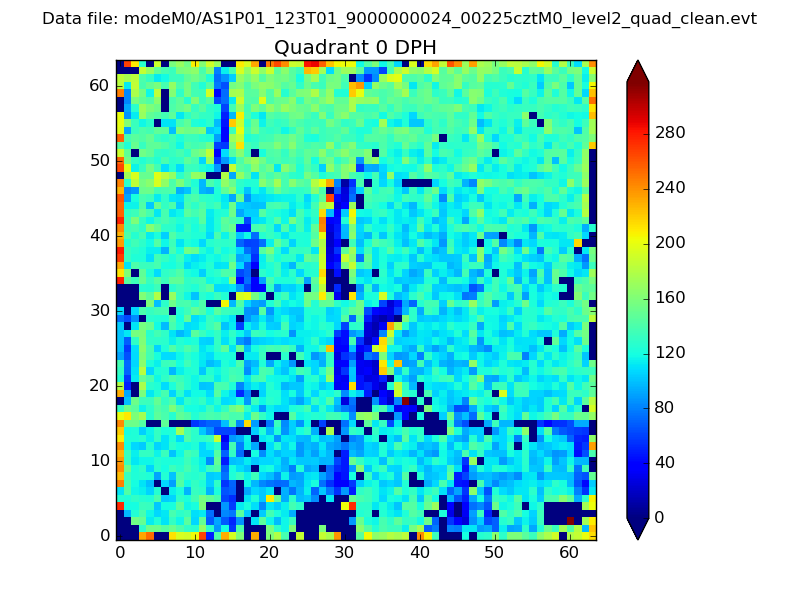 |
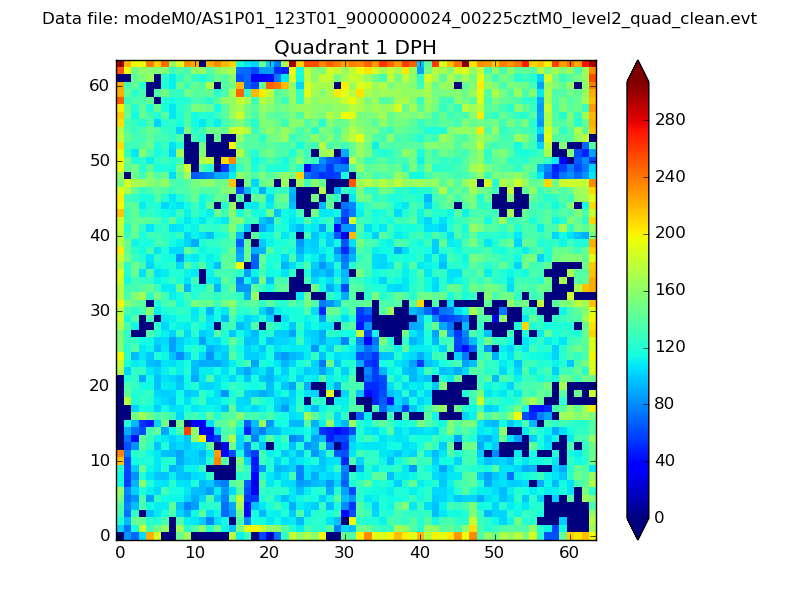 |
Quadrant B |
|---|---|---|---|
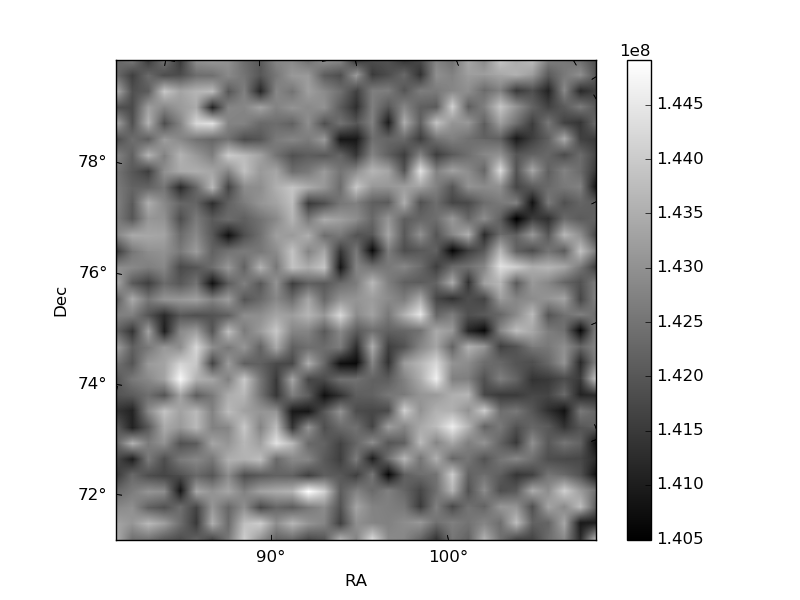
| Quadrant D | 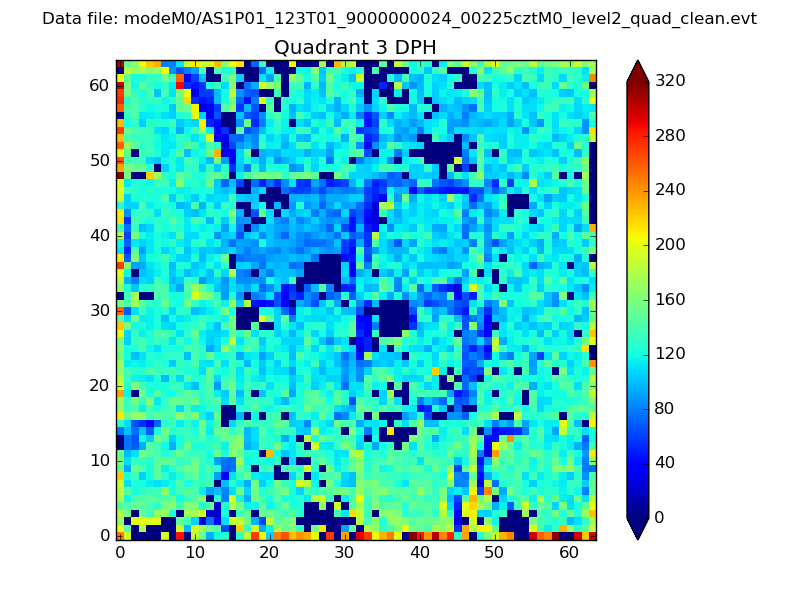 |
 |
Quadrant C |
| Plot type | Count rate plots | Images |
|---|---|---|
| Comparison with Poisson distribution Blue bars denote a histogram of data divided into 1 sec bins. Red curve is a Poisson curve with rate = median count rate of data. |
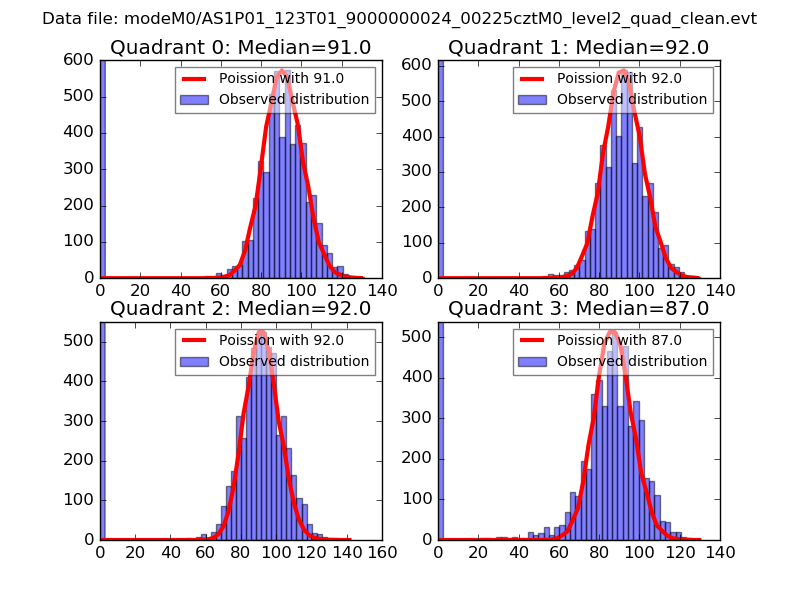 |
 |
| Quadrant-wise count rates Data is divided into 100 sec bins |
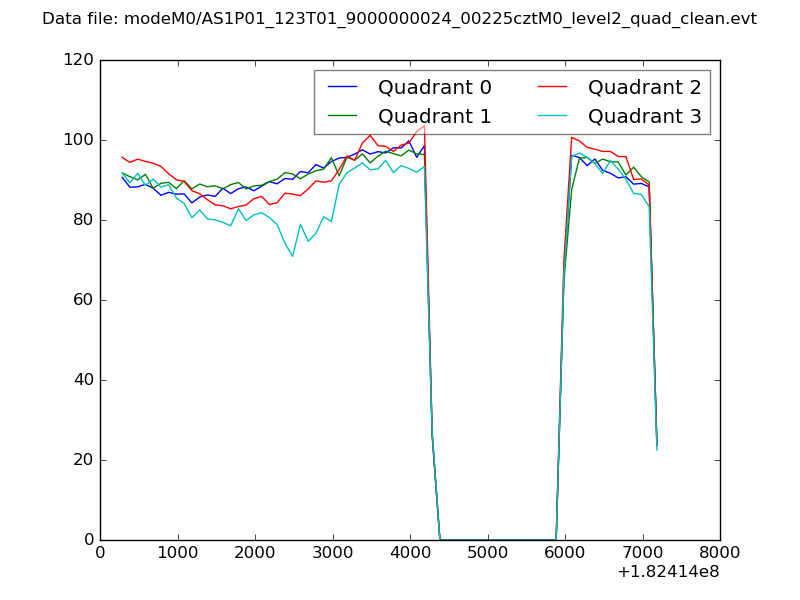 |
|
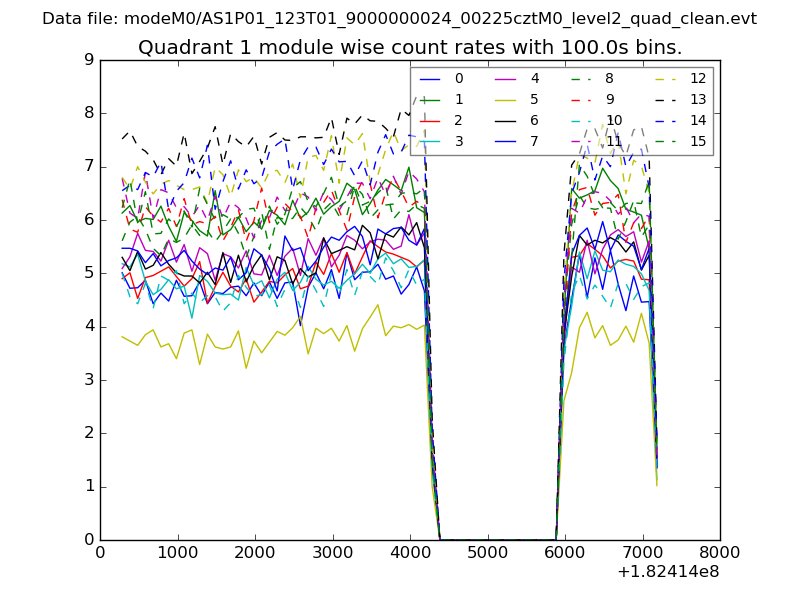
| Module-wise count rates for Quadrant A Data is divided into 100 sec bins |
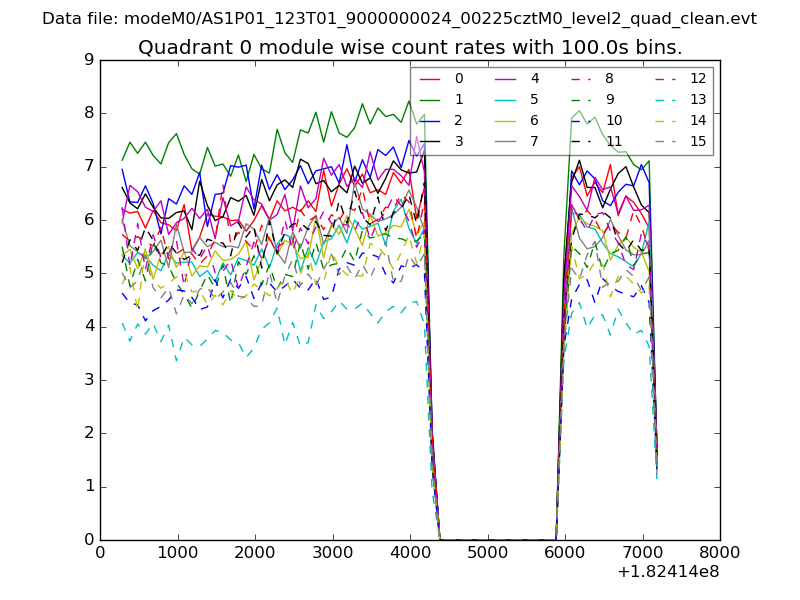 |
 |
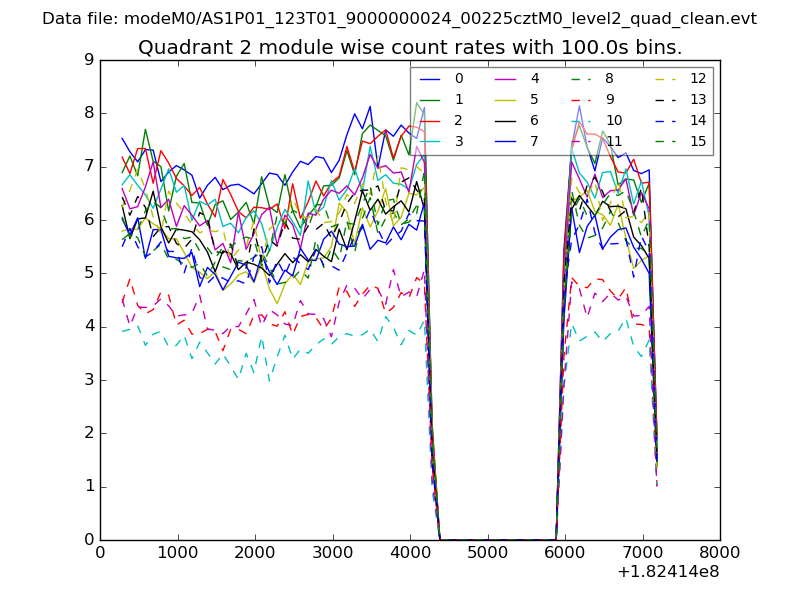
| Module-wise count rates for Quadrant B Data is divided into 100 sec bins |
 |
 |
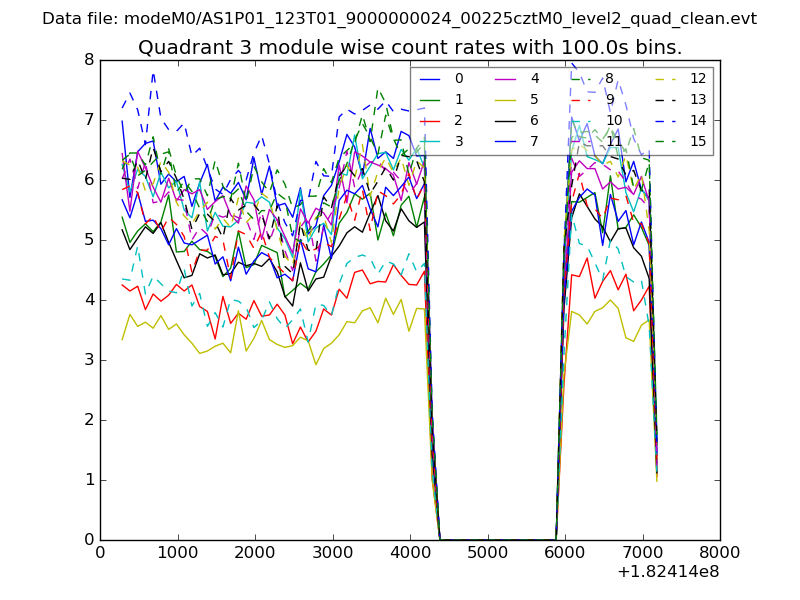
| Module-wise count rates for Quadrant C Data is divided into 100 sec bins |
 |
 |
| Module-wise count rates for Quadrant D Data is divided into 100 sec bins |
 |
 |
| Parameter | Plot |
|---|---|
| CZT HV Monitor | 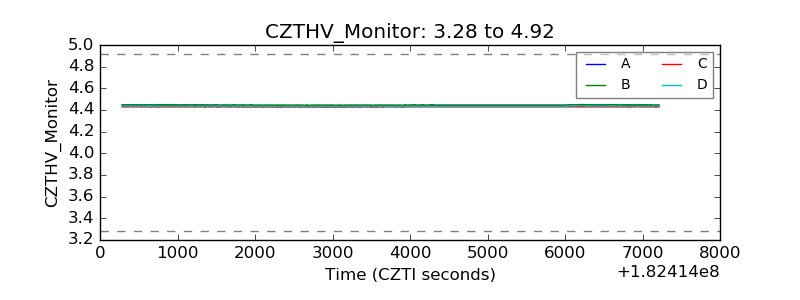 |
| D_VDD | 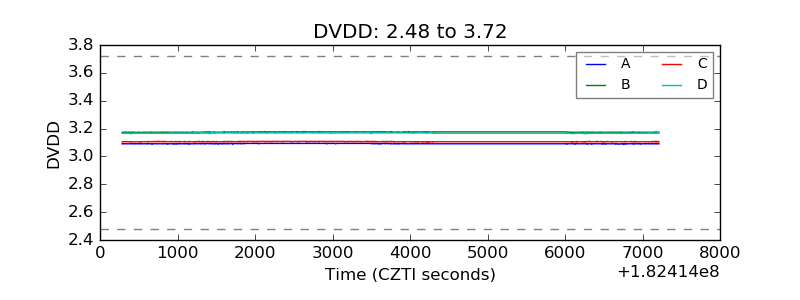 |
| Temperature 1 | 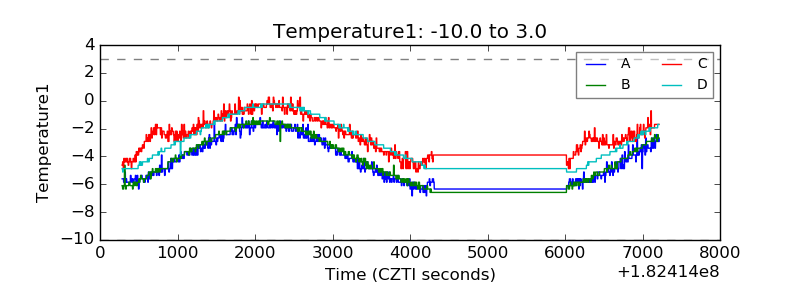 |
| Veto HV Monitor | 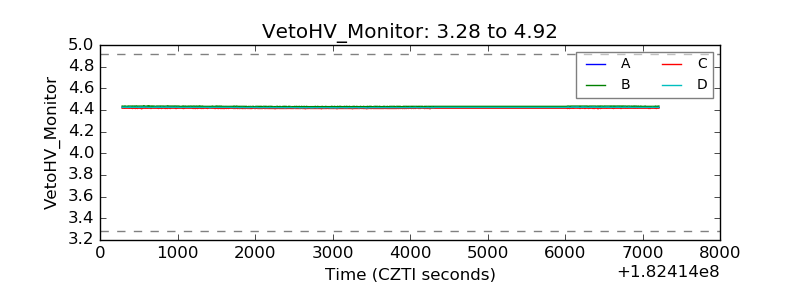 |
| Veto LLD | 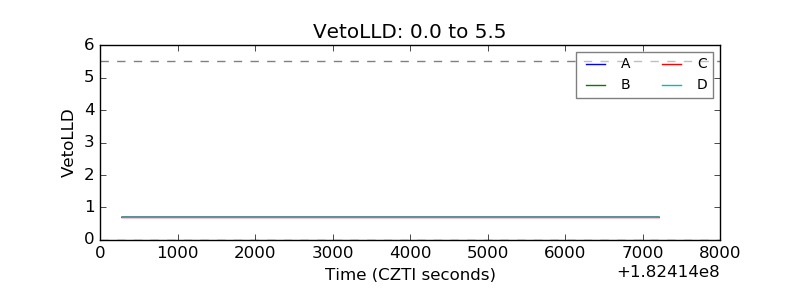 |
| Alpha Counter | 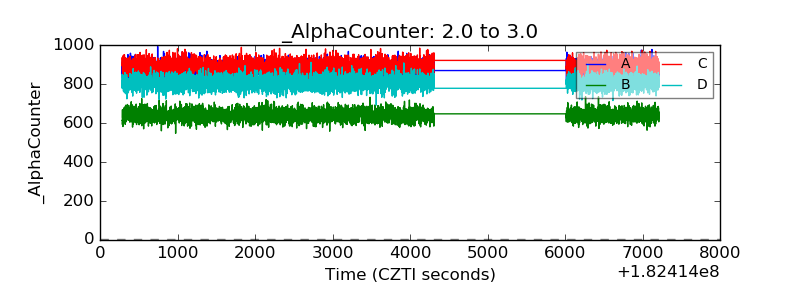 |
| _CPM_Rate | 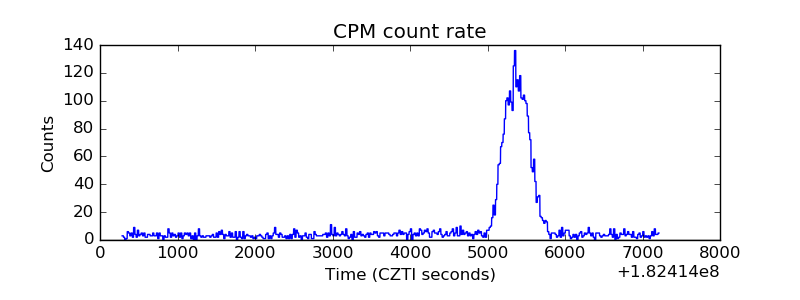 |
| CZT Counter | 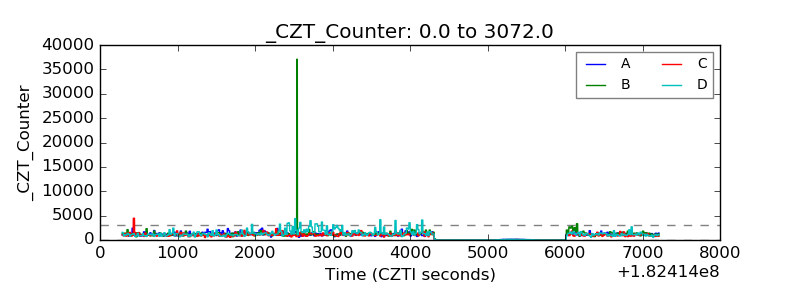 |
| +2.5 Volts monitor | 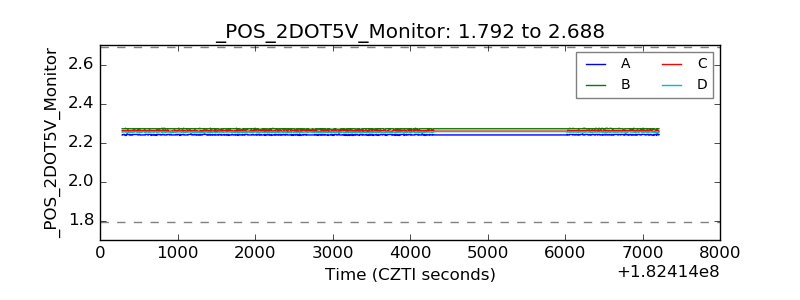 |
| +5 Volts monitor |  |
| _ROLL_ROT | 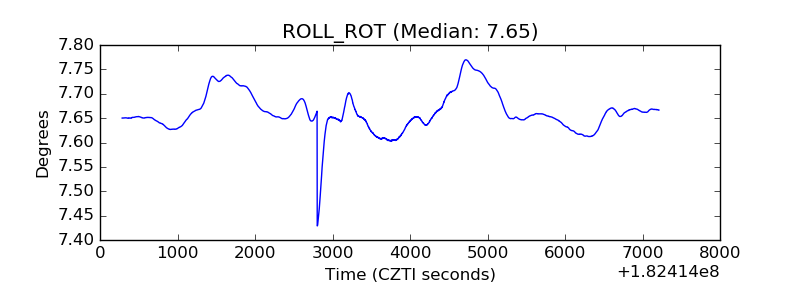 |
| _Roll_DEC | 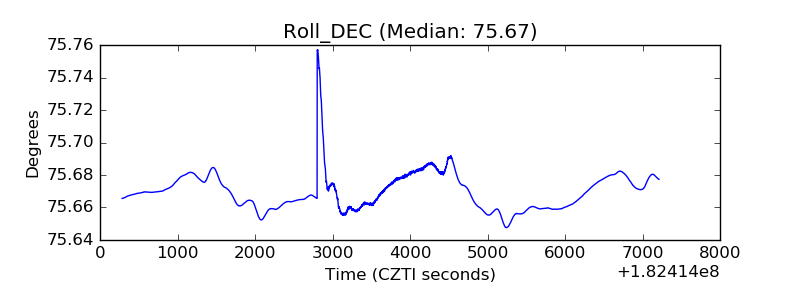 |
| _Roll_RA | 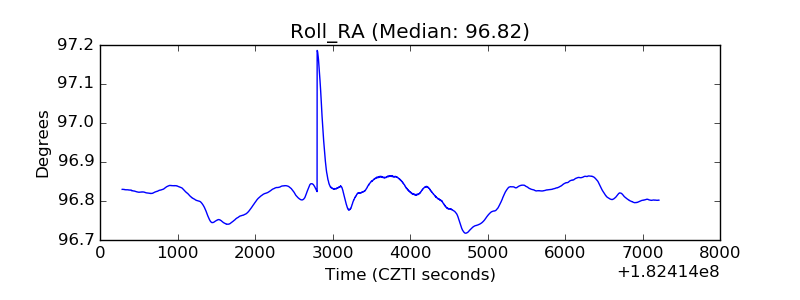 |
| Veto Counter | 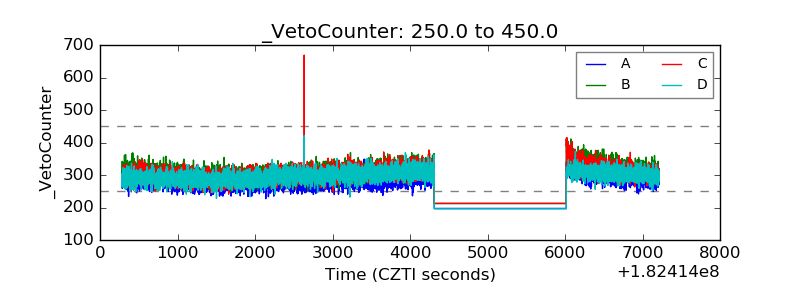 |