| Param | Original file | Final file |
|---|---|---|
| Filename | modeM0/AS1P01_123T01_9000000024_00230cztM0_level2.evt | modeM0/AS1P01_123T01_9000000024_00230cztM0_level2_quad_clean.evt |
| Size (bytes) | 870,647,040 | 79,205,760 |
| Size | 830.3 MB | 75.5 MB |
| Events in quadrant A | 6,118,143 | 519,140 |
| Events in quadrant B | 6,430,198 | 519,571 |
| Events in quadrant C | 5,796,742 | 521,340 |
| Events in quadrant D | 7,683,200 | 479,913 |
| Mode SS | |||
|---|---|---|---|
| Quadrant | BADHDUFLAG | Total packets | Discarded packets |
| A | 0 | 104 | 0 |
| B | 0 | 104 | 0 |
| C | 0 | 104 | 0 |
| D | 0 | 104 | 0 |
| Mode M9 | |||
|---|---|---|---|
| Quadrant | BADHDUFLAG | Total packets | Discarded packets |
| A | 0 | 17 | 0 |
| B | 0 | 17 | 0 |
| C | 0 | 17 | 0 |
| D | 0 | 17 | 0 |
| Mode M0 | |||
|---|---|---|---|
| Quadrant | BADHDUFLAG | Total packets | Discarded packets |
| A | 0 | 21803 | 2 |
| B | 0 | 22711 | 1 |
| C | 0 | 20856 | 1 |
| D | 0 | 26489 | 1 |
| Quadrant | Total seconds | Saturated seconds | Saturation percentage |
|---|---|---|---|
| A | 5114 | 3 | 0.058662% |
| B | 5114 | 25 | 0.488854% |
| C | 5114 | 4 | 0.078217% |
| D | 5114 | 311 | 6.081345% |
Noise dominated data is calculated using 1-second bins in cleaned event files. If a bin has >2000 counts, and if more than 50% of those come from <1% of pixels, then it is considered to be noise-dominated and hence unusable.
| Quadrant | # 1 sec bins | Bins with >0 counts | Bins with >2000 counts | High rate bins dominated by noise | Noise dominated (total time) | Noise dominated (detector-on time) | Marked lightcurve |
|---|---|---|---|---|---|---|---|
| A | 6819 | 5115 | 112 | 112 | 1.64% | 2.19% | 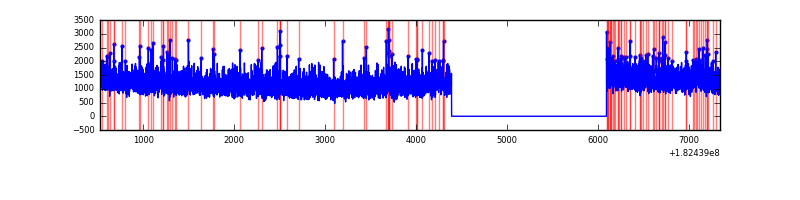 |
| B | 6819 | 5115 | 170 | 170 | 2.49% | 3.32% | 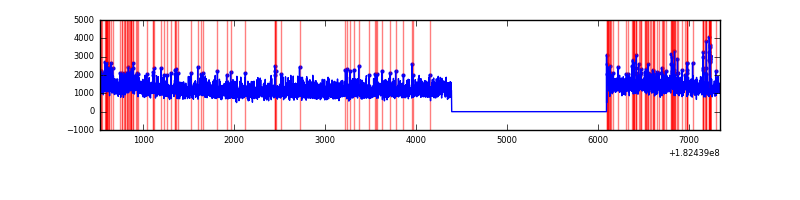 |
| C | 6819 | 5115 | 56 | 56 | 0.82% | 1.09% | 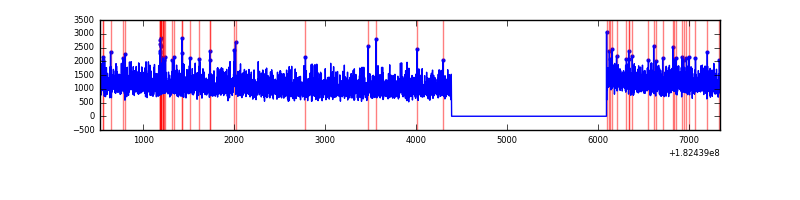 |
| D | 6819 | 5115 | 846 | 846 | 12.41% | 16.54% | 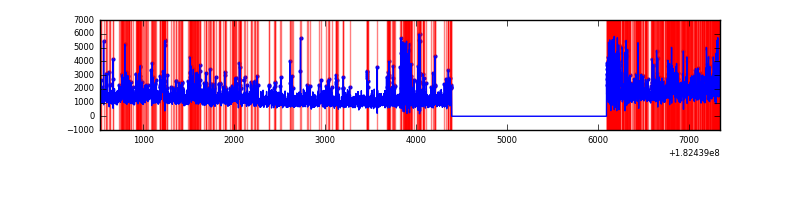 |
Top three noisy pixels from each quadrant. If the there are fewer than three noisy pixels in the level2.evt file, extra rows are filled as -1
| Pixel properties | Quadrant properties | ||||||
|---|---|---|---|---|---|---|---|
| Quadrant | DetID | PixID | Counts | Sigma | Mean | Median | Sigma |
| A | 12 | 150 | 37740 | 105.93 | 1547 | 1529 | 341.8 |
| A | 15 | 250 | 36718 | 102.94 | 1547 | 1529 | 341.8 |
| A | 12 | 250 | 30691 | 85.31 | 1547 | 1529 | 341.8 |
| B | 7 | 220 | 236318 | 649.13 | 1554 | 1557 | 361.7 |
| B | 5 | 46 | 121245 | 330.95 | 1554 | 1557 | 361.7 |
| B | 8 | 6 | 45612 | 121.82 | 1554 | 1557 | 361.7 |
| C | 1 | 1 | 68073 | 165.34 | 1450 | 1505 | 402.6 |
| C | 9 | 54 | 22563 | 52.3 | 1450 | 1505 | 402.6 |
| C | 12 | 3 | 5907 | 10.93 | 1450 | 1505 | 402.6 |
| D | 1 | 4 | 1378035 | 2811.77 | 1441 | 1439 | 489.6 |
| D | 13 | 46 | 150522 | 304.51 | 1441 | 1439 | 489.6 |
| D | 2 | 106 | 65549 | 130.95 | 1441 | 1439 | 489.6 |
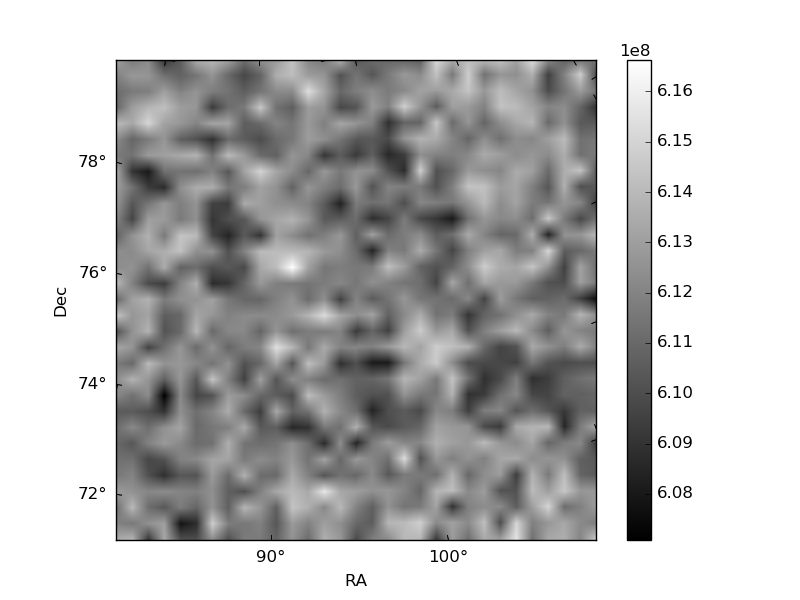
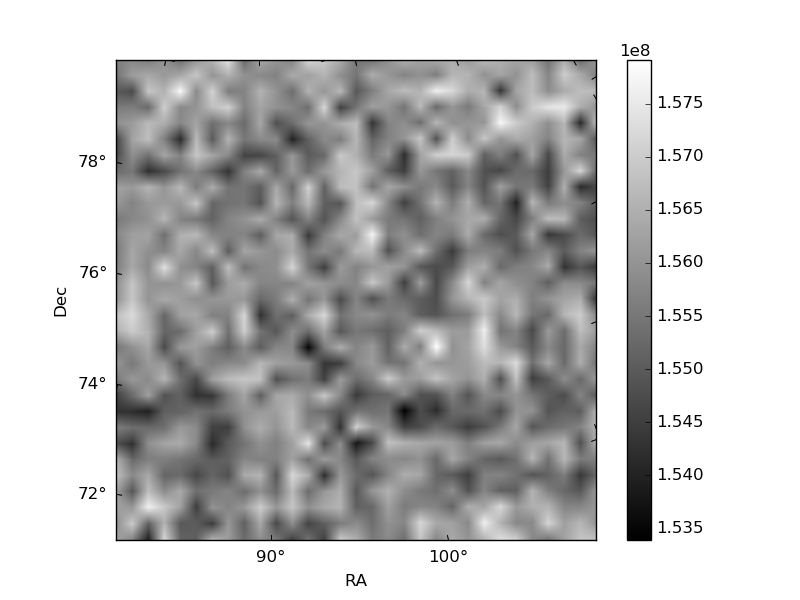
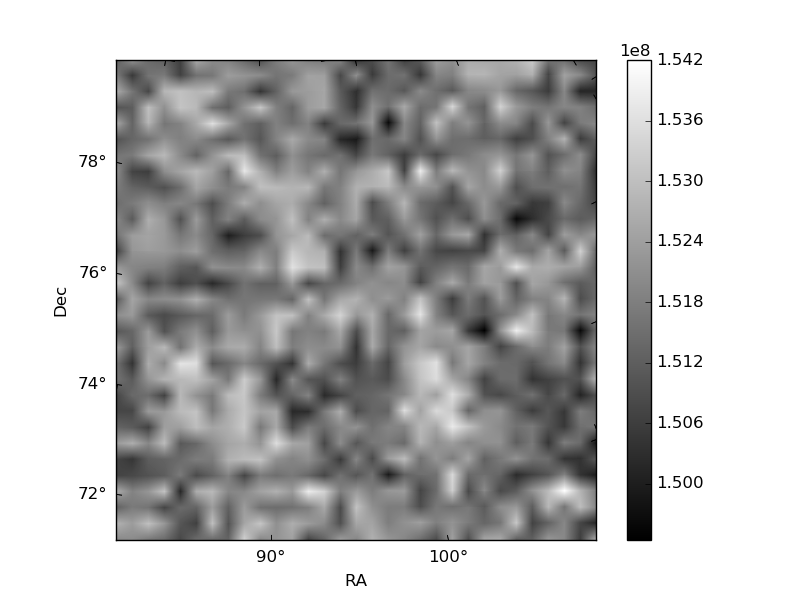
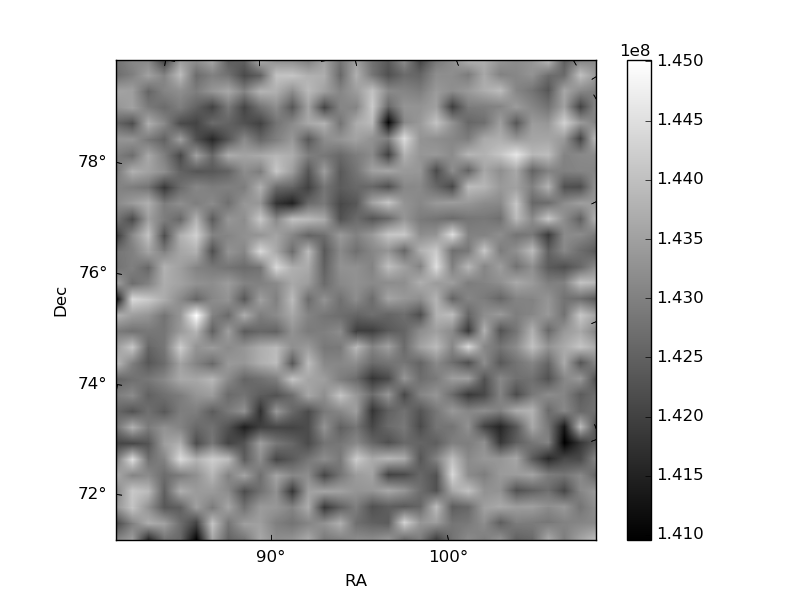
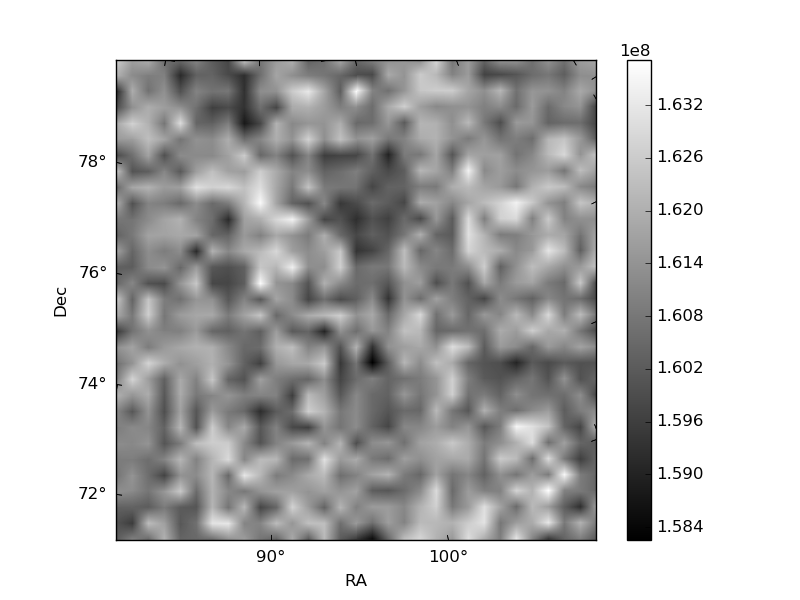
Histogram calculated using DETX and DETY for each event in the final _common_clean file
| Quadrant A | 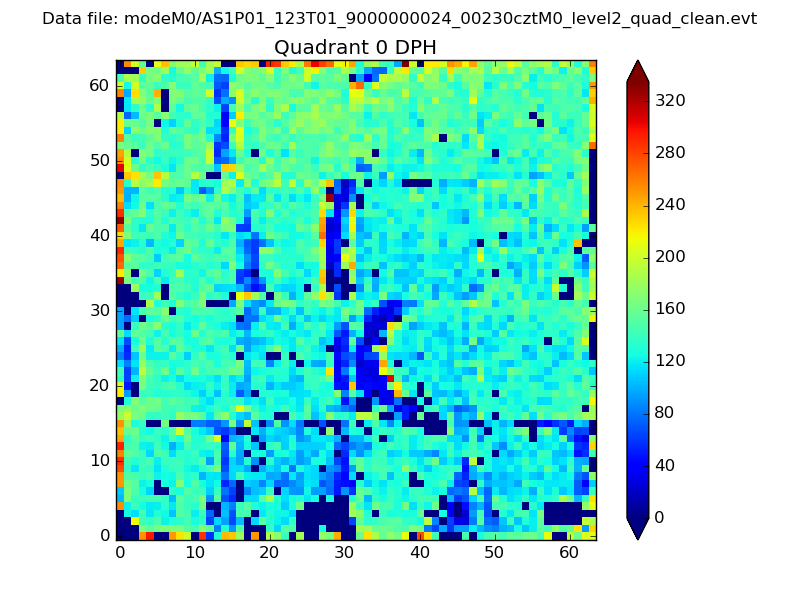 |
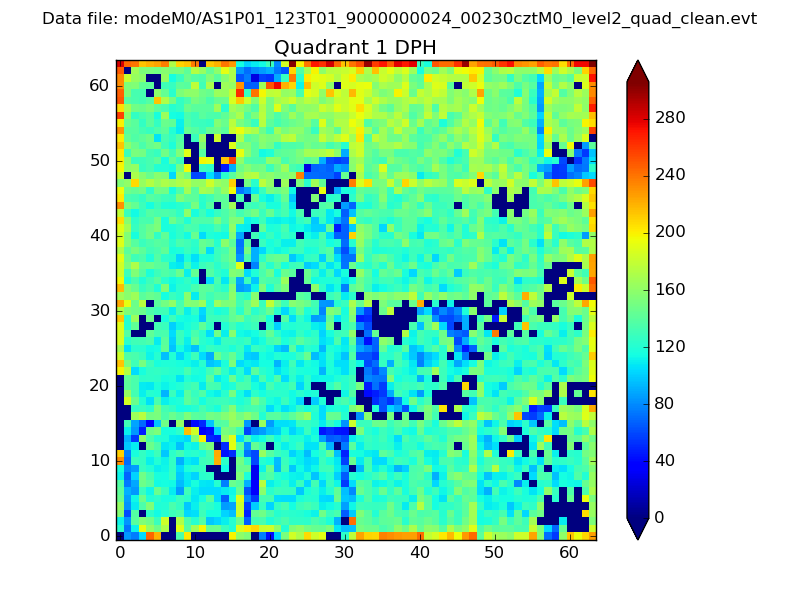 |
Quadrant B |
|---|---|---|---|
| Quadrant D | 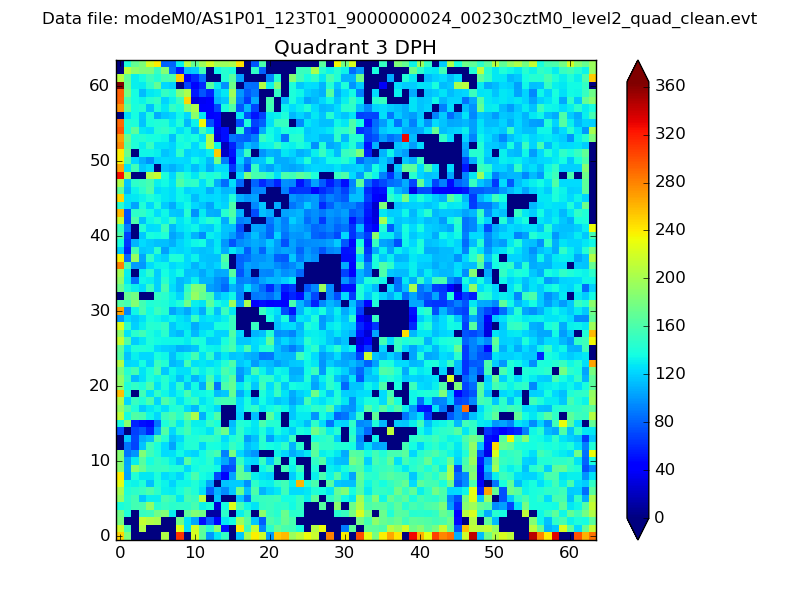 |
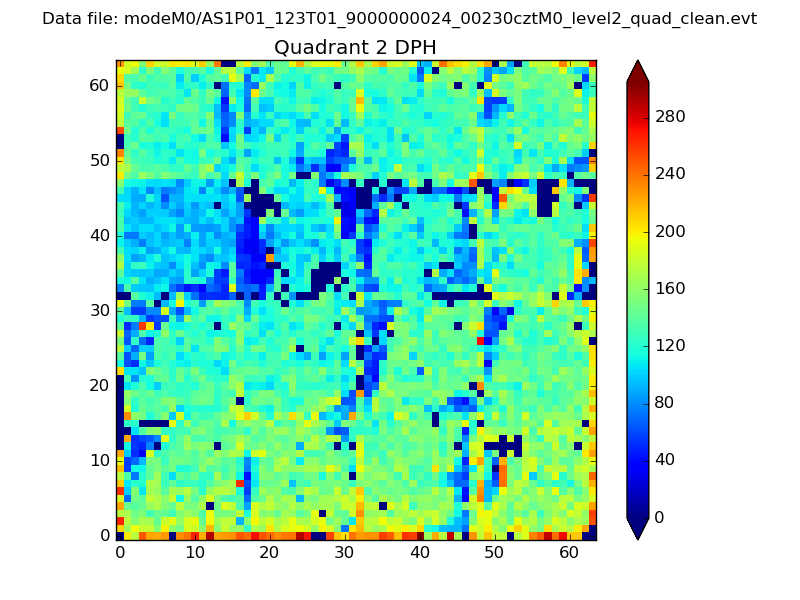 |
Quadrant C |
| Plot type | Count rate plots | Images |
|---|---|---|
| Comparison with Poisson distribution Blue bars denote a histogram of data divided into 1 sec bins. Red curve is a Poisson curve with rate = median count rate of data. |
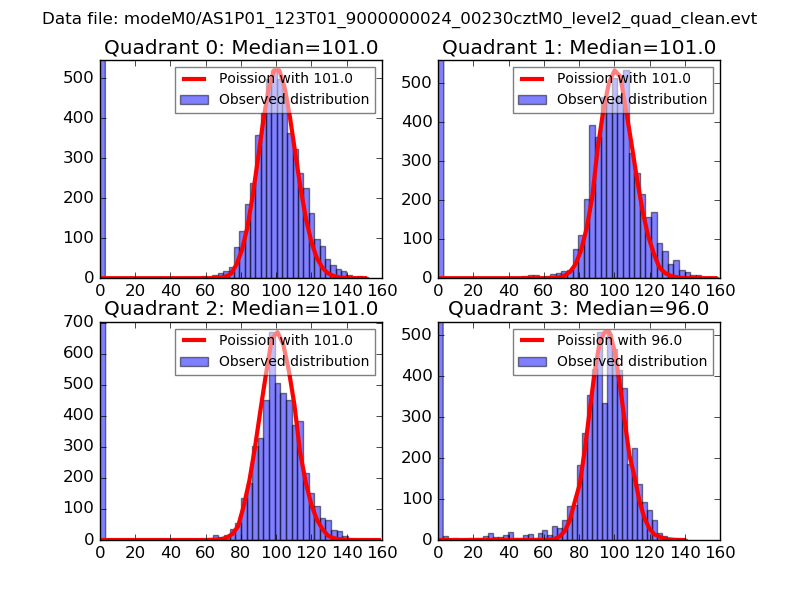 |
 |
| Quadrant-wise count rates Data is divided into 100 sec bins |
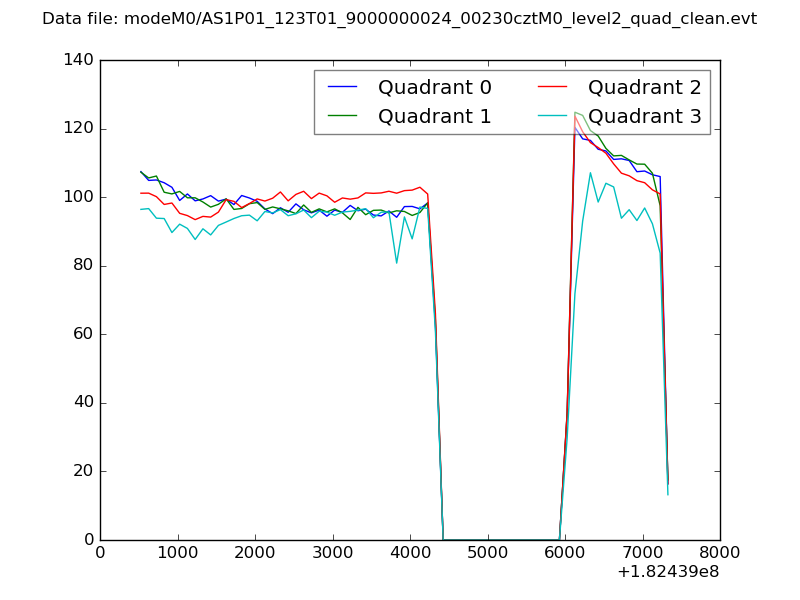 |
|
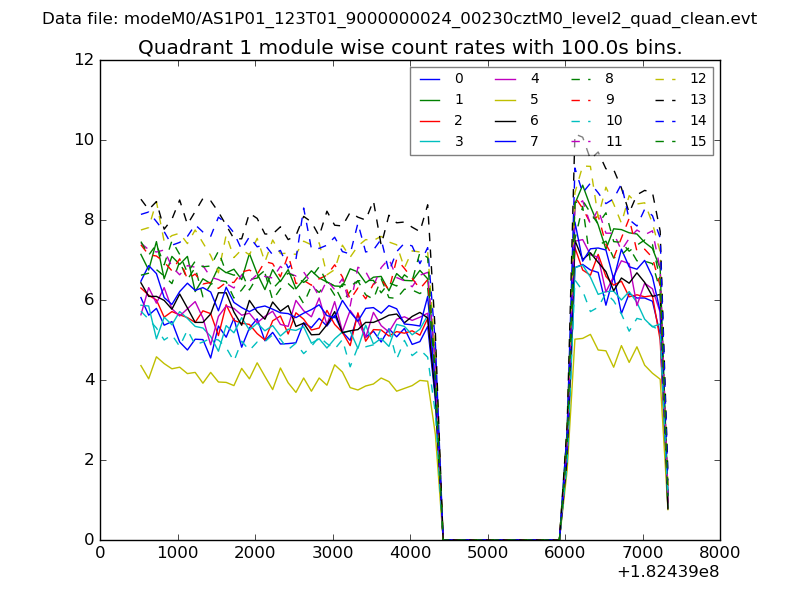
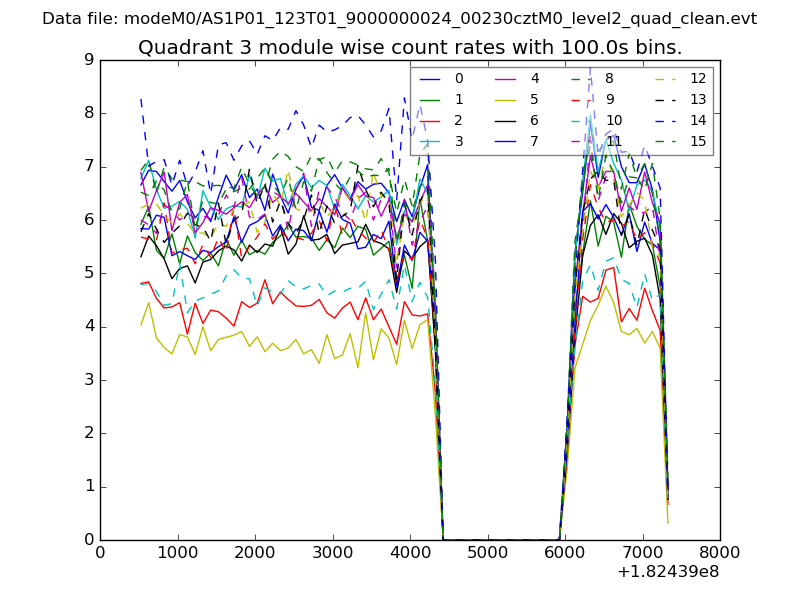
| Module-wise count rates for Quadrant A Data is divided into 100 sec bins |
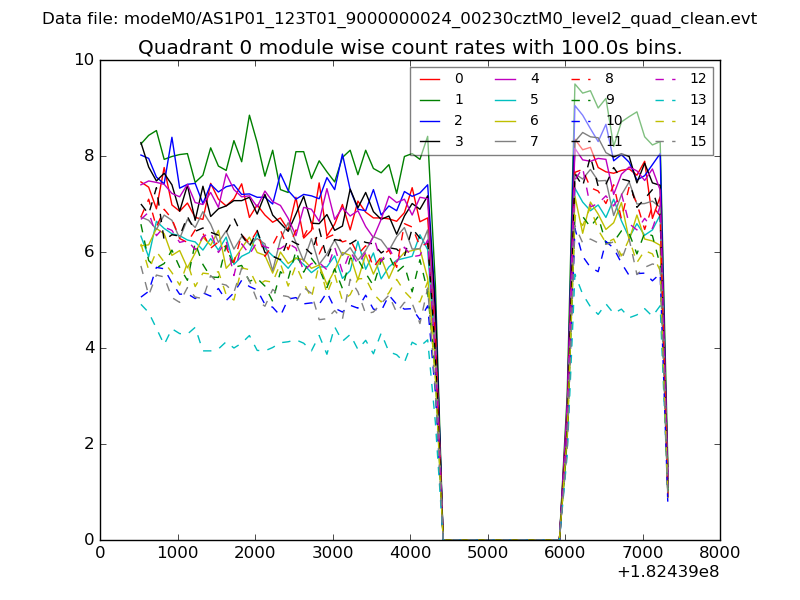 |
 |
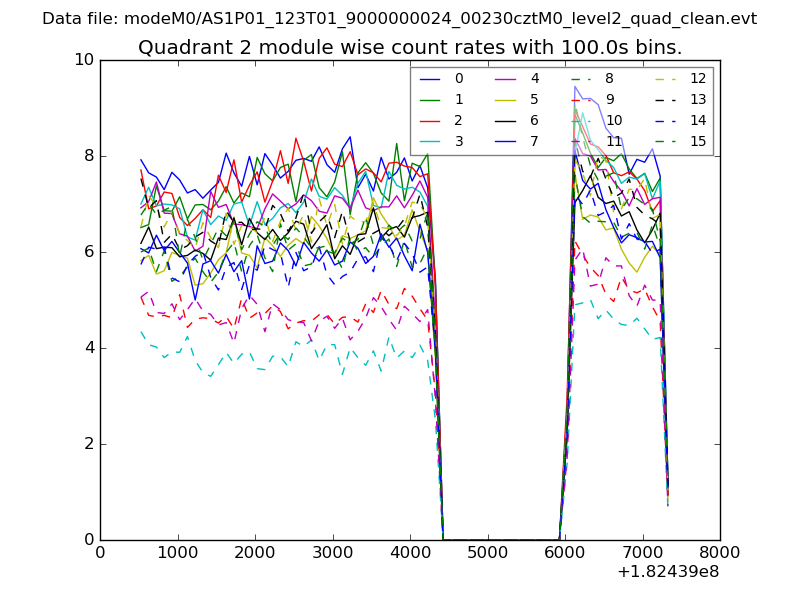
| Module-wise count rates for Quadrant B Data is divided into 100 sec bins |
 |
 |
| Module-wise count rates for Quadrant C Data is divided into 100 sec bins |
 |
 |
| Module-wise count rates for Quadrant D Data is divided into 100 sec bins |
 |
 |
| Parameter | Plot |
|---|---|
| CZT HV Monitor | 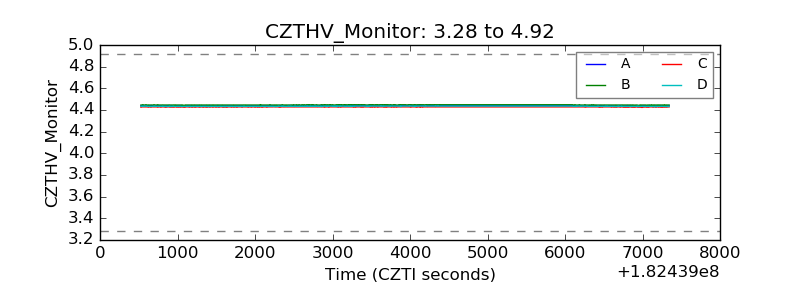 |
| D_VDD | 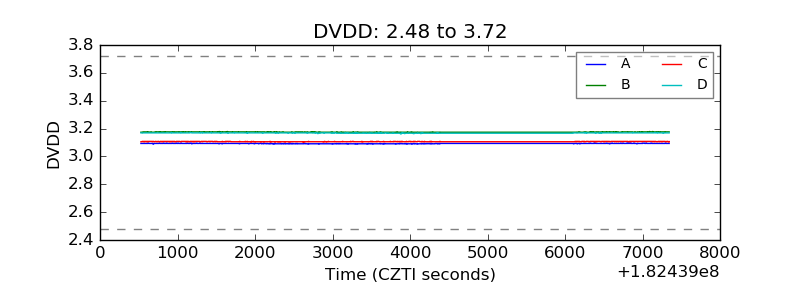 |
| Temperature 1 | 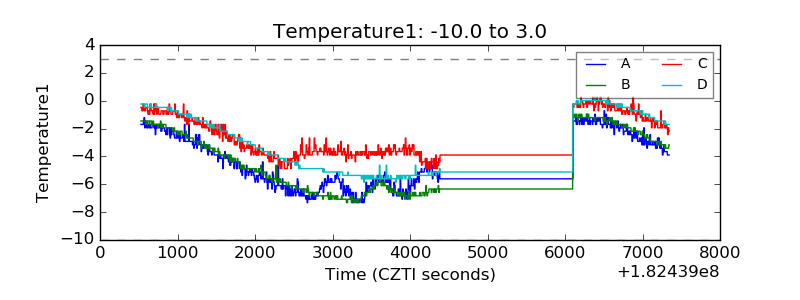 |
| Veto HV Monitor | 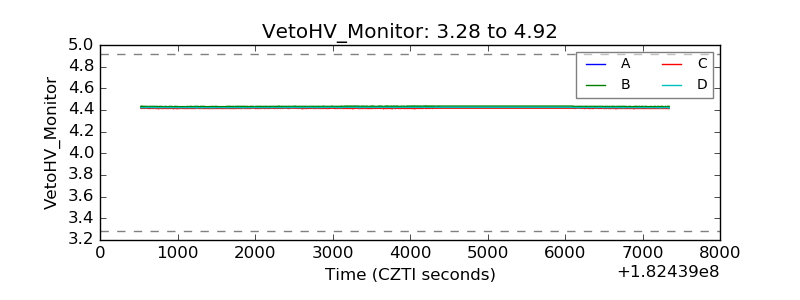 |
| Veto LLD | 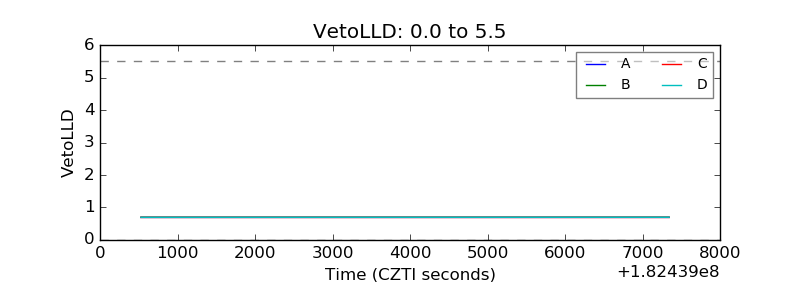 |
| Alpha Counter | 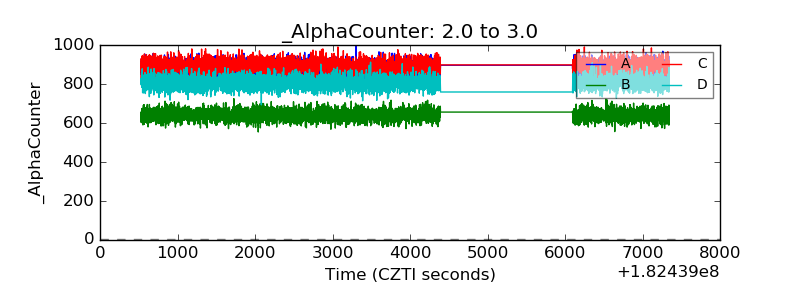 |
| _CPM_Rate | 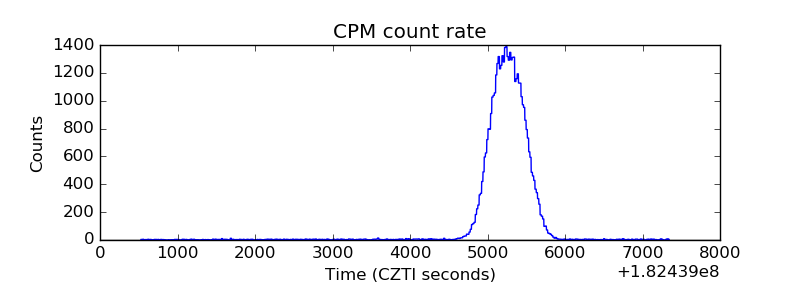 |
| CZT Counter | 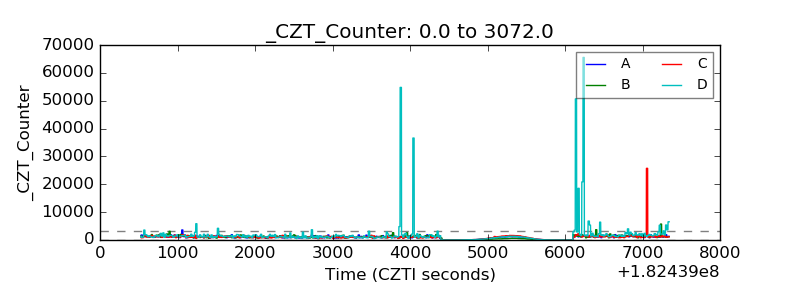 |
| +2.5 Volts monitor |  |
| +5 Volts monitor |  |
| _ROLL_ROT | 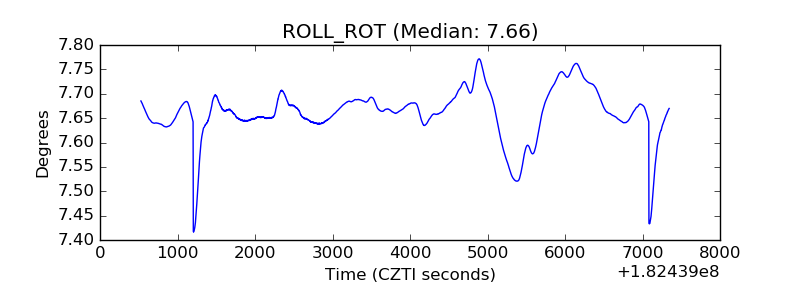 |
| _Roll_DEC | 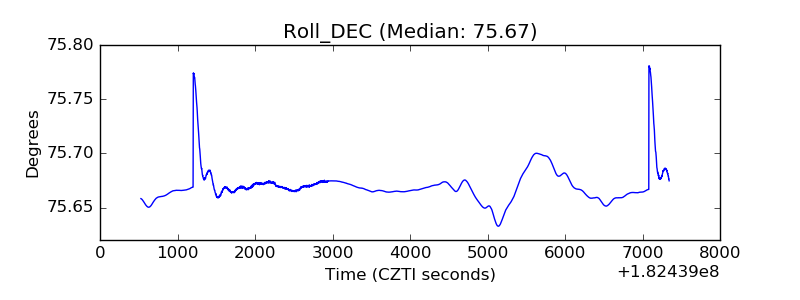 |
| _Roll_RA | 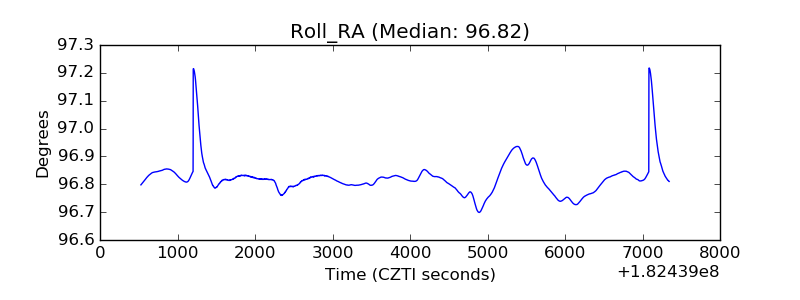 |
| Veto Counter | 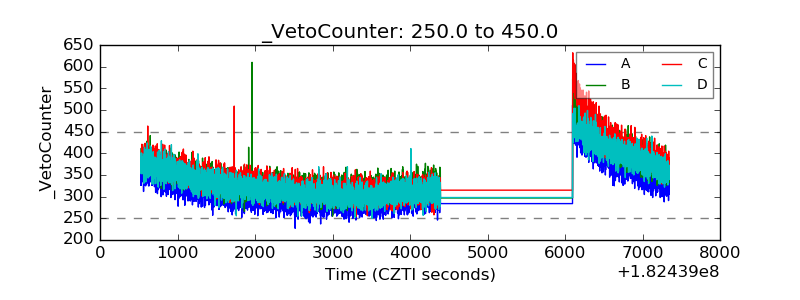 |