| Param | Original file | Final file |
|---|---|---|
| Filename | modeM0/AS1P01_123T01_9000000024_00233cztM0_level2.evt | modeM0/AS1P01_123T01_9000000024_00233cztM0_level2_quad_clean.evt |
| Size (bytes) | 854,930,880 | 81,682,560 |
| Size | 815.3 MB | 77.9 MB |
| Events in quadrant A | 6,148,894 | 520,996 |
| Events in quadrant B | 6,354,372 | 525,427 |
| Events in quadrant C | 5,795,782 | 541,518 |
| Events in quadrant D | 7,234,739 | 508,930 |
| Mode SS | |||
|---|---|---|---|
| Quadrant | BADHDUFLAG | Total packets | Discarded packets |
| A | 0 | 110 | 0 |
| B | 0 | 110 | 0 |
| C | 0 | 110 | 0 |
| D | 0 | 110 | 0 |
| Mode M9 | |||
|---|---|---|---|
| Quadrant | BADHDUFLAG | Total packets | Discarded packets |
| A | 0 | 17 | 0 |
| B | 0 | 17 | 0 |
| C | 0 | 17 | 0 |
| D | 0 | 17 | 0 |
| Mode M0 | |||
|---|---|---|---|
| Quadrant | BADHDUFLAG | Total packets | Discarded packets |
| A | 0 | 22114 | 2 |
| B | 0 | 22683 | 1 |
| C | 0 | 21075 | 1 |
| D | 0 | 25339 | 1 |
| Quadrant | Total seconds | Saturated seconds | Saturation percentage |
|---|---|---|---|
| A | 5379 | 4 | 0.074363% |
| B | 5379 | 4 | 0.074363% |
| C | 5379 | 2 | 0.037182% |
| D | 5379 | 122 | 2.268080% |
Noise dominated data is calculated using 1-second bins in cleaned event files. If a bin has >2000 counts, and if more than 50% of those come from <1% of pixels, then it is considered to be noise-dominated and hence unusable.
| Quadrant | # 1 sec bins | Bins with >0 counts | Bins with >2000 counts | High rate bins dominated by noise | Noise dominated (total time) | Noise dominated (detector-on time) | Marked lightcurve |
|---|---|---|---|---|---|---|---|
| A | 7114 | 5380 | 108 | 108 | 1.52% | 2.01% | 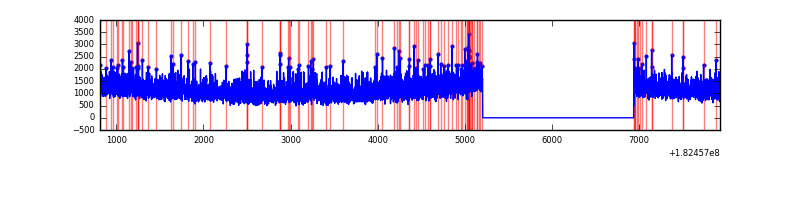 |
| B | 7114 | 5380 | 115 | 115 | 1.62% | 2.14% |  |
| C | 7114 | 5380 | 46 | 46 | 0.65% | 0.86% |  |
| D | 7114 | 5380 | 526 | 526 | 7.39% | 9.78% | 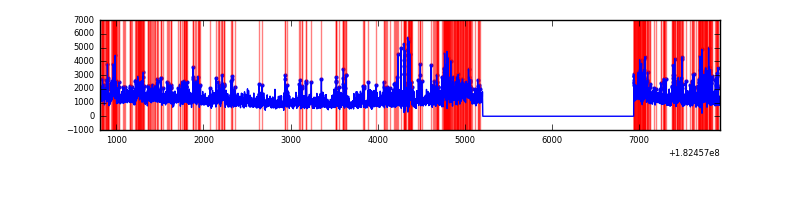 |
Top three noisy pixels from each quadrant. If the there are fewer than three noisy pixels in the level2.evt file, extra rows are filled as -1
| Pixel properties | Quadrant properties | ||||||
|---|---|---|---|---|---|---|---|
| Quadrant | DetID | PixID | Counts | Sigma | Mean | Median | Sigma |
| A | 15 | 250 | 73292 | 206.08 | 1564 | 1542 | 348.2 |
| A | 15 | 17 | 9437 | 22.68 | 1564 | 1542 | 348.2 |
| A | 0 | 253 | 7050 | 15.82 | 1564 | 1542 | 348.2 |
| B | 7 | 220 | 123120 | 331.01 | 1584 | 1591 | 367.1 |
| B | 5 | 46 | 94995 | 254.41 | 1584 | 1591 | 367.1 |
| B | 8 | 4 | 15292 | 37.32 | 1584 | 1591 | 367.1 |
| C | 1 | 1 | 6816 | 13.01 | 1467 | 1521 | 407.0 |
| C | 9 | 68 | 6792 | 12.95 | 1467 | 1521 | 407.0 |
| C | 5 | 251 | 6721 | 12.77 | 1467 | 1521 | 407.0 |
| D | 1 | 4 | 1422201 | 3465.47 | 1393 | 1431 | 410.0 |
| D | 2 | 85 | 117200 | 282.38 | 1393 | 1431 | 410.0 |
| D | 10 | 154 | 94744 | 227.6 | 1393 | 1431 | 410.0 |
Histogram calculated using DETX and DETY for each event in the final _common_clean file
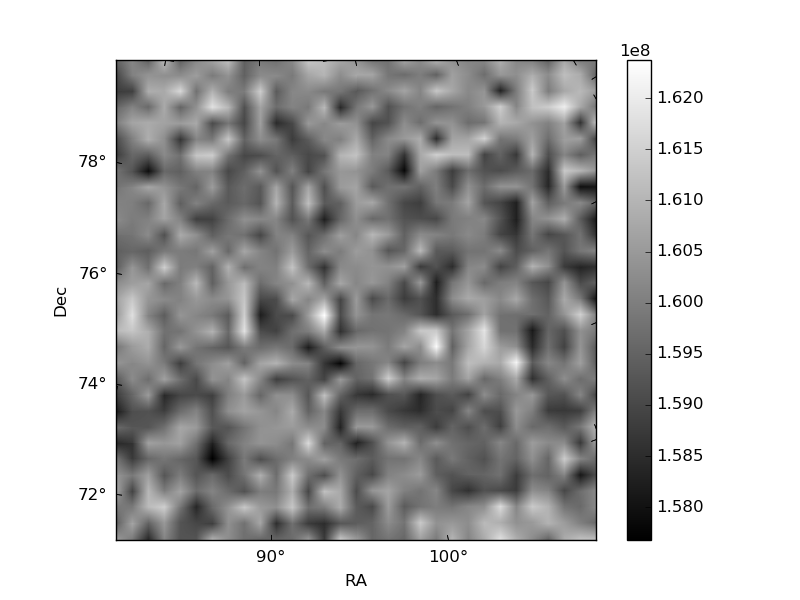
| Quadrant A | 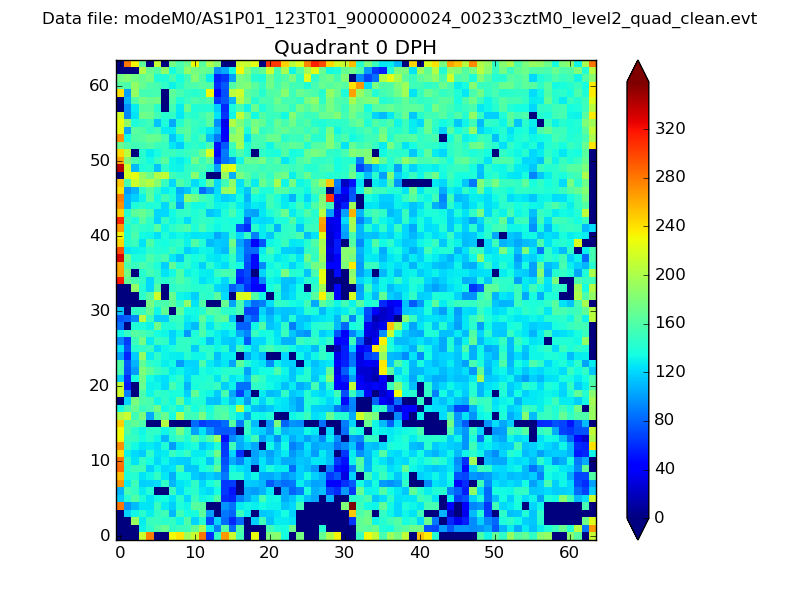 |
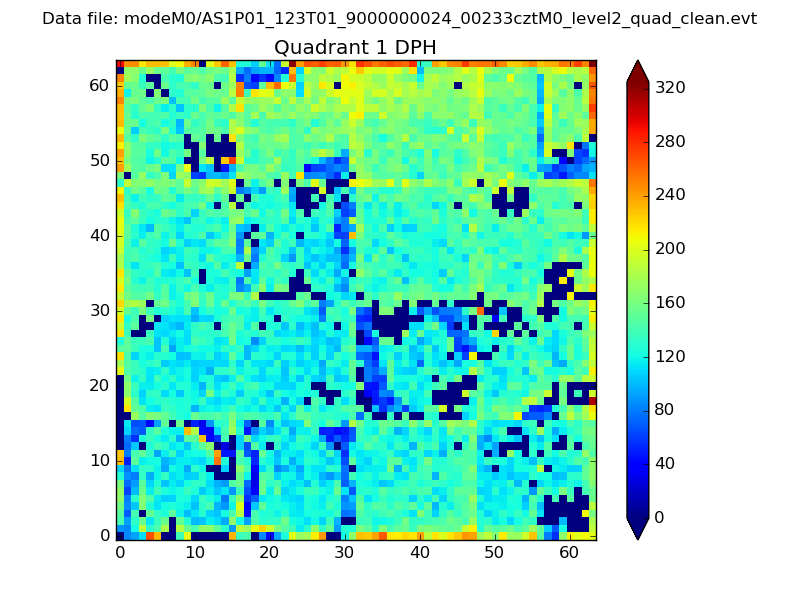 |
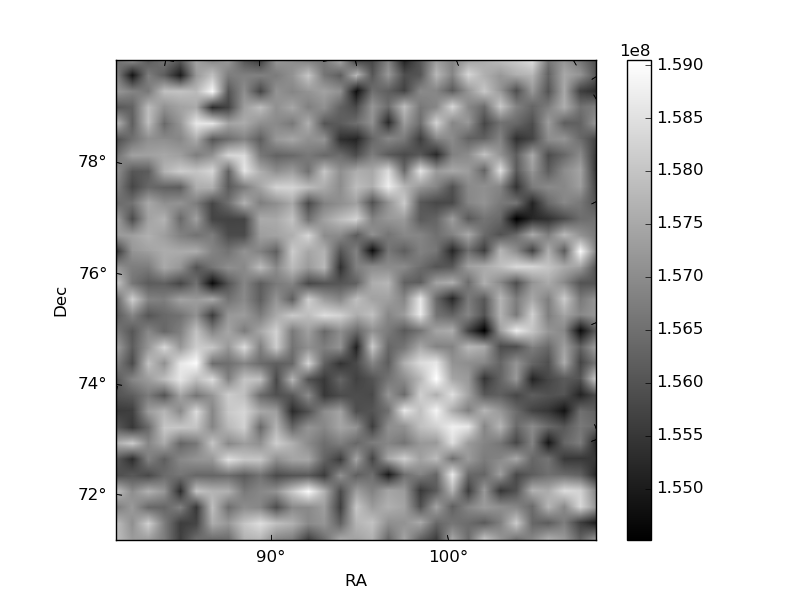
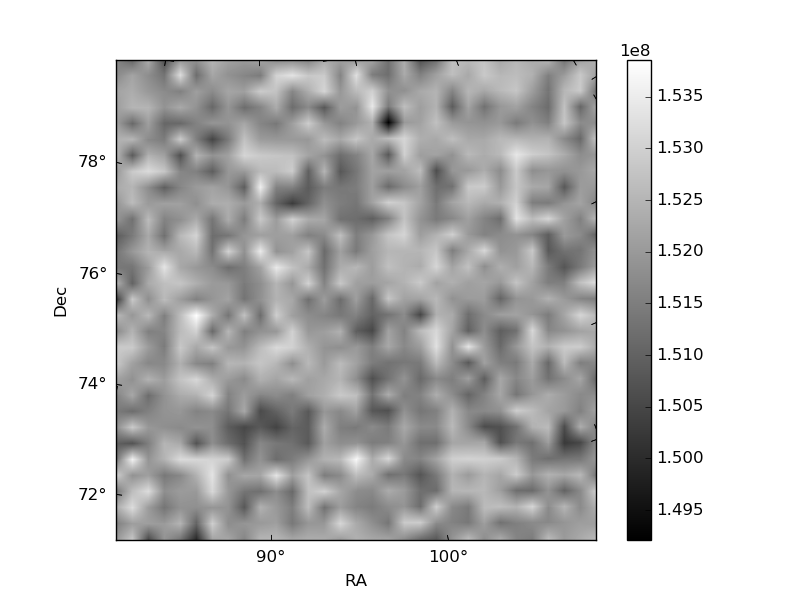
Quadrant B |
|---|---|---|---|
| Quadrant D |  |
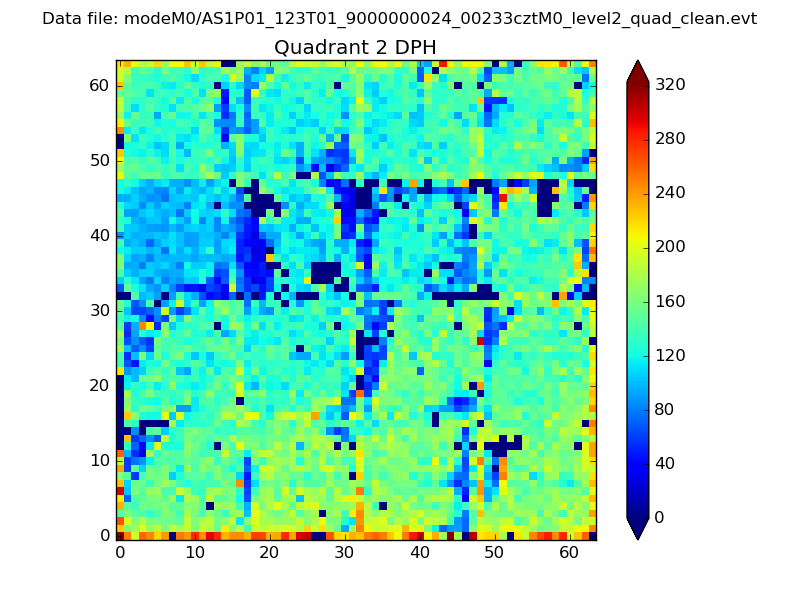 |
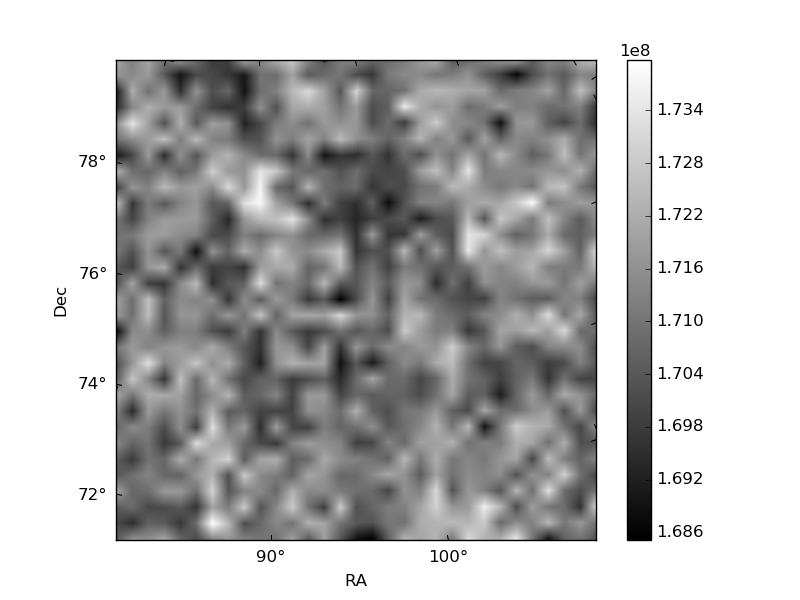
Quadrant C |
| Plot type | Count rate plots | Images |
|---|---|---|
| Comparison with Poisson distribution Blue bars denote a histogram of data divided into 1 sec bins. Red curve is a Poisson curve with rate = median count rate of data. |
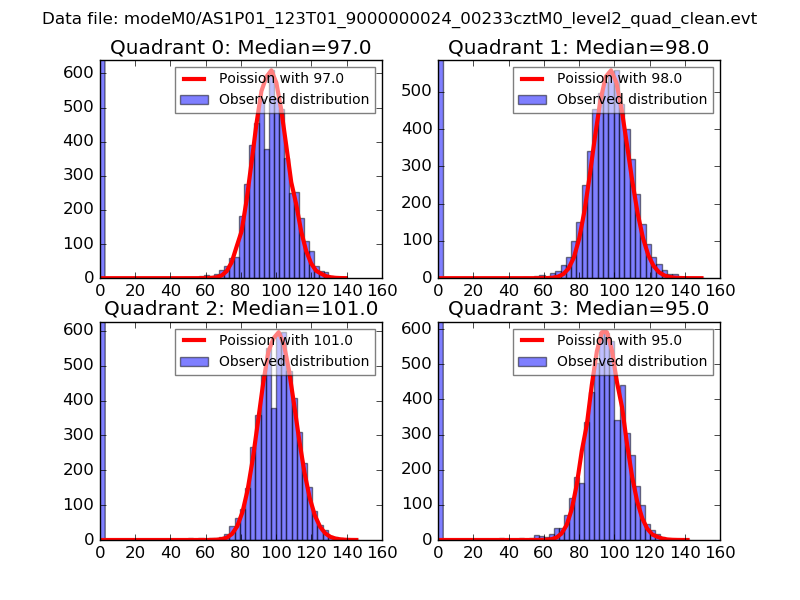 |
 |
| Quadrant-wise count rates Data is divided into 100 sec bins |
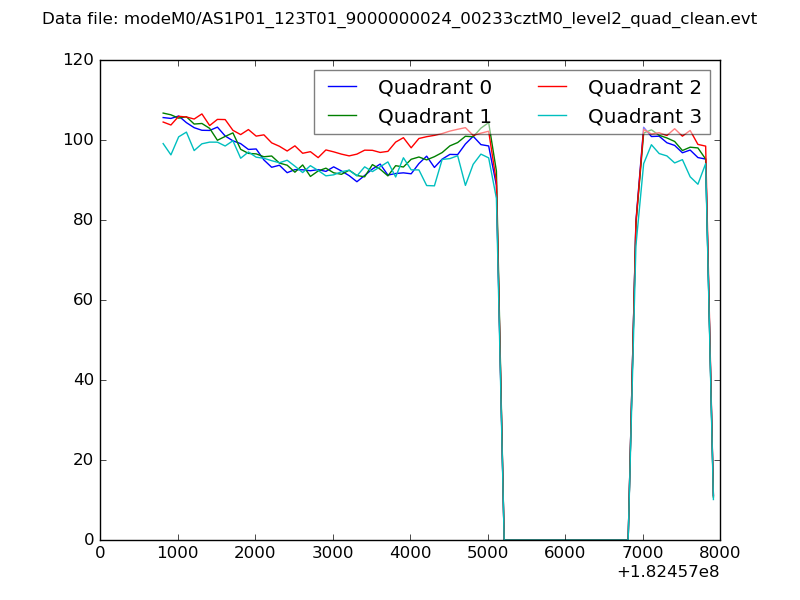 |
|
| Module-wise count rates for Quadrant A Data is divided into 100 sec bins |
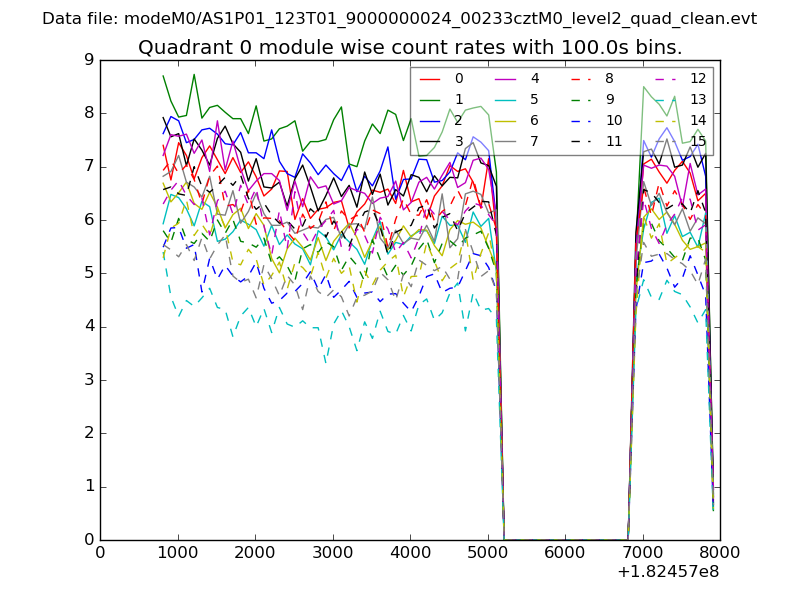 |
 |
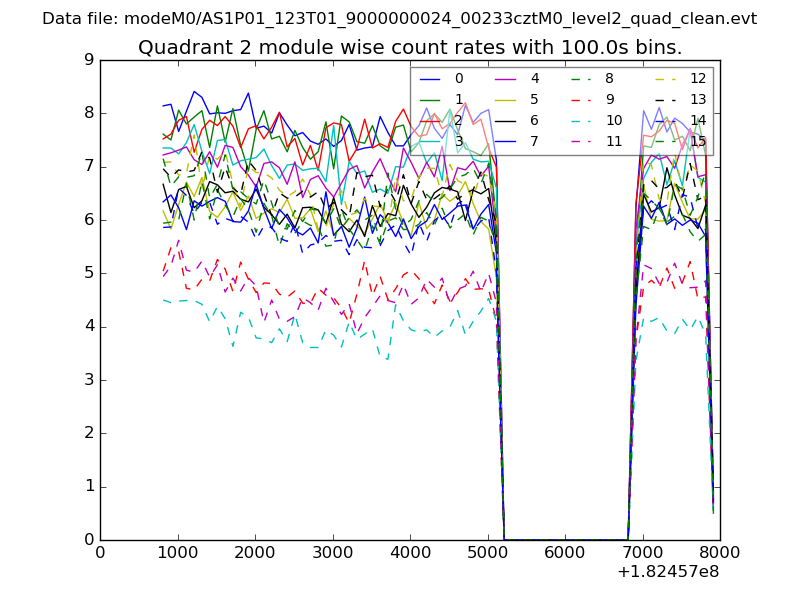
| Module-wise count rates for Quadrant B Data is divided into 100 sec bins |
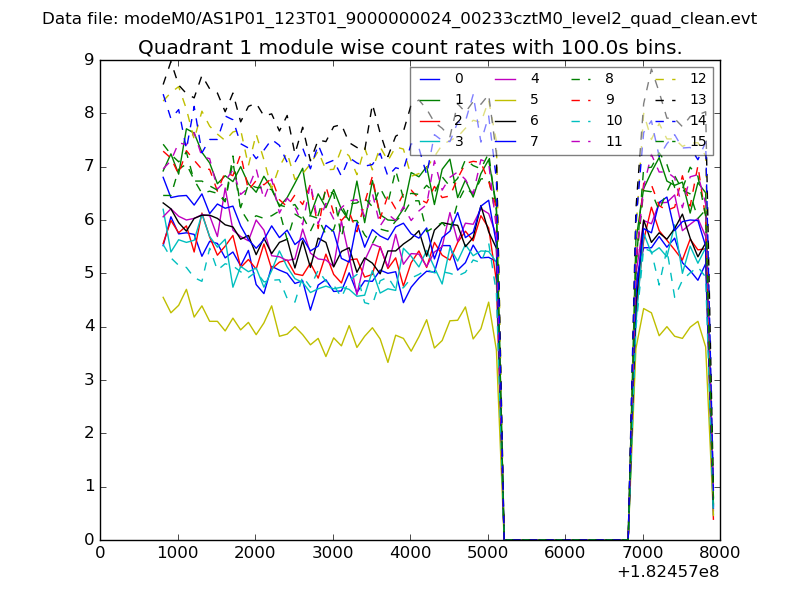 |
 |
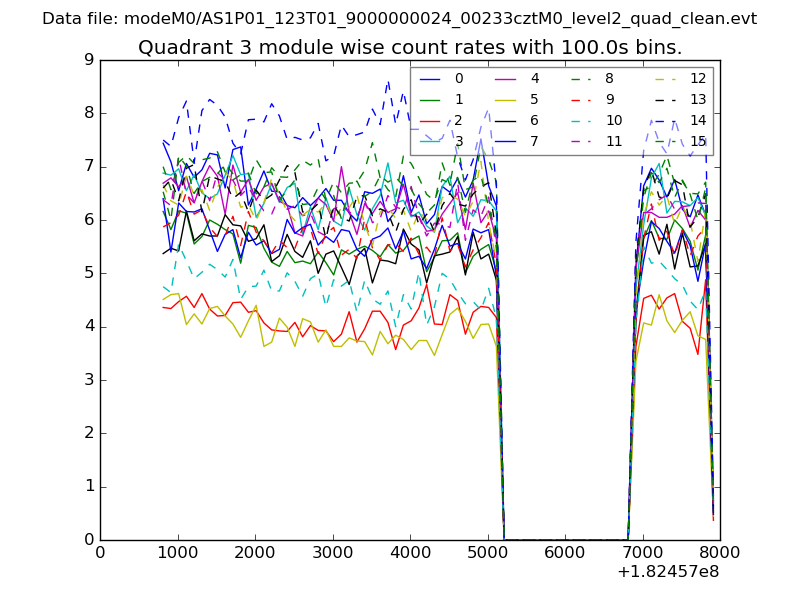
| Module-wise count rates for Quadrant C Data is divided into 100 sec bins |
 |
 |
| Module-wise count rates for Quadrant D Data is divided into 100 sec bins |
 |
 |
| Parameter | Plot |
|---|---|
| CZT HV Monitor | 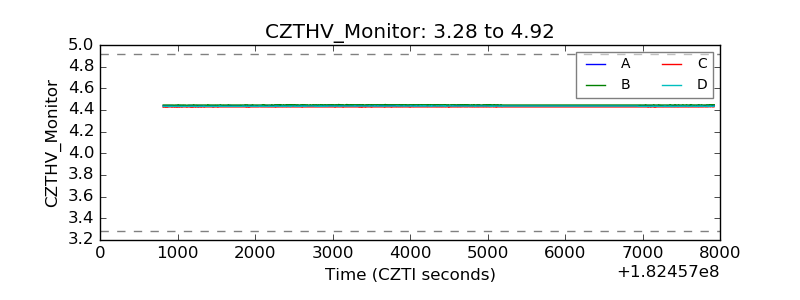 |
| D_VDD | 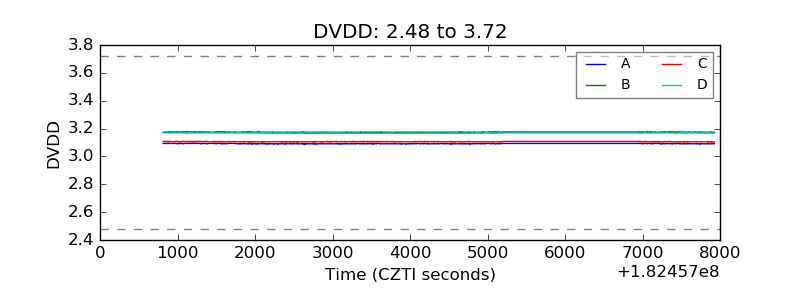 |
| Temperature 1 | 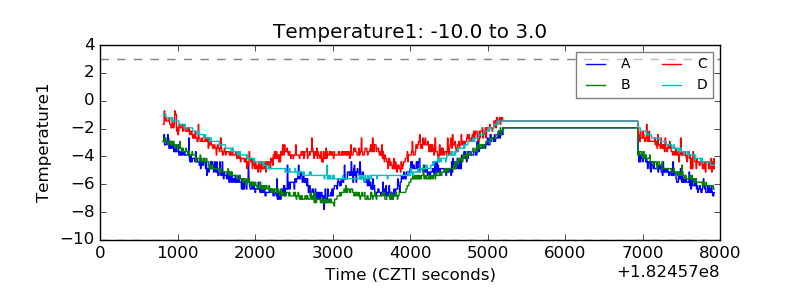 |
| Veto HV Monitor | 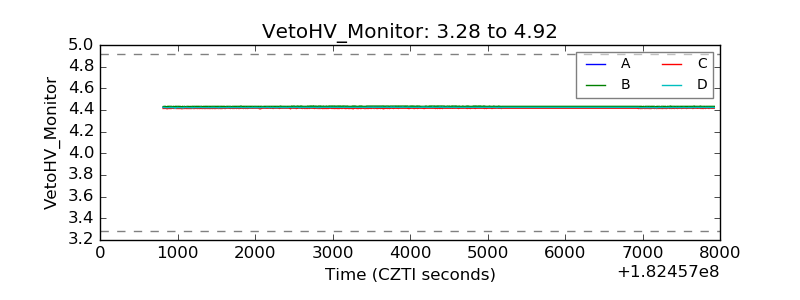 |
| Veto LLD | 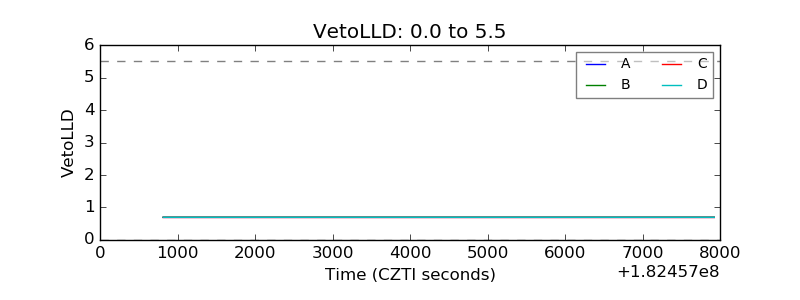 |
| Alpha Counter | 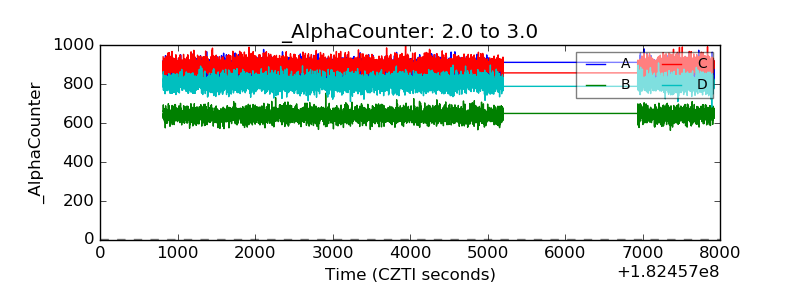 |
| _CPM_Rate | 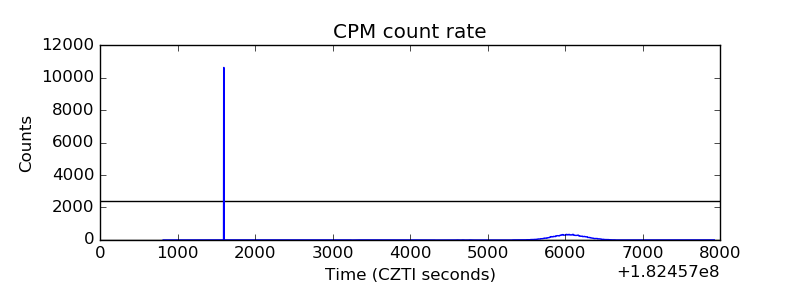 |
| CZT Counter | 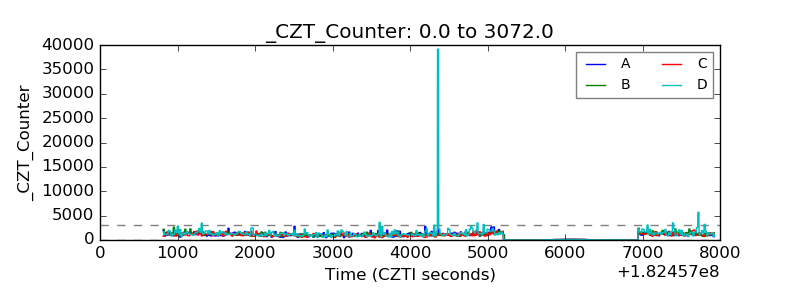 |
| +2.5 Volts monitor |  |
| +5 Volts monitor |  |
| _ROLL_ROT | 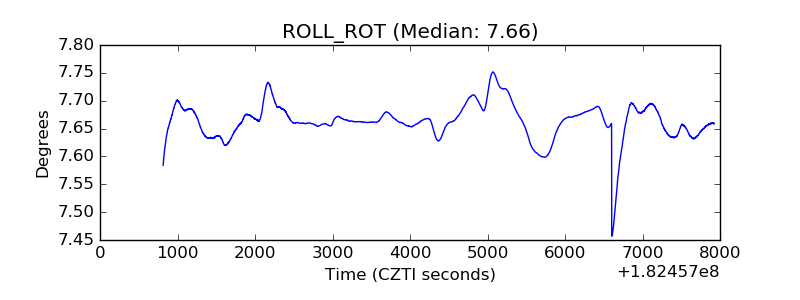 |
| _Roll_DEC | 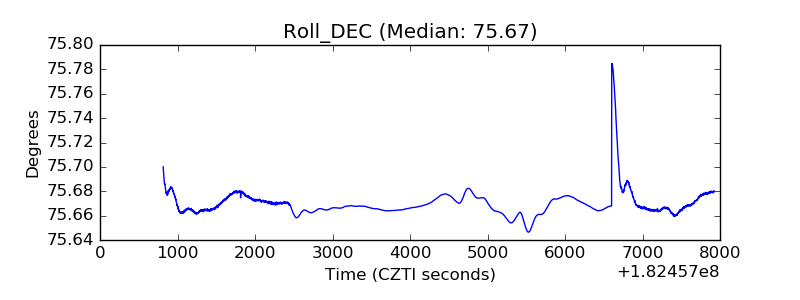 |
| _Roll_RA | 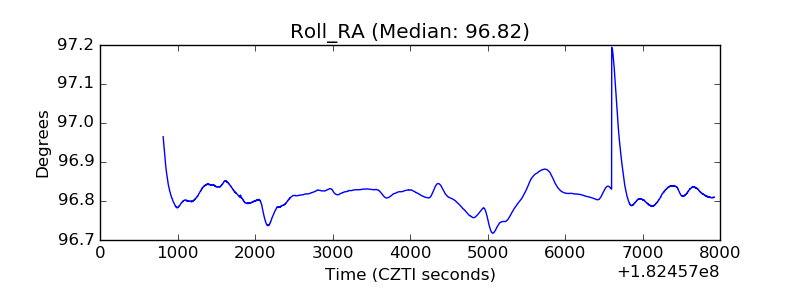 |
| Veto Counter | 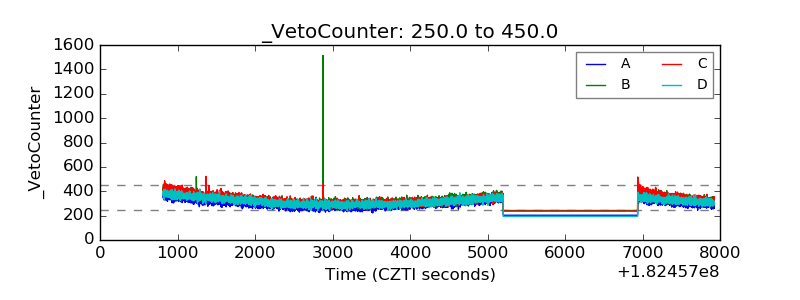 |